. 2012 Sep 26;13(9):R51.
doi: 10.1186/gb-2012-13-9-r51.

The GENCODE pseudogene resource

Affiliations

The GENCODE pseudogene resource

Baikang Pei et al. Genome Biol. .

Abstract

Background: Pseudogenes have long been considered as nonfunctional genomic sequences. However, recent evidence suggests that many of them might have some form of biological activity, and the possibility of functionality has increased interest in their accurate annotation and integration with functional genomics data.

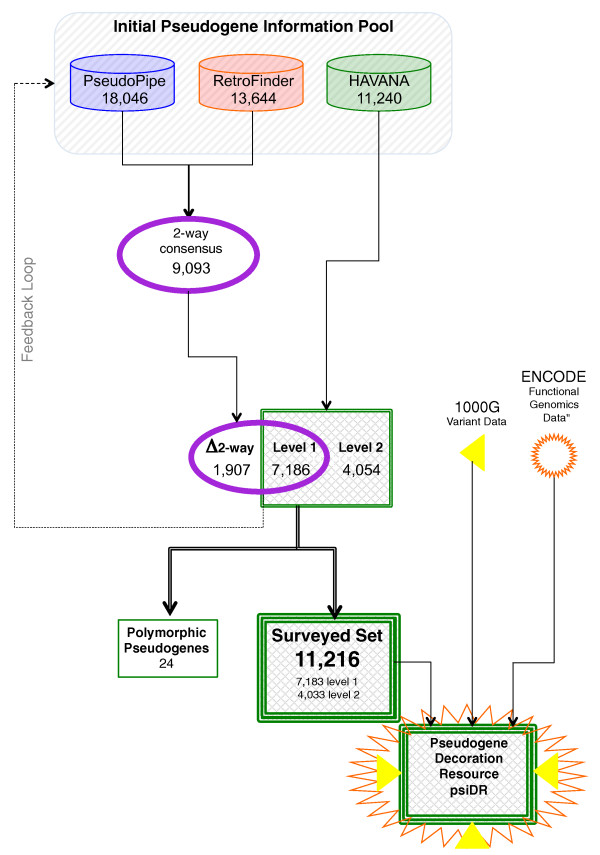
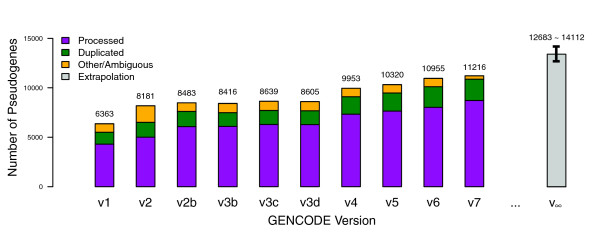
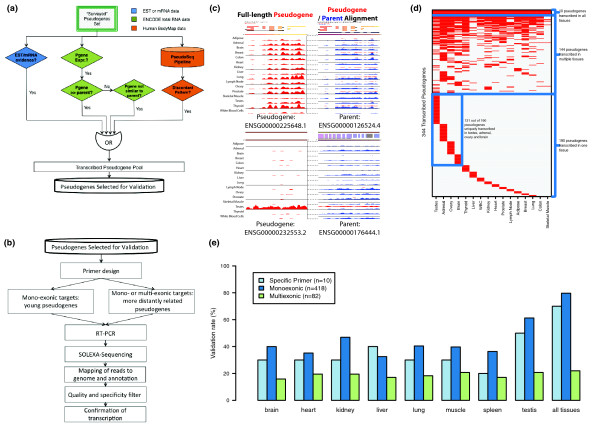
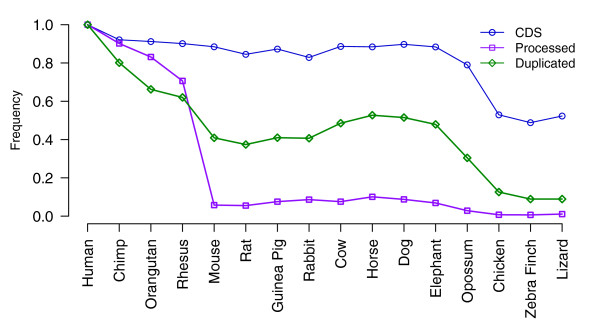
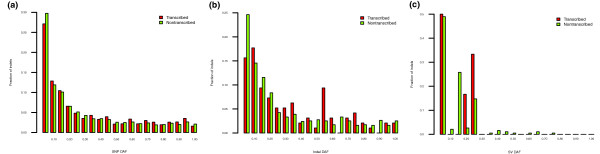
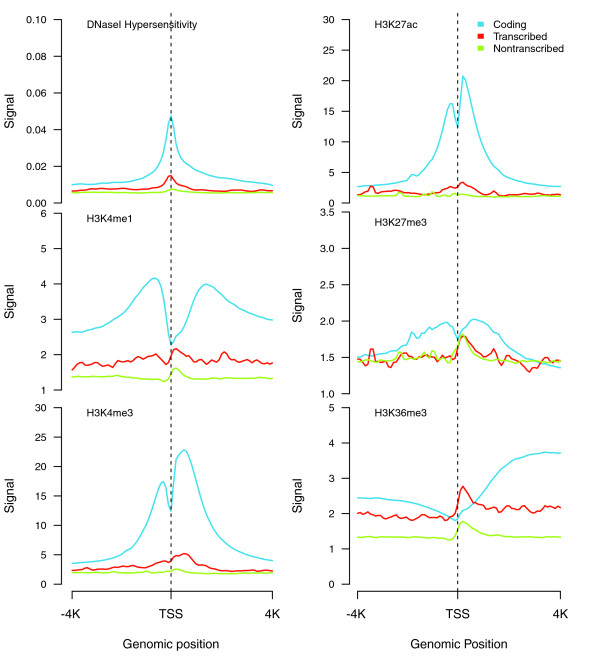
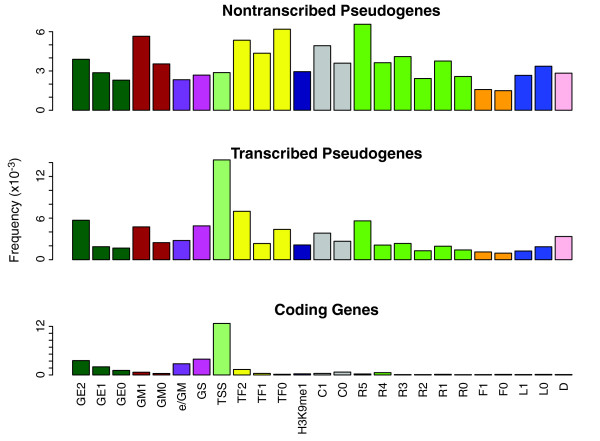
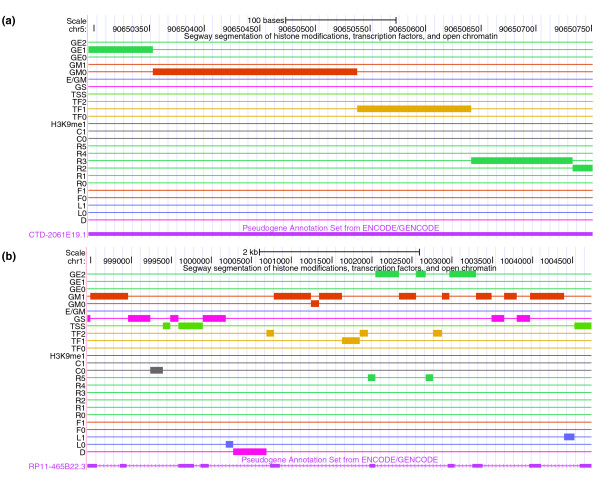
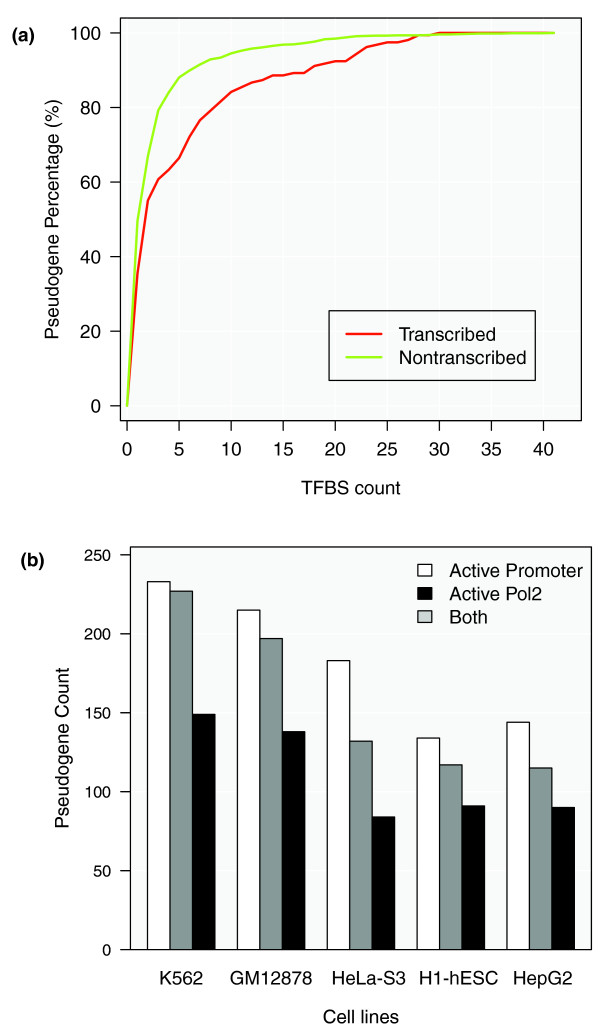
Results: As part of the GENCODE annotation of the human genome, we present the first genome-wide pseudogene assignment for protein-coding genes, based on both large-scale manual annotation and in silico pipelines. A key aspect of this coupled approach is that it allows us to identify pseudogenes in an unbiased fashion as well as untangle complex events through manual evaluation. We integrate the pseudogene annotations with the extensive ENCODE functional genomics information. In particular, we determine the expression level, transcription-factor and RNA polymerase II binding, and chromatin marks associated with each pseudogene. Based on their distribution, we develop simple statistical models for each type of activity, which we validate with large-scale RT-PCR-Seq experiments. Finally, we compare our pseudogenes with conservation and variation data from primate alignments and the 1000 Genomes project, producing lists of pseudogenes potentially under selection.

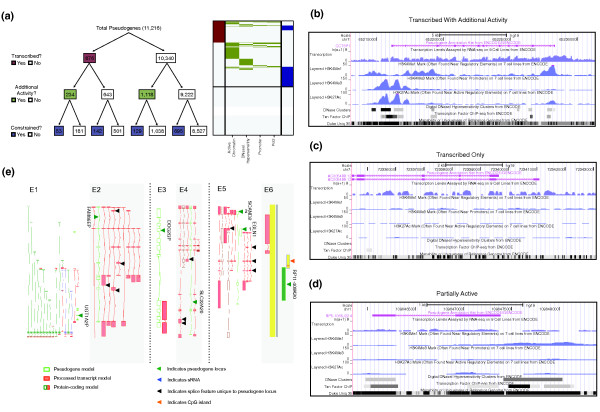
Conclusions: At one extreme, some pseudogenes possess conventional characteristics of functionality; these may represent genes that have recently died. On the other hand, we find interesting patterns of partial activity, which may suggest that dead genes are being resurrected as functioning non-coding RNAs. The activity data of each pseudogene are stored in an associated resource, psiDR, which will be useful for the initial identification of potentially functional pseudogenes.


Figures

Figure 1
Figure 1
Pseudogene annotation flowchart. A flowchart to describe the GENCODE pseudogene annotation procedure and the incorporation of functional genomics data from the 1000 Genomes (1000G) project and ENCODE. This is an integrated procedure including manual annotation done by the HAVANA team and two automated prediction pipelines: PseudoPipe and RetroFinder. The loci that are annotated by both PseudoPipe and RetroFinder are collected in a subset labeled as '2-way consensus', which is further intersected with the manually annotated HAVANA pseudogenes. The intersection results in three subsets of pseudogenes. Level 1 pseudogenes are loci that have been identified by all three methods (PseudoPipe, RetroFinder and HAVANA). Level 2 pseudogenes are loci that have been discovered through manual curation and were not found by either automated pipeline. Delta 2-way contains pseudogenes that have been identified only by computational pipelines and were not validated by manual annotation. As a quality control exercise to determine completeness of pseudogene annotation in chromosomes that have been manually annotated, 2-way consensus pseudogenes are analyzed by the HAVANA team to establish their validity and are included in the manually annotated pseudogene set if appropriate. The final set of pseudogenes is compared with functional genomics data from ENCODE and genomic variation data from the 1000 Genomes project.
Figure 2
Figure 2
Growth of pseudogene annotation. The numbers of pseudogenes present in the GENCODE dataset from version 1 to version 7 are plotted. The three colors - purple, green and yellow - represent processed, duplicated and other types of pseudogenes, respectively. The pseudogenes were annotated manually and/or using the automated pipelines PseudoPipe and RetroFinder. The gray bar indicates the estimated number of pseudogenes (± standard deviation present in the human genome.
Figure 3
Figure 3
Complexity of transcribed pseudogenes. Screenshots of pseudogene annotation are taken from the Zmap annotation interface. The pseudogenes are represented as open green boxes and indicated by dark green arrowheads, exons of associated transcript models are represented as filled red boxes and connections are shown by red lines. The coding exons of protein-coding models are represented by dark green boxes and UTR exons as filled red boxes; protein-coding models are also indicated by red arrowheads. (a-c) Single pseudogene models intersecting with single transcript models. (a) The processed pseudogene High mobility group box 1 pseudogene (HMGB1P; HAVANA gene ID: OTTHUMG00000172132 and its associated unspliced (that is, single exon) transcript. (b) The processed pseudogene Myotubularin related protein 12 pseudogene (MTMR12P; HAVANA gene ID: OTTHUMG00000167532) and a spliced transcript model with three exons. (c) A duplicated pseudogene PDZ domain containing 1 pseudogene 1 (PDZK1P1; HAVANA gene ID: OTTHUMG00000013746) and a spliced transcript model with nine exons. (d,e) Single pseudogene models intersecting with multiple transcripts. (d) The processed pseudogene Ribosomal protein, large, P0 pseudogene 1 (RPLP0P1; HAVANA gene ID: OTTHUMG00000158396) and five spliced transcripts. (e) The duplicated pseudogene Family with sequence similarity 86, member A pseudogene (FAM86AP; HAVANA gene ID: OTTHUMG00000159782) and four spliced transcripts. (f,g) Groups of multiple pseudogenes that are connected by overlapping transcripts. (f) Three pseudogenes with single connecting transcripts: 1 is the duplicated pseudogene von Willebrand factor pseudogene 1 (VWFP1; HAVANA gene ID: OTTHUMG00000143725); 2 is a duplicated pseudogene ankyrin repeat domain 62 pseudogene 1 (ANKRD62P1; HAVANA gene ID: OTTHUMG00000149993); 3 is the duplicated pseudogene poly (ADP-ribose) polymerase family, member 4 pseudogene 3 (PARP4P3; HAVANA gene ID: OTTHUMG00000142831). Pseudogene 1 and 2 are connected by a seven exon transcript, pseudogenes 2 and 3 are connected by a nine exon transcript and there is a third transcript that shares two of its four exons with pseudogene 2. (g) Two pseudogenes with multiple connecting transcripts: 1 is the processed pseudogene vitamin K epoxide reductase complex, subunit 1-like 1 pseudogene (VKORC1L1P; HAVANA gene ID: OTTHUMG00000156633); 2 is the duplicated pseudogene chaperonin containing TCP1, subunit 6 (zeta) pseudogene 3 (CCT6P3; HAVANA gene ID: OTTHUMG00000156630). The two pseudogenes are connected by two transcripts that initiate at the upstream pseudogene and utilize a splice donor site within the single exon, which is also a splice donor site in the pseudogene's parent locus. Interestingly, the downstream locus hosts two small nucleolar RNAs (snoRNAs) that are present in the parent locus and another paralog. (h) A very complex case where multiple pseudogenes, connected by multiple transcripts, read through into an adjacent protein-coding locus: 1 is the duplicated pseudogene suppressor of G2 allele of SKP1 (S. cerevisiae) pseudogene (SGT1P; HAVANA gene ID: OTTHUMG00000020323); 2 is a novel duplicated pseudogene (OTTHUMG00000167000); and the protein-coding gene is C9orf174, chromosome 9 open reading frame 174 (OTTHUMG00000167001). (i) A similarly complex case where multiple pseudogenes, connected by multiple transcripts, read through into an adjacent protein-coding locus: 1 is a duplicated pseudogene stromal antigen 3 pseudogene (STAGP3; HAVANA gene ID: OTTHUMG00000156884); 2 is a duplicated pseudogene poliovirus receptor related immunoglobulin domain containing pseudogene (PVRIGP; HAVANA gene ID: OTTHUMG00000156886); and the protein-coding gene is PILRB, paired immunoglobin-like type 2 receptor beta (OTTHUMG00000155363). sRNA, small RNA.
Figure 4
Figure 4
Sequence identity between pseudogenes and their parents. (a) Distribution of pseudogene sequence identity to coding exons (CDS) of parent genes. (b) Distribution of pseudogene sequence identity to 3' UTR of parent genes. (c) Scatter plot of sequence identity of all the pseudogenes to the CDS and UTR regions of their parents.
Figure 5
Figure 5
Transcription of pseudogenes. (a) Pipeline for computational identification of transcribed pseudogenes (Pgenes). The 'OR' gate (binary operator) indicates the acceptance criteria for a candidate to enter the transcribed pseudogene pool. Expressed pseudogene candidates showing transcription evidence in ESTs/mRNAs, total RNA-Seq data, and BodyMap data were sent for wet-lab validation by RT-PCR or RT-PCR-Seq. (b) Process flow of experimental evaluation of pseudogene transcription. (c) User interface of PseudoSeq for identifying transcribed pseudogenes with BodyMap data. (d) Transcribed pseudogenes identified using Human BodyMap data. (e) Experimental validation results showing the transcription of pseudogenes in different tissues.
Figure 6
Figure 6
Preservation of human coding sequences, processed pseudogenes and duplicated pseudogenes. Sequences orthologous to human genomic regions from different species were studied. The sequence preservation rate was calculated as the percentage of sequences aligned to human sequence from each species. The calculation was based on a MultiZ multiple genome sequence alignment.
Figure 7
Figure 7
(a) SNP-, (b) indel-, and (c) SV-derived allele frequency spectra are shown for transcribed and non-transcribed pseudogenes. The distributions of variant DAFs in transcribed and non-transcribed pseudogenes are not statistically different.
Figure 8
Figure 8
Chromatin signatures: DNaseI hypersensitivity and histone modification. Average chromatin accessibility profiles and various histone modifications surrounding the TSS for coding genes, transcribed pseudogenes, and non-transcribed pseudogenes. The coding gene histone modification profiles around the TSS follow known patterns - for example, enrichment of H3K4me1 around 1 kb upstream of the TSS and the H3K4me3 peaks close to the TSS [63]. Transcribed pseudogenes also show stronger H3K4 signals than non-transcribed pseudogenes. H3K27me3, a marker commonly associated with gene repression [64], showed depletion around the TSS for the coding gene and a distinctive peak in the same region for the pseudogenes. H3K36me3 also shows a similar pattern as H3K27me3 at TSSs, which may relate to nucleosome depletion.
Figure 9
Figure 9
Segmentation: comparison of chromatin segmentations associated with pseudogenes and parent genes. The transcribed pseudogenes were selected based on the following criteria: there is transcription evidence from GENCODE, BodyMap or mass spectrometry studies; there is no known overlap with annotated coding genes; and there are no neighboring protein-coding gene TSSs 4 kb upstream or downstream of the pseudogene start.
Figure 10
Figure 10
Examples of pseudogenes with active chromatin states. (a) Processed pseudogenes (Ensembl gene ID: ENST00000495909; genomic location chr5: 90650295-90650751). This pseudogene shows marks of activity based on segmentation-activity selection criterion 2. (b) Transcribed duplicated pseudogene (Ensembl gene ID: ENST00000412397.1; genomic location chr1: 998456-1004735). This pseudogene shows marks of activity based on segmentation-activity selection criterion 1.
Figure 11
Figure 11
Transcription factor binding sites upstream of pseudogenes. (a) Distribution of pseudogenes with different numbers of TFBSs in their upstream sequences. Profiles from transcribed pseudogenes and non-transcribed pseudogenes are compared. Data are from the K562 cell line. (b) Number of pseudogenes with active promoters, active Pol2 binding sites or both in different cell lines.
Figure 12
Figure 12
Summary of pseudogene annotation and case studies. (a) A heatmap showing the annotation for transcribed pseudogenes including active chromatin segmentation, DNaseI hypersensitivity, active promoter, active Pol2, and conserved sequences. Raw data were from the K562 cell line. (b) A transcribed duplicated pseudogene (Ensembl gene ID: ENST00000434500.1; genomic location, chr7: 65216129-65228323) showing consistent active chromatin accessibility, histone marks, and TFBSs in its upstream sequences. (c) A transcribed processed pseudogene (Ensembl gene ID: ENST00000355920.3; genomic location, chr7: 72333321-72339656) with no active chromatin features or conserved sequences. (d) A non-transcribed duplicated pseudogene showing partial activity patterns (Ensembl gene ID: ENST00000429752.2; genomic location, chr1: 109646053-109647388). (e) Examples of partially active pseudogenes. E1 and E2 are examples of duplicated pseudogenes. E1 shows UGT1A2P (Ensembl gene ID: ENST00000454886), indicated by the green arrowhead. UTG1A2P is a non-transcribed pseudogene with active chromatin and it is under negative selection. Coding exons of protein-coding paralogous loci are represented by dark green boxes and UTR exons by filled red boxes. E2 shows FAM86EP (Ensembl gene ID: ENST00000510506) as open green boxes, which is a transcribed pseudogene with active chromatin and upstream TFBSs and Pol2 binding sites. The transcript models associated with the locus are displayed as filled red boxes. Black arrowheads indicate features novel to the pseudogene locus. E3 and E4 show two unitary pseudogenes. E3 shows DOC2GP (Ensembl gene ID: ENST00000514950) as open green boxes, and transcript models associated with the locus are shown as filled red boxes. E4 shows SLC22A20 (Ensembl gene ID: ENST00000530038). Again, the pseudogene model is represented as open green boxes, transcript models associated with the locus as filled red boxes, and black arrowheads indicate features novel to the pseudogene locus. E5 and E6 show two processed pseudogenes. E5 shows pseudogene EGLN1 (Ensembl gene ID: ENST00000531623) inserted into duplicated pseudogene SCAND2 (Ensembl gene ID: ENST00000541103), which is a transcribed pseudogene showing active chromatin but no upstream regulatory regions as seen in the parent gene. The pseudogene models are represented as open green boxes, transcript models associated with the locus are displayed as filled red boxes, and black arrowheads indicate features novel to the pseudogene locus. E6 shows a processed pseudogene RP11-409K20 (Ensembl gene ID: ENST00000417984; filled green box), which has been inserted into a CpG island, indicated by an orange arrowhead. sRNA, small RNA.

References

    1. Mighell AJ, Smith NR, Robinson PA, Markham AF. Vertebrate pseudogenes. FEBS Lett. 2000;468:109–114. doi: 10.1016/S0014-5793(00)01199-6. - DOI - PubMed
    1. Harrison PM, Echols N, Gerstein MB. Digging for dead genes: an analysis of the characteristics of the pseudogene population in the Caenorhabditis elegans genome. Nucleic Acids Res. 2001;29:818–830. doi: 10.1093/nar/29.3.818. - DOI - PMC - PubMed
    1. Echols N, Harrison PM, Balasubramanian S, Luscombe NM, Bertone P, Zhang Z, B GM. Comprehensive analysis of amino acid and nucleotide composition in eukaryotic genomes comparing genes and pseudogenes. Nucleic Acids Res. 2002;30:2515–2523. doi: 10.1093/nar/30.11.2515. - DOI - PMC - PubMed
    1. Balakirev E, Ayala F. Pseudogenes: are they "junk" or functional DNA? Annu Rev Genet. 2003;37:123–151. doi: 10.1146/annurev.genet.37.040103.103949. - DOI - PubMed
    1. Zhang ZD, Frankish A, Hunt T, Harrow J, Gerstein MB. Identification and analysis of unitary pseudogenes: historic and contemporary gene losses in humans and other primates. Genome Biol. 2010;11:R26. doi: 10.1186/gb-2010-11-3-r26. - DOI - PMC - PubMed

Publication types