Neuroimaging correlates of pathologically defined subtypes of Alzheimer's disease: a case-control study
- PMID: 22951070
- PMCID: PMC3490201
- DOI: 10.1016/S1474-4422(12)70200-4
Neuroimaging correlates of pathologically defined subtypes of Alzheimer's disease: a case-control study
Abstract
Background: Three subtypes of Alzheimer's disease (AD) have been pathologically defined on the basis of the distribution of neurofibrillary tangles: typical AD, hippocampal-sparing AD, and limbic-predominant AD. Compared with typical AD, hippocampal-sparing AD has more neurofibrillary tangles in the cortex and fewer in the hippocampus, whereas the opposite pattern is seen in limbic-predominant AD. We aimed to determine whether MRI patterns of atrophy differ between these subtypes and whether structural neuroimaging could be a useful predictor of pathological subtype at autopsy.
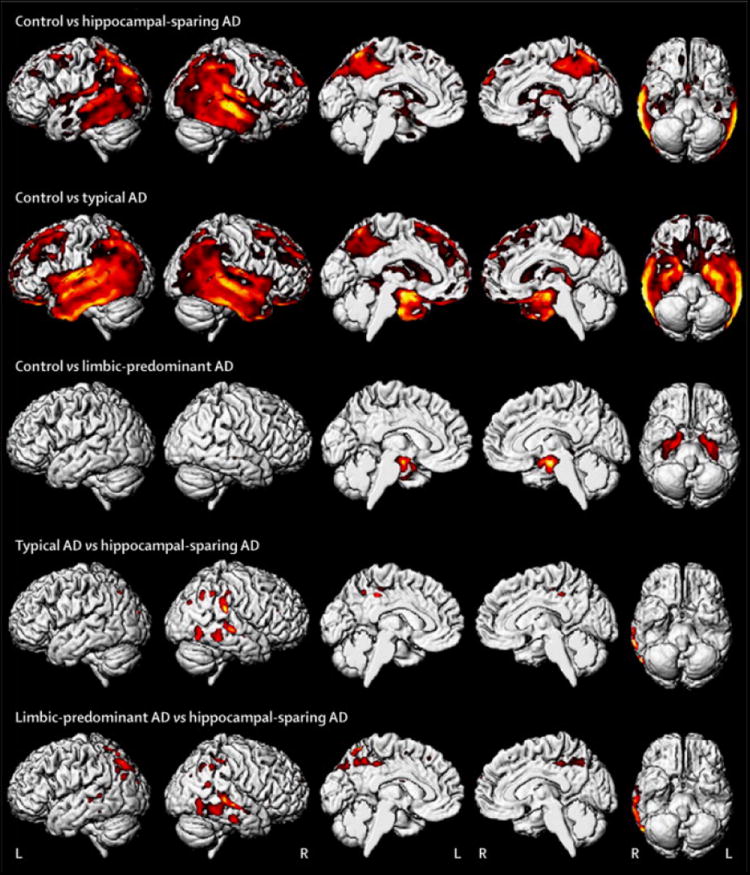
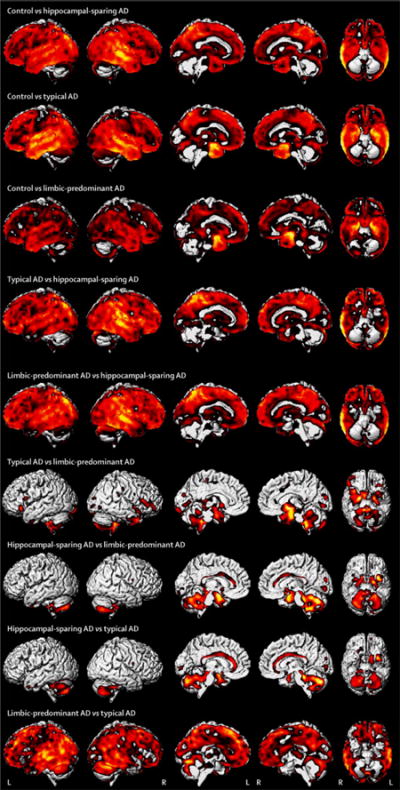
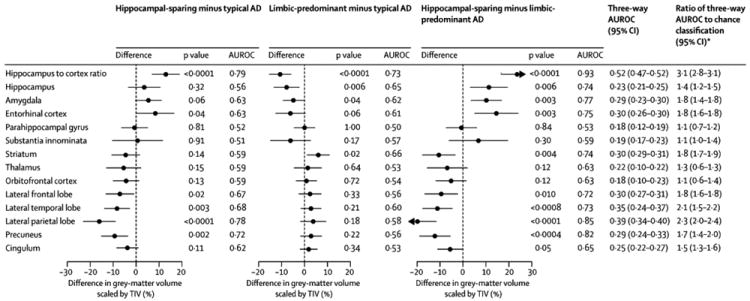
Methods: We identified patients who had been followed up in the Mayo Clinic Alzheimer's Disease Research Center (Rochester, MN, USA) or in the Alzheimer's Disease Patient Registry (Rochester, MN, USA) between 1992 and 2005. To be eligible for inclusion, participants had to have had dementia, AD pathology at autopsy (Braak stage ≥IV and intermediate to high probability of AD), and an ante-mortem MRI. Cases were assigned to one of three pathological subtypes--hippocampal-sparing, limbic-predominant, and typical AD--on the basis of neurofibrillary tangle counts in hippocampus and cortex and ratio of hippocampal to cortical burden, without reference to neuronal loss. Voxel-based morphometry and atlas-based parcellation were used to compare patterns of grey matter loss between groups and with age-matched control individuals. Neuroimaging was obtained at the time of first presentation. To summarise pair-wise group differences, we report the area under the receiver operator characteristic curve (AUROC).
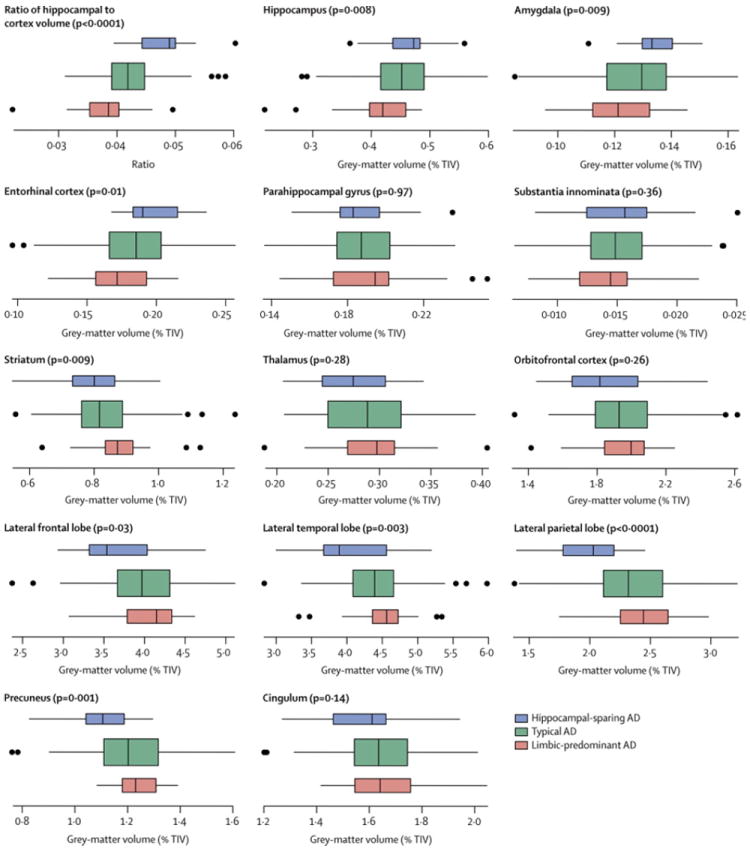
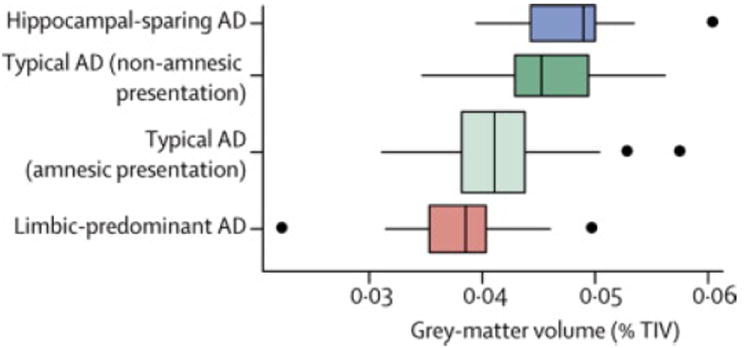
Findings: Of 177 eligible patients, 125 (71%) were classified as having typical AD, 33 (19%) as having limbic-predominant AD, and 19 (11%) as having hippocampal-sparing AD. Most patients with typical (98 [78%]) and limbic-predominant AD (31 [94%]) initially presented with an amnestic syndrome, but fewer patients with hippocampal-sparing AD (eight [42%]) did. The most severe medial temporal atrophy was recorded in patients with limbic-predominant AD, followed by those with typical disease, and then those with hippocampal-sparing AD. Conversely, the most severe cortical atrophy was noted in patients with hippocampal-sparing AD, followed by those with typical disease, and then limbic-predominant AD. The ratio of hippocampal to cortical volumes allowed the best discrimination between subtypes (p<0·0001; three-way AUROC 0·52 [95% CI 0·47-0·52]; ratio of AUROC to chance classification 3·1 [2·8-3·1]). Patients with typical AD and non-amnesic initial presentation had a significantly higher ratio of hippocampal to cortical volumes (median 0·045 [IQR 0·035-0·056]) than did those with an amnesic presentation (0·041 [0·031-0·057]; p=0·001).
Interpretation: Patterns of atrophy on MRI differ across the pathological subtypes of AD. MRI regional volumetric analysis can reliably track the distribution of neurofibrillary tangle pathology and can predict pathological subtype of AD at autopsy.
Funding: US National Institutes of Health (National Institute on Aging).
Copyright © 2012 Elsevier Ltd. All rights reserved.
Conflict of interest statement
The authors have no conflicts of interest relevant to this manuscript
Figures
Comment in
-
Clinical stratification of subtypes of Alzheimer's disease.Lancet Neurol. 2012 Oct;11(10):839-41. doi: 10.1016/S1474-4422(12)70209-0. Lancet Neurol. 2012. PMID: 22995685 No abstract available.
References
-
- Braak H, Braak E. Neuropathological stageing of Alzheimer-related changes. Acta neuropathologica. 1991;82:239–259. - PubMed
-
- Gosche KM, Mortimer JA, Smith CD, et al. Hippocampal volume as an index of Alzheimer neuropathology: findings from the Nun Study. Neurology. 2002;58:1476–1482. - PubMed
-
- Csernansky JG, Hamstra J, Wang L, et al. Correlations between antemortem hippocampal volume and postmortem neuropathology in AD subjects. Alzheimer disease and associated disorders. 2004;18:190–195. - PubMed
Publication types
MeSH terms
Grants and funding
LinkOut - more resources
Full Text Sources
Medical