. 2012 Dec;8(12):1741-56.
doi: 10.4161/auto.21858. Epub 2012 Sep 5.

ATP is released from autophagic vesicles to the extracellular space in a VAMP7-dependent manner

Affiliations

ATP is released from autophagic vesicles to the extracellular space in a VAMP7-dependent manner

Claudio Marcelo Fader et al. Autophagy. 2012 Dec.

Abstract

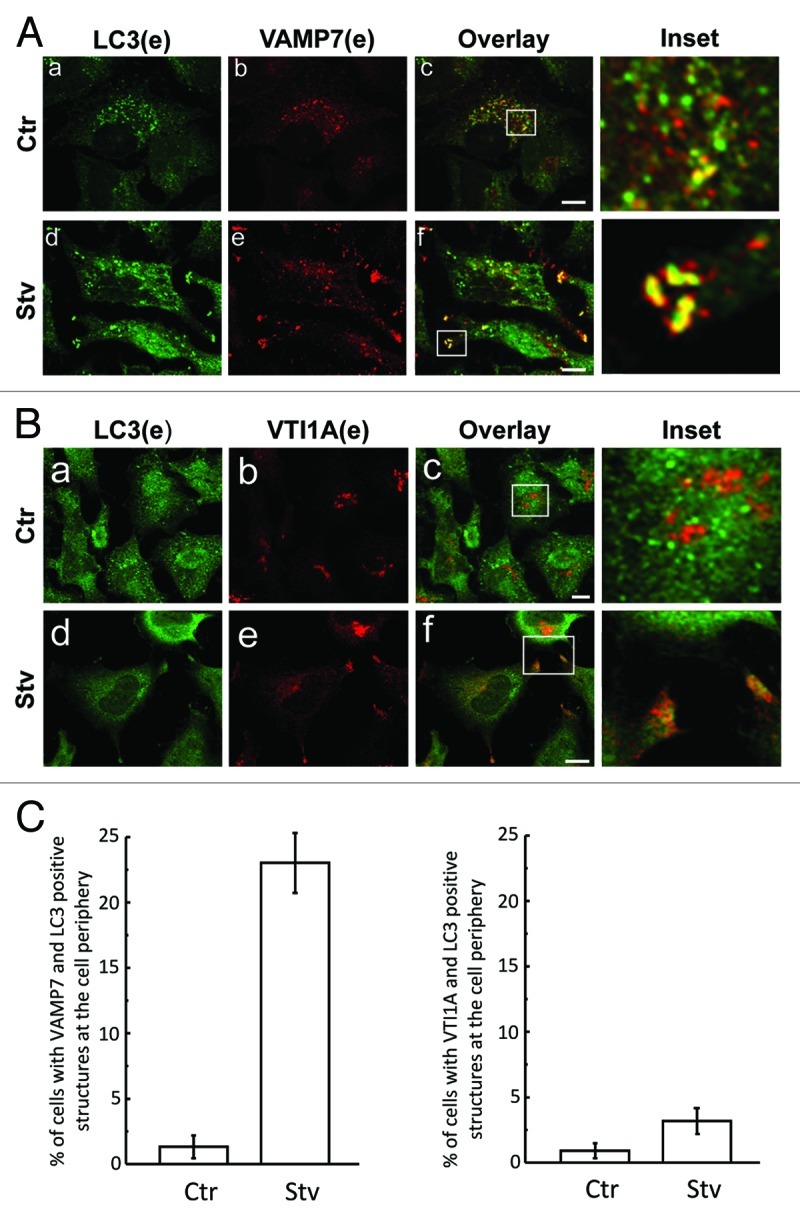
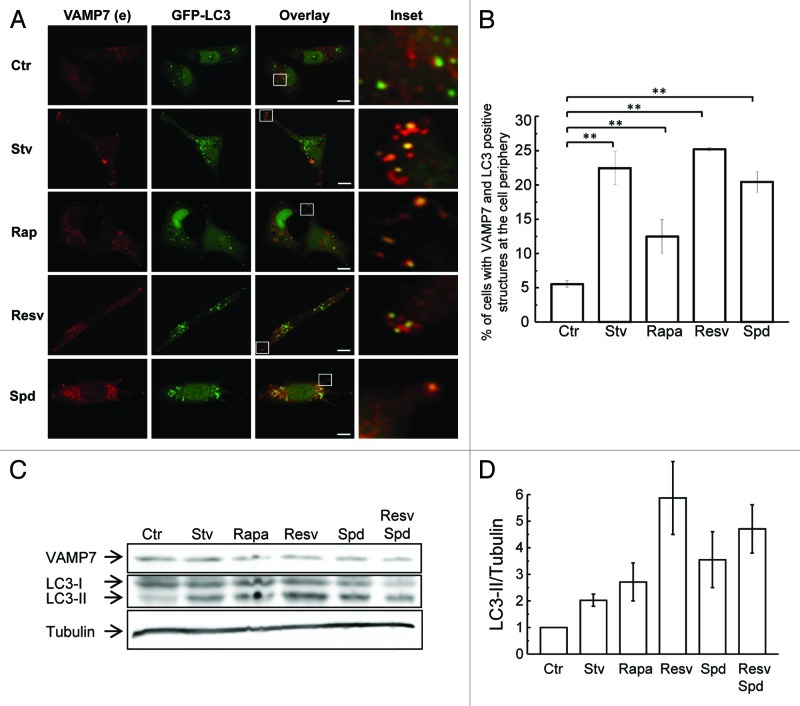
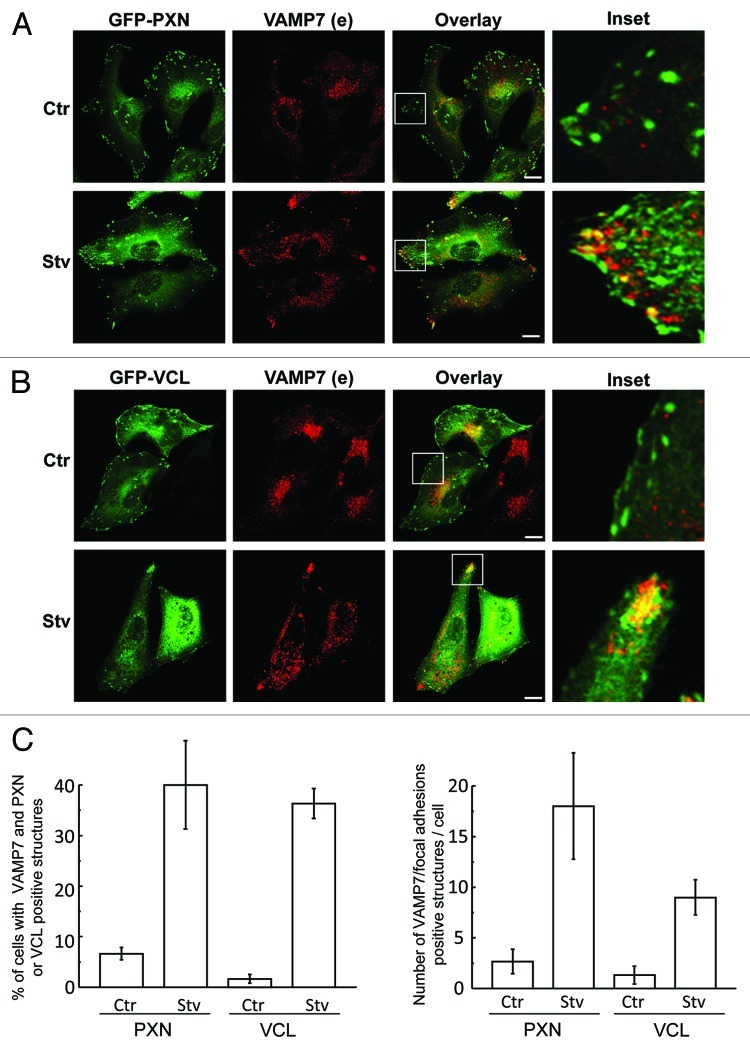
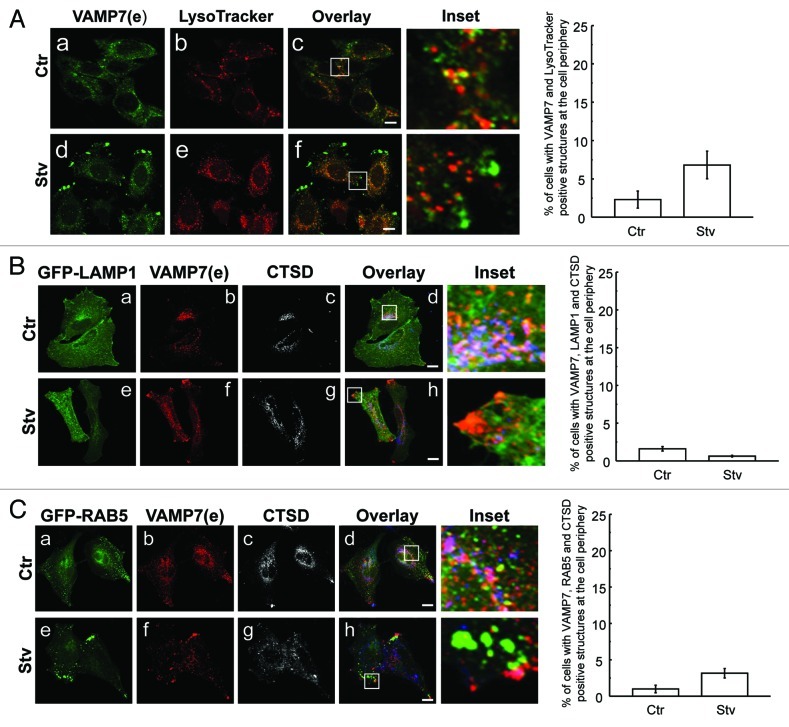
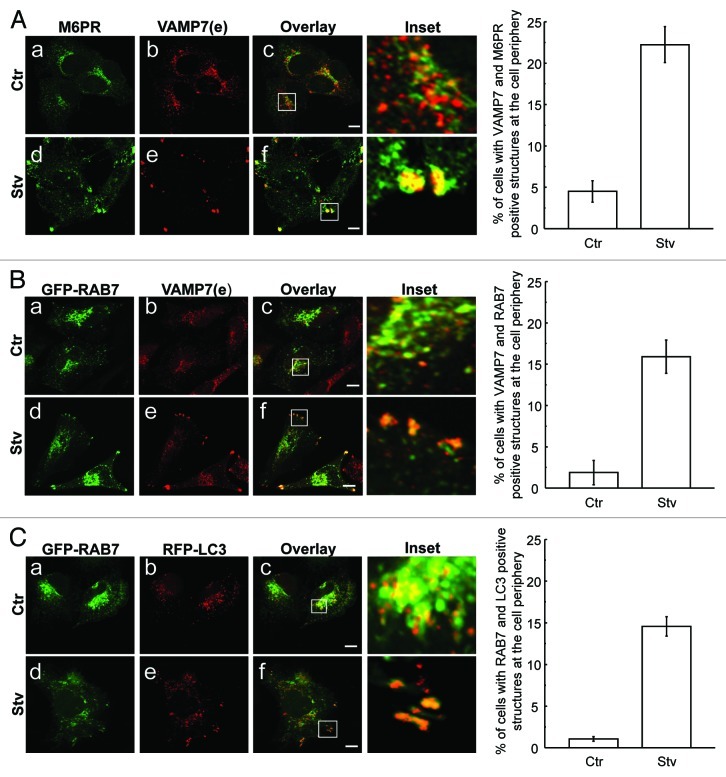
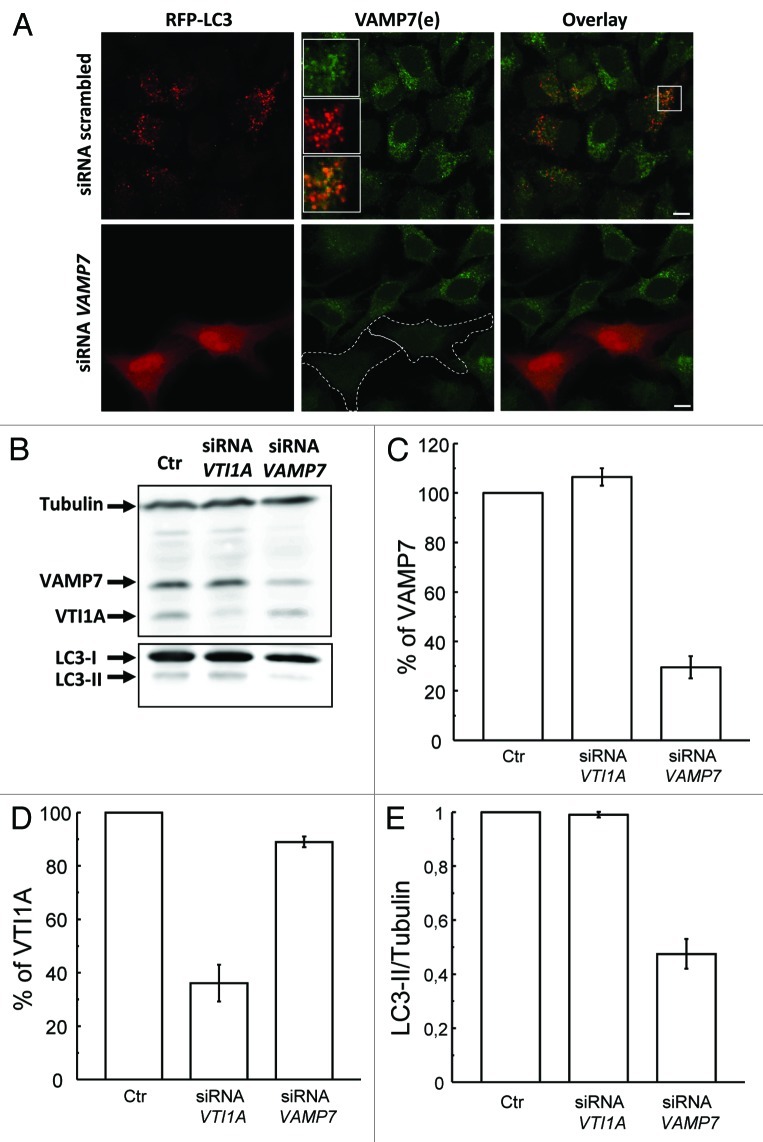
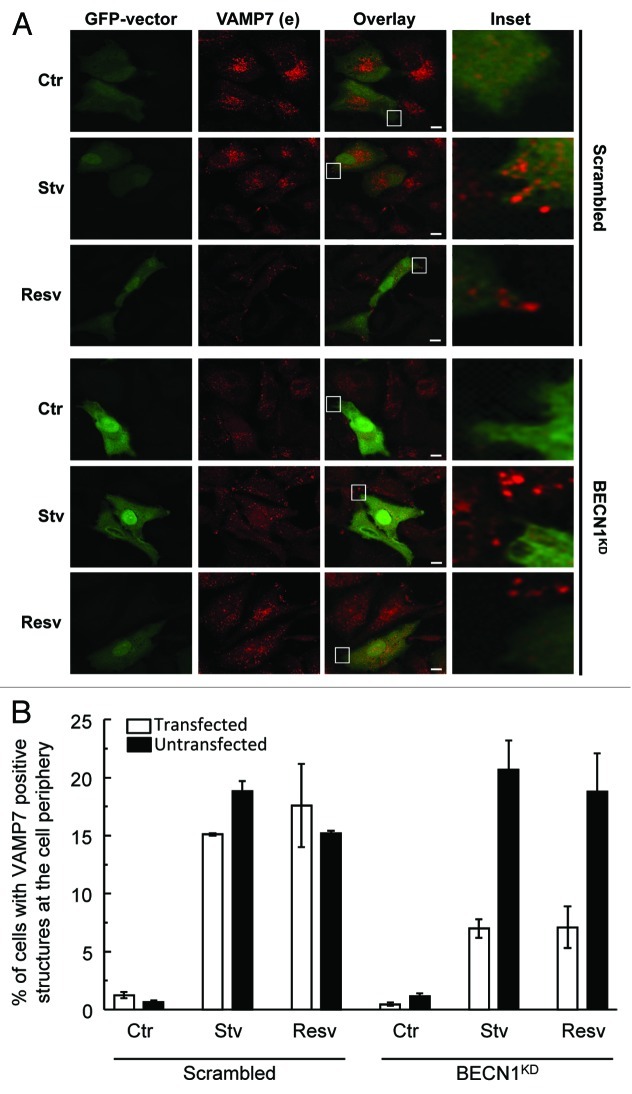
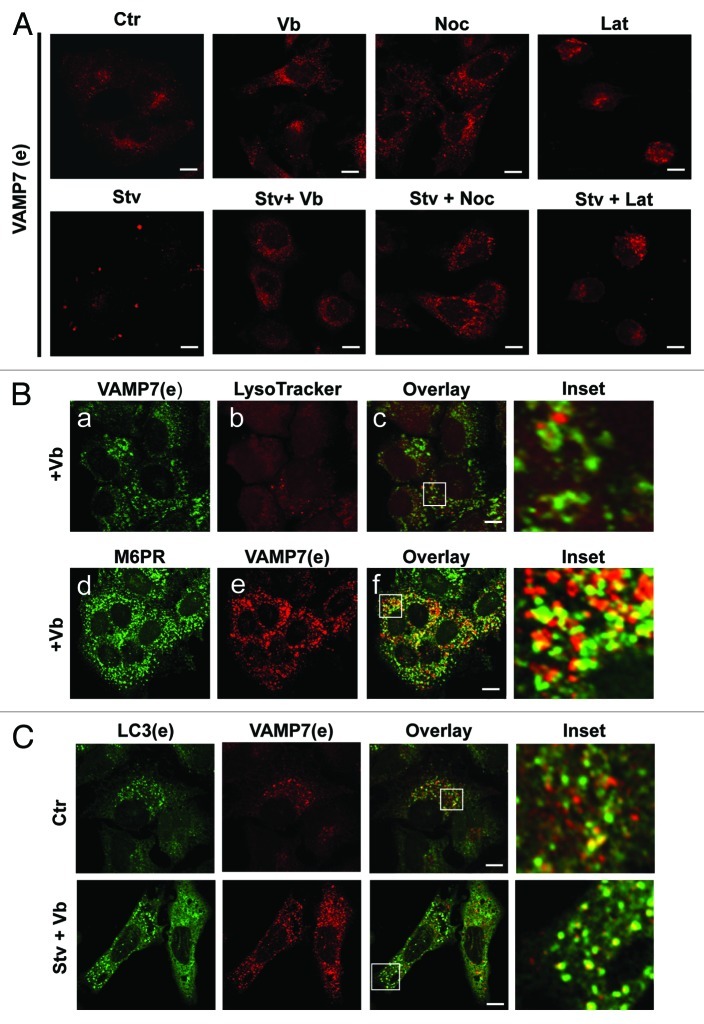
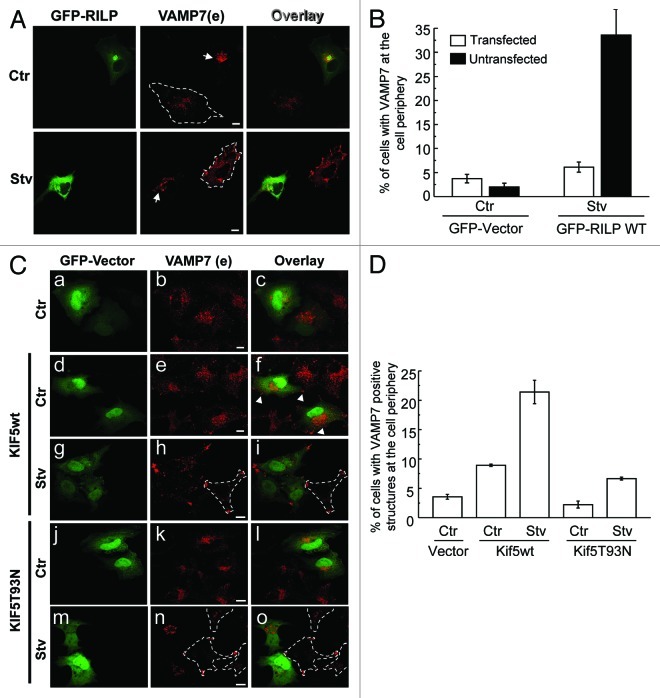
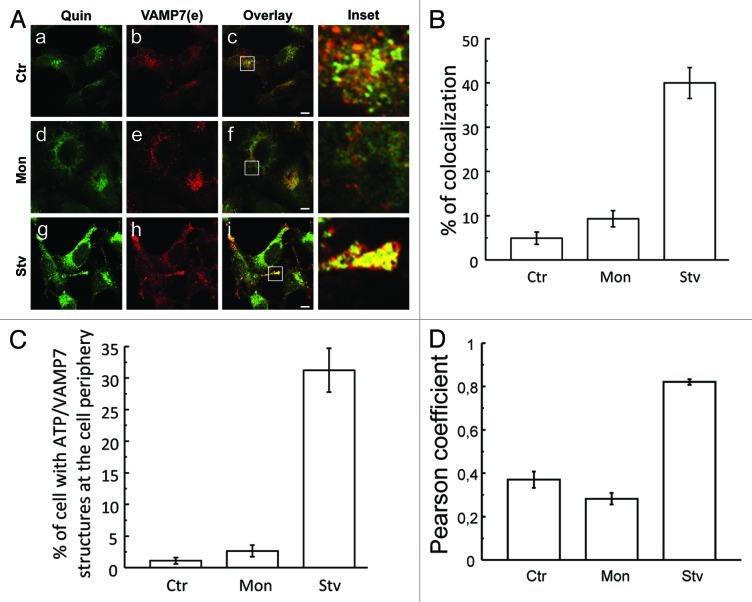
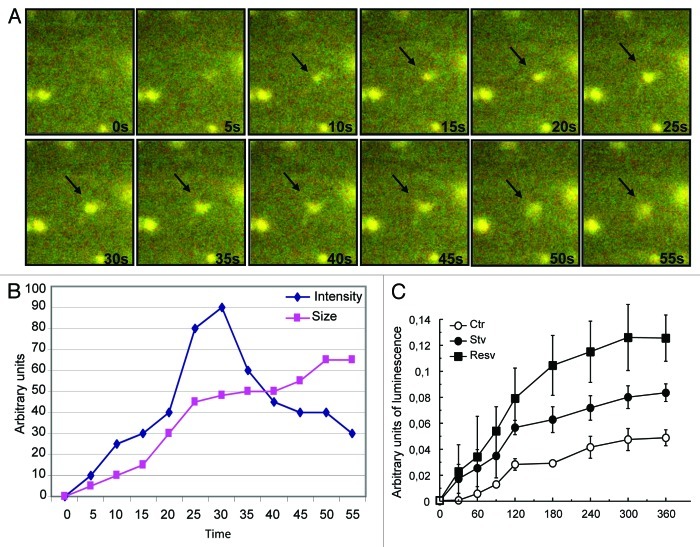
Autophagy is a normal degradative pathway that involves the sequestration of cytoplasmic components and organelles in a vacuole called autophagosome. SNAREs proteins are key molecules of the vesicle fusion machinery. Our results indicate that in a mammalian tumor cell line a subset of VAMP7 (V-SNARE)-positive vacuoles colocalize with LC3 at the cell periphery (focal adhesions) upon starvation. The re-distribution of VAMP7 positive structures is a microtubule-dependent event, with the participation of the motor protein KIF5 and the RAB7 effector RILP. Interestingly, most of the VAMP7-labeled vesicles were loaded with ATP. Moreover, in cells subjected to starvation, these structures fuse with the plasma membrane to release the nucleotide to the extracellular medium. Summarizing, our results show the molecular components involved in the release of ATP to extracellular space, which is recognized as an important autocrine/paracrine signal molecule that participates in the regulation of several cellular functions such as immunogenicity of cancer cell death or inflammation.


Figures

None
Figure 1. VAMP7- but not VTI1A-positive autophagosomes are redistributed to the cell periphery upon starvation. HeLa cells were incubated for 4 h in amino acid and serum-free media (Stv, d–f) or in full nutrient media (Ctr, a–c). Cells were fixed and LC3, VAMP7 (A) or VTI1A (B) proteins were detected by indirect immunofluorescence. Images were obtained by confocal microscopy. Scale bars: 5 μm. Mean of the Pearson’s coefficient for (A) Ctr: 0.32, Stv: 0.69 (B) Ctr: 0.25, Stv: 0.39. (C) The percentage of cells with VAMP7 and LC3 (right panel) or VTI1A and LC3 (left panel) positive structures at the cell periphery in starvation conditions was quantified from images as the ones displayed in (A and B) and represent the mean ± SEM of three independent experiments. At least 100 cells were counted in each condition.
None
Figure 2. Autophagic inductors cause a redistribution of VAMP7-positive autophagosomes to the cell periphery. (A) HeLa cells overexpressing GFP-LC3 were incubated for 4 h in starvation media (Stv) or 3 h in complete media in the absence (Ctr) or presence of rapamycin (Rapa), resveratrol (Resv) or spermidine (Spd). Cells were fixed and VAMP7 was detected by indirect immunofluorescence. Images were obtained by confocal microscopy. Scale bars: 5 μm. Mean of the Pearson’s coefficient are Ctr: 0.23, Stv: 0.8, Rapa: 0.76, Resv: 0.83, Spd: 0.79. (B) The percentage of cells with VAMP7 and LC3-positive structures at the cell periphery was quantified from images as those displayed in (A) and represent the mean ± SEM of two independent experiments. ** Significantly different from the control, p ˂ 0.005. (C) HeLa cells incubated for 4 h in starvation media (Stv) or 3 h in complete media (Ctr) in the absence or presence of rapamycin (Rapa), resveratrol (Resv), spermidine (Spd) or resveratrol + spermidine (Resv + Spd) were lysed with 1% Triton X100 in PBS. Samples were subjected to SDS-PAGE and transferred onto a nitrocellulose membrane as described in Materials and Methods. The membrane was incubated with a rabbit anti-LC3, a mouse anti-VAMP7 and the corresponding HRP-labeled secondary antibodies, and subsequently developed with an enhanced chemiluminescence detection kit. (D) The LC3-II/tubulin ratio was measured from images as those displayed in (C). Images are representative of two independent experiments.
None
Figure 3. VAMP7-labeled vesicles are localized at the focal adhesions in starvation conditions. Transfected HeLa cells overexpressing pEGFP-PXN (A) or pGFP-VCL (B) were incubated for 4 h in amino acid and serum-free media (Stv) or in full nutrient media (Ctr). Cells were fixed and VAMP7 (red) protein was detected by indirect immunofluorescence. Images were obtained by confocal microscopy. Scale bars: 5 μm. Mean of the Pearson’s coefficient for (A) Ctr: 0.22, Stv: 0.81 (B) Ctr: 0.25, Stv: 0.8. (C) The percentage of cells with VAMP7 and PXN or VCL positive structures (left panel) as well as the number of VAMP7/focal adhesions positive structures per cell (right panel) was determined from images as those displayed in (A and B) and represent the mean ± SEM of two independent experiments. At least 50 cells were counted in each condition.
None
Figure 4. VAMP7 structures redistributed by starvation are only partially labeled with lysosomal markers. HeLa cells were incubated in starvation media (d–f) or in complete media (a–c). (A) cells were incubated with LysoTracker Red and then endogenous VAMP7 (green) was detected by indirect immunofluorescence. Mean of the Pearson’s coefficient Ctr: 0.29, Stv: 0.27. (B) HeLa cells overexpressing GFP-LAMP1 (lysosomal marker) were incubated in complete media or starvation media. Endogenous CTSD (blue) and VAMP7 (red) were detected by indirect immunofluorescence (IF). Mean of the Pearson’s coefficient Ctr: 0.26, Stv: 0.21. (C) HeLa cells overexpressing GFP-RAB5 were incubated in complete media or starvation media. Endogenous CTSD (blue) and VAMP7 (red) were detected by indirect IF. Mean of Pearson’s coefficient Ctr: 0.21, Stv: 0.21. Images were obtained by confocal microscopy. Scale bars: 5 μm.
None
Figure 5. Late endosomal markers colocalize with VAMP7 at the cell tips upon starvation conditions. (A) Endogenous VAMP7 (red) and M6PR (green) were detected by indirect immunofluorescence (IF). Mean of Pearson’s coefficient Ctr: 0.41, Stv: 0.82. Images were obtained by confocal microscopy. (B) HeLa cells overexpressing GFP-RAB7 were incubated in complete media or starvation media. Endogenous VAMP7 (red) was detected by indirect IF. Mean of Pearson’s coefficient Ctr: 0.34, Stv: 0.76. Images were obtained by confocal microscopy. (C) Transiently cotransfected HeLa cells overexpressing GFP-RAB7 and RFP-LC3 were incubated in complete media or starvation media. Mean of Pearson’s coefficient Ctr: 0.21, Stv: 0.77. Cells were mounted on coverslips and immediately analyzed by confocal microscopy. Scale bars: 5 μm.
None
Figure 6. VAMP7 but not VTI1A is required to autophagosome formation. (A) HeLa cells were cotransfected with RFP-LC3 plasmid and a scrambled siRNA or a siRNA against VAMP7. Cells were fixed and VAMP7 was detected by indirect immunofluorescence. Images were obtained by confocal microscopy. Scale bars: 5 μm. (B) HeLa cells transfected with the scrambled siRNA (Ctr), siRNA against VAMP7 or siRNA against VTI1A were lysed with 1% Triton X100 in PBS. Samples were subjected to SDS-PAGE and transferred onto a nitrocellulose membrane as described in Materials and Methods. The membrane was incubated with a rabbit anti-LC3, a mouse anti-VAMP7, mouse anti-VTI1A and the corresponding HRP-labeled secondary antibodies, and subsequently developed with an enhanced chemiluminescence detection kit. (C and D) The percentage of VAMP7 and VTI1A were quantified from images as the ones displayed in (B). (E) The LC3II/tubulin ratio was measured from images as those displayed in (B). Images are representative of two independent experiments.
None
Figure 7. BECN1 is necessary for autophagy-induced transport of VAMP7 structures to focal adhesions. (A) HeLa cells were cotransfected with a GFP-Vector plasmid and a pSUPER scrambled or a pSUPER BECN1KD. Cells were incubated for 4 h in starvation media (Stv) or 3 h in complete media in absence (Ctr) or presence of resveratrol (Resv). Then, cells were fixed and VAMP7 was detected by indirect immunofluorescence. Images were obtained by confocal microscopy. Scale bars: 5 μm. (B) The percentage of cells with VAMP7-positive structures at the cell periphery were quantified from images as the ones displayed in (A). White and black bars indicates transfected and untransfected cells respectively in each condition studied and represent the mean ± SEM of two independent experiments. At least 100 cells were counted in each condition.
None
Figure 8. Vinblastin impairs the VAMP7 redistribution at the focal adhesions induced by starvation. (A) HeLa cells were incubated in complete media or in starvation media in the absence or the presence of latrunculin B (Lat), vinblastin (Vb) or nocodazole (Noc). Endogenous Vamp7 was detected by indirect immunofluorescence (IF). (B) Hela cells were incubated in the presence of vinblastin (Vb). A population of cells was incubated with LysoTracker Red (upper panel) to label the lysosomes. Endogenous VAMP7 (lower panel) was detected by indirect IF (green). In another subset of cells, endogenous M6PR and VAMP7 were detected by indirect IF. (C) HeLa cells were incubated in complete media or in starvation media in the presence of Vb. Endogenous LC3 and VAMP7 proteins were detected by indirect IF. Images were obtained by confocal microscopy. Scale bars: 5 μm.
None
Figure 9. VAMP7-positive vesicles are transported by proteins involved in microtubule-mediated trafficking. (A) HeLa cells overexpressing GFP-RILP were incubated for 4 h in complete media or starvation. Endogenous VAMP7 was detected by indirect immunofluorescence (IF). Scale bars: 5 μm. Arrows: VAMP7 structures localized at the perinuclear region. (B) The percentage of cells with VAMP7 at the cell periphery was quantified from images as those displayed in (A) and represent the mean ± SEM of two independent experiments. At least 50 cells were counted in each condition. (C) HeLa cells co-transfected with GFP-vector and pcDNA-Kif5 wt or pcDNA-Kif5T93N were incubated for 4h in complete media or in an amino acid, serum-free media. Endogenous VAMP7 was detected by indirect IF. Arrows: VAMP7 structures localized at the cell tips. Scale bars: 5 μm. Images were obtained by confocal microscopy. (D) The percentage of cells with VAMP7 positive structures at the cell periphery was quantified from images as those displayed in (C) and represent the mean ± SEM of two independent experiments.
None
Figure 10. Starvation caused an increased number of ATP-loaded vesicles labeled with VAMP7 at the cell periphery. (A) HeLa cells were incubated in starvation media (Stv) or in complete media in the absence (Ctr) or presence of monensin (Mon). Afterwards, cells were incubated with 25 µM of quinacrine (Quin) for 20 min and subjected to indirect immunofluorescence to detect endogenous VAMP7. Images were obtained by confocal microscopy. Scale bars: 5 μm. The percentage of colocalization (B) and the percentage of cells with ATP/VAMP7-labeled vesicles at the cell periphery (C) were quantified from images as those displayed in (A). At least 100 cells were counted in each condition.
None
Figure 11. TIRF analyses of exocytic events in transfected HeLa cells. Cells were transiently transfected with RFP-LC3 (red) and autophagy was induced by starvation media for 6 h. Cells were incubated with 25 µM of quinacrine for 20 min (green). (A) Time in seconds corresponding to each frame is indicated. Arrows indicate the exocytic site on the cell surface. (B) The fluorescence intensity (diamonds) and the size (squares) of the LC3 and quinacrine-positive structure were quantified from the image displayed in (A). (C) HeLa cells were grown to confluence in 6-well plate. Cells were washed with PBS and incubated at 37°C in amino acid and serum-free media (Stv) or in full nutrient (Ctr) in the presence or absence of resveratrol (Resv). Aliquots of the culture media (50 µl) were collected every 30 min for 6 h and incubated with 50 µl firefly luciferin–luciferase as described in Materials and Methods. ATP dependent chemiluminescence activity of the media samples was measured in constant darkness using a luminometer.

References

    1. Knecht E, Aguado C, Cárcel J, Esteban I, Esteve JM, Ghislat G, et al. Intracellular protein degradation in mammalian cells: recent developments. Cell Mol Life Sci. 2009;66:2427–43. doi: 10.1007/s00018-009-0030-6. - DOI - PMC - PubMed
    1. Cuervo AM. The plasma membrane brings autophagosomes to life. Nat Cell Biol. 2010;12:735–7. doi: 10.1038/ncb0810-735. - DOI - PubMed
    1. Hailey DW, Rambold AS, Satpute-Krishnan P, Mitra K, Sougrat R, Kim PK, et al. Mitochondria supply membranes for autophagosome biogenesis during starvation. Cell. 2010;141:656–67. doi: 10.1016/j.cell.2010.04.009. - DOI - PMC - PubMed
    1. Hayashi-Nishino M, Fujita N, Noda T, Yamaguchi A, Yoshimori T, Yamamoto A. A subdomain of the endoplasmic reticulum forms a cradle for autophagosome formation. Nat Cell Biol. 2009;11:1433–7. doi: 10.1038/ncb1991. - DOI - PubMed
    1. Mari M, Griffith J, Rieter E, Krishnappa L, Klionsky DJ, Reggiori F. An Atg9-containing compartment that functions in the early steps of autophagosome biogenesis. J Cell Biol. 2010;190:1005–22. doi: 10.1083/jcb.200912089. - DOI - PMC - PubMed

Publication types

MeSH terms