. 2012 Nov;86(22):12330-40.
doi: 10.1128/JVI.01699-12. Epub 2012 Sep 5.

Persistence of Epstein-Barr virus in self-reactive memory B cells

Affiliations

Persistence of Epstein-Barr virus in self-reactive memory B cells

Sean I Tracy et al. J Virol. 2012 Nov.

Abstract

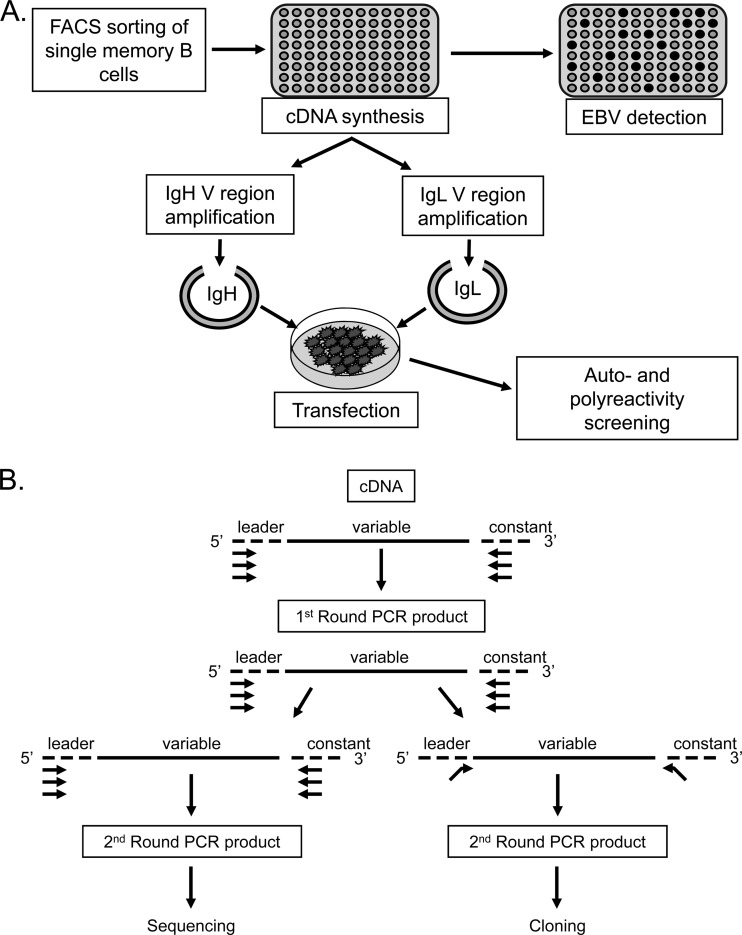
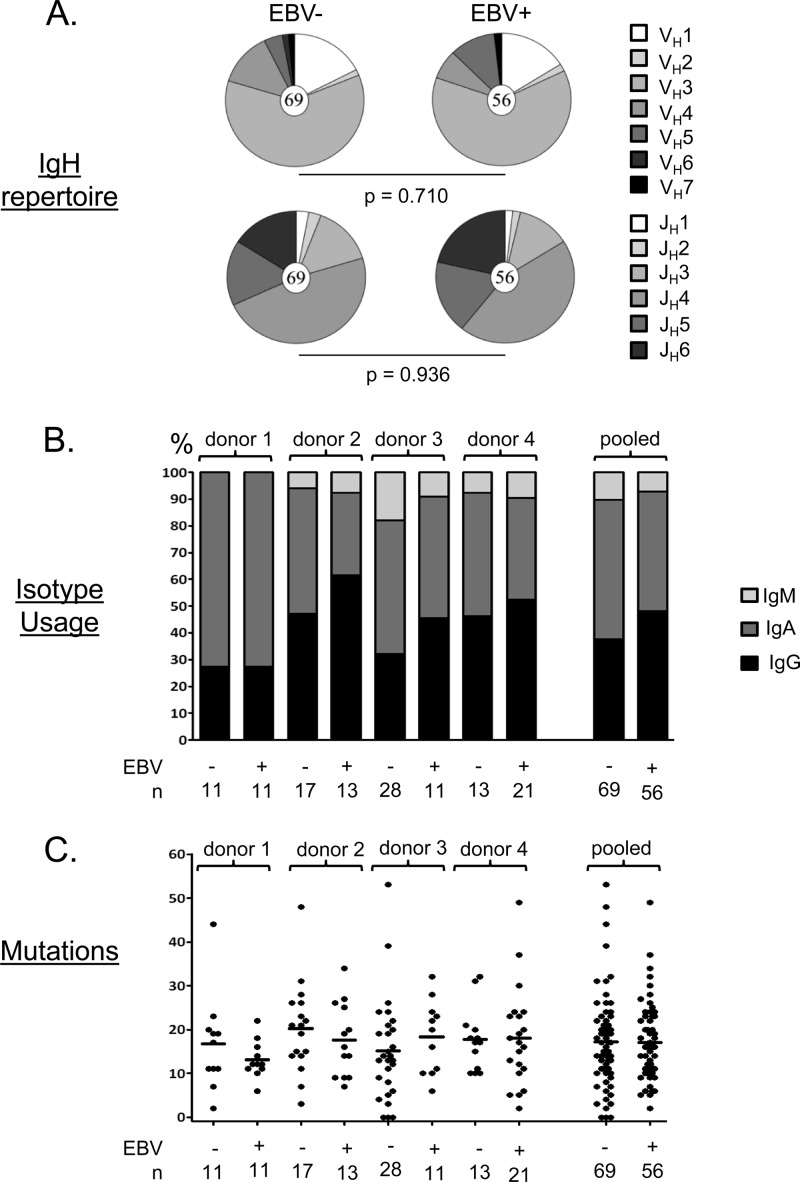
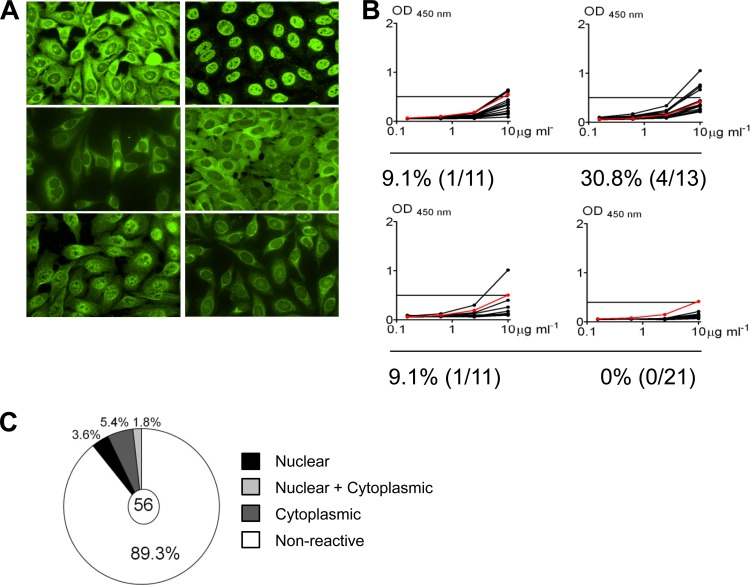
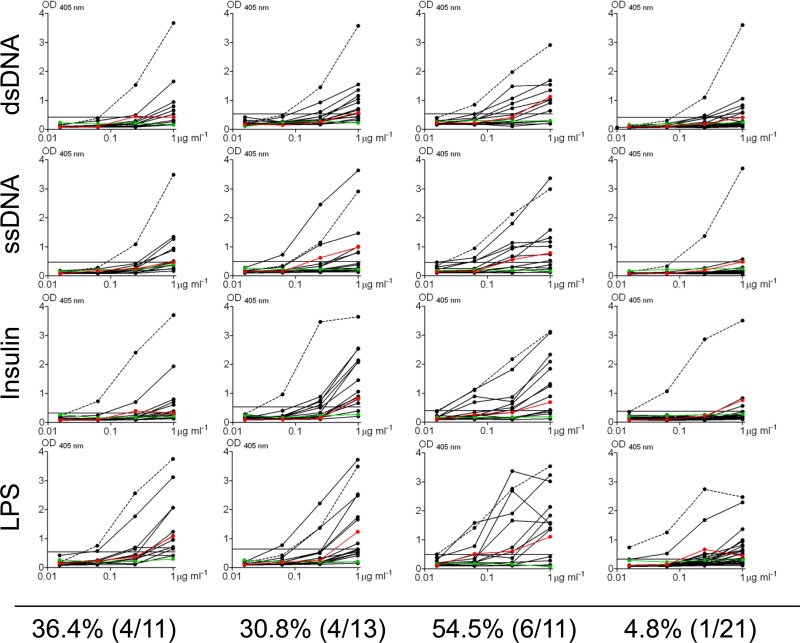
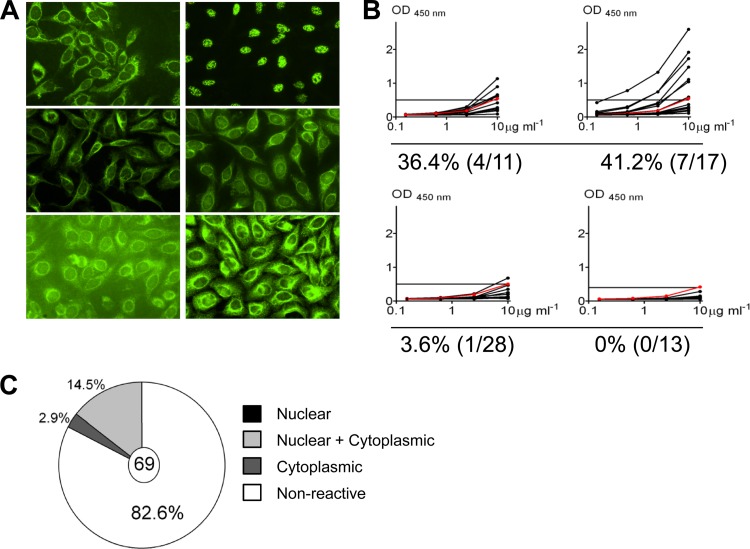
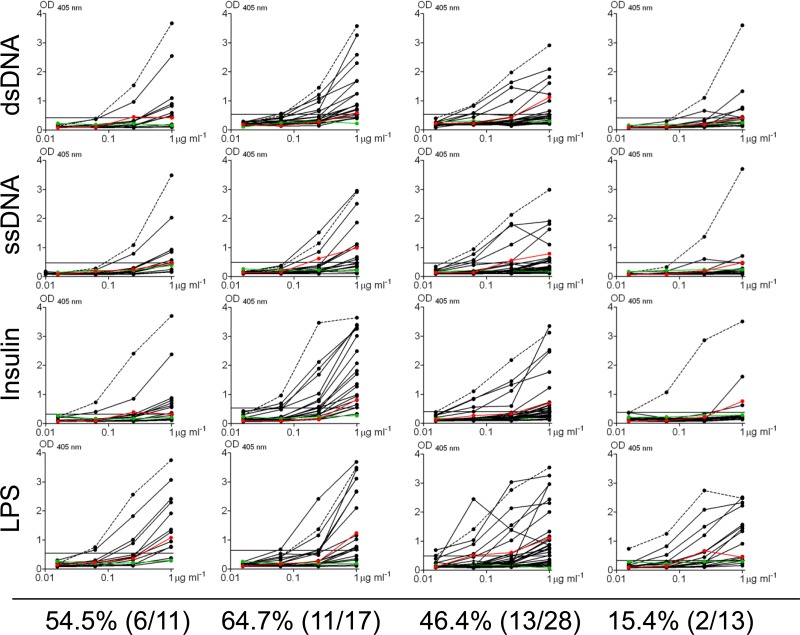
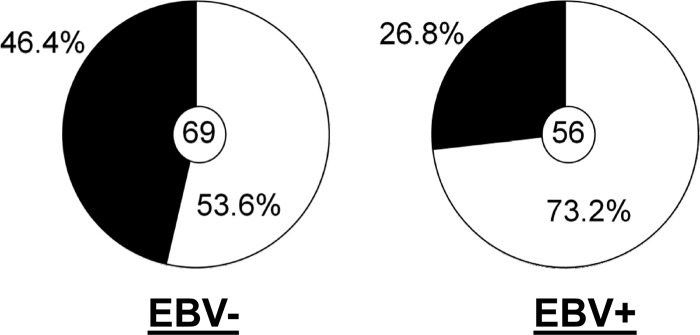
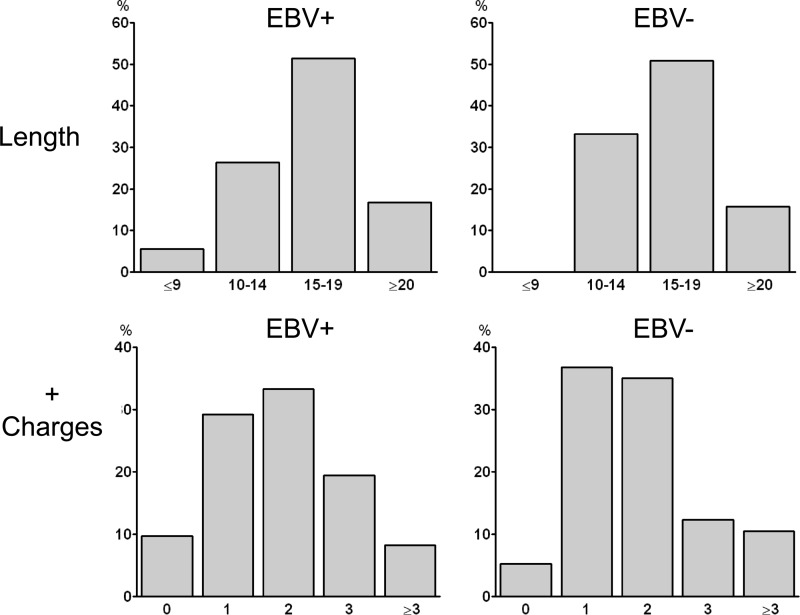
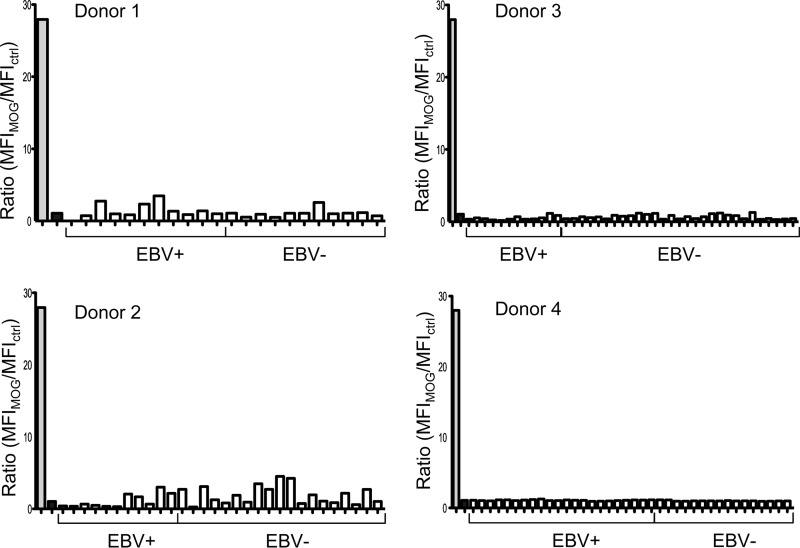
Epstein-Barr virus infection has been epidemiologically associated with the development of multiple autoimmune diseases, particularly systemic lupus erythematosus and multiple sclerosis. Currently, there is no known mechanism that can account for these associations. The germinal-center (GC) model of EBV infection and persistence proposes that EBV gains access to the memory B cell compartment via GC reactions by driving infected cells to differentiate using the virus-encoded LMP1 and LMP2a proteins, which act as functional homologues of CD40 and the B cell receptor, respectively. The ability of LMP2a, when expressed in mice, to allow escape of autoreactive B cells suggests that it could perform a similar role in infected GC B cells, permitting the survival of potentially pathogenic autoreactive B cells. To test this hypothesis, we cloned and expressed antibodies from EBV(+) and EBV(-) memory B cells present during acute infection and profiled their self- and polyreactivity. We find that EBV does persist within self- and polyreactive B cells but find no evidence that it favors the survival of pathogenic autoreactive B cells. On the contrary, EBV(+) memory B cells express lower levels of self-reactive and especially polyreactive antibodies than their uninfected counterparts do. Our work suggests that EBV has only a modest effect on the GC process, which allows it to access and persist within a subtly unique niche of the memory compartment characterized by relatively low levels of self- and polyreactivity. We suggest that this might reflect an active process where EBV and its human host have coevolved so as to minimize the virus's potential to contribute to autoimmune disease.


Figures

Fig 1
Fig 1
Schematic representation of the cloning and expression methods used in this study. (A) Single CD19+ IgD memory cells were sorted into 96-well plates, and cDNA was prepared. A fraction of this cDNA was then used to distinguish EBV+ from EBV cells on the basis of the detection of the abundant EBV small RNA EBER1. The remaining cDNA was used for PCR amplification of Ig heavy- and light-chain variable regions (see below), which were cloned into expression vectors and transfected into 293T cells essentially as described by Tiller et al. (33). The resulting secreted antibodies were then purified and used for self- and polyreactivity assays. (B) PCR amplification of heavy- and light-chain variable regions (adapted from references and 39). The first round of PCR used multiplex primers. A second round of amplification was performed in order to acquire sufficient PCR product for sequencing and identification of the individual V(D)J genes composing the VH and VL regions of a given cell. This round used separate reactions to amplify VH and VL PCR products. Sequences were aligned with the closest germ line sequences using the IMGT/V-QUEST database (http://www.imgt.org/IMGT_vquest/share/textes/). In parallel, PCR was also performed using the first-round products as a template and primers with restriction sites to allow subsequent cloning into expression vectors according to the protocol of Tiller et al. (33).
Fig 2
Fig 2
Summary of the properties of the cloned antibodies. (A) Each pie chart shows the distribution of VH and JH gene usage for all the cloned antibodies tested. The total number of sequences analyzed is shown in the center circle. No significant differences were seen, although the frequency of JH6 was consistently higher in the EBV+ population. (B) Isotype usage for all of the cloned antibodies tested by donor. Note that the population studied is CD19+ IgD memory B cells and therefore excludes IgM+ IgD+ memory cells, which we have shown previously to lack EBV (15). (C) Absolute numbers of somatic mutations in individual IgH genes from all four donors. Each dot represents an independent antibody. Horizontal lines indicate averages. Note that unlike our previous cohort (28), we did not see a significant difference in the number of mutations between antibodies derived from EBV+ and EBV memory cells in this smaller cohort.
Fig 3
Fig 3
Self-reactivity of antibodies derived from EBV+ memory B cells. (A) Representative IFA staining patterns on HEp-2 cells. (B) ELISA for binding to HEp-2 cell lysates. Each black line represents an independent antibody. Horizontal lines indicate cutoff (optical density [OD] at 450 nm) for positive reactivity determined by comparison with low-polyreactivity positive-control antibody eiJB40 (red line). (C) Pie chart showing the fraction of antibodies positive by both IFA and ELISA and the breakdown of their staining patterns.
Fig 4
Fig 4
Polyreactivity profiles of antibodies derived from EBV+ memory B cells. Antibodies were tested for polyreactivity by ELISA with dsDNA, ssDNA, insulin, and LPS. Each black line represents an independent antibody. Controls for polyreactivity included the high-polyreactivity antibody ED38 (dotted line), the low-polyreactivity antibody eiJB40 (red line), and negative-control antibody mG053 (green line). Antibodies with absorbances comparable to or higher than that of low-polyreactivity positive-control antibody eiJB40 against more than one antigen were scored as polyreactive. OD, optical density.
Fig 5
Fig 5
Self-reactivity of antibodies derived from EBV memory B cells. (A) Representative IFA staining patterns on HEp-2 cells. (B) ELISA for binding to HEp-2 cell lysates. Each black line represents an independent antibody. Horizontal lines indicate the cutoff (optical density [OD] at 450 nm) for positive reactivity determined by comparison with low-polyreactivity positive-control antibody eiJB40 (red line). (C) Pie chart showing the fraction of antibodies positive by both IFA and ELISA and the breakdown of their staining patterns.
Fig 6
Fig 6
Polyreactivity profiles of antibodies derived from EBV memory B cells. Antibodies were tested for polyreactivity by ELISA with dsDNA, ssDNA, insulin, and LPS. Each black line represents an independent antibody. Controls for polyreactivity included high-polyreactivity positive-control antibody ED38 (dotted line), low-polyreactivity positive-control antibody eiJB40 (red line), and negative-control antibody mG053 (green line). Antibodies with absorbances comparable to or higher than that of low-polyreactivity positive-control antibody eiJB40 against more than one antigen were scored as polyreactive.
Fig 7
Fig 7
Summary of the frequencies of polyreactive antibodies for all EBV+ and EBV memory B cells. The pie charts summarize the frequencies of polyreactivity for all of the antibodies tested from Fig. 4 and 6 (P = 0.027). The value in each center circle is the total number of independent antibodies analyzed.
Fig 8
Fig 8
Analysis of CDR3 regions for evidence of self-reactivity. (Top) Comparison of CDR3 lengths. The averages were 16.0 for the EBV+ population and 16.4 for the EBV population (P = 0.54). (Bottom) Measurement of the number of positively charged amino acids in the CDR3s. The distributions were not significantly different (P = 0.63).
Fig 9
Fig 9
Reactivity of antibodies derived from donor-matched EBV+ and EBV memory B cells to MOG. Reactivity was assessed with a flow cytometry-based assay using an oligodendrocyte cell line expressing MOG. Positive (anti-MOG antibody)- and negative (irrelevant antibody)-control (ctrl) antibody binding is shown by the gray and black bars, respectively. Reactivity is expressed as the ratio of the MFI of staining on MOG+ cells to the MFI of staining on MOG cells.

References

    1. Alotaibi S, Kennedy J, Tellier R, Stephens D, Banwell B. 2004. Epstein-Barr virus in pediatric multiple sclerosis. JAMA 291:1875–1879 - PubMed
    1. Ascherio A, Munger KL. 2010. 99th Dahlem conference on infection, inflammation and chronic inflammatory disorders: Epstein-Barr virus and multiple sclerosis: epidemiological evidence. Clin. Exp. Immunol. 160:120–124 - PMC - PubMed
    1. Ascherio A, Munger KL. 2007. Environmental risk factors for multiple sclerosis. Part I: the role of infection. Ann. Neurol. 61:288–299 - PubMed
    1. Babcock GJ, Hochberg D, Thorley-Lawson AD. 2000. The expression pattern of Epstein-Barr virus latent genes in vivo is dependent upon the differentiation stage of the infected B cell. Immunity 13:497–506 - PubMed
    1. Caldwell RG, Wilson JB, Anderson SJ, Longnecker R. 1998. Epstein-Barr virus LMP2A drives B cell development and survival in the absence of normal B cell receptor signals. Immunity 9:405–411 - PubMed

Publication types

Substances