. 2012 Dec;8(12):1757-68.
doi: 10.4161/auto.21994. Epub 2012 Sep 5.

Autophagy plays a protective role in endoplasmic reticulum stress-mediated pancreatic β cell death

Affiliations

Autophagy plays a protective role in endoplasmic reticulum stress-mediated pancreatic β cell death

Alberto Bartolome et al. Autophagy. 2012 Dec.

Abstract

There is a growing evidence of the role of autophagy in pancreatic β cell homeostasis. During development of type 2 diabetes, β cells are required to supply the increased demand of insulin. In such a stage, β cells have to address high ER stress conditions that could lead to abnormal insulin secretion, and ultimately, β cell death and overt diabetes. In this study, we used insulin secretion-deficient β cells derived from fetal mice. These cells present an increased accumulation of polyubiquitinated protein aggregates and LC3B-positive puncta, when compared with insulinoma-derived β cell lines. We found that insulin secretion deficiency renders these cells hypersensitive to endoplasmic reticulum (ER) stress-mediated cell death. Chemical or shRNA-mediated inhibition of autophagy increased β cell death under ER stress. On the other hand, rapamycin treatment increased both autophagy and cell survival under ER stress. Insulin secretion-deficient β cells showed a marked reduction of the antiapoptotic protein BCL2, together with increased BAX expression and ERN1 hyperactivation upon ER stress induction. These results showed how insulin secretion deficiency in β cells may be contributing to ER stress-mediated cell death, and in this regard, we showed how the autophagic response plays a prosurvival role.


Figures

None
Figure 1. Autophagy on insulin secretion-deficient β cells. (A) Fetal β cells, INS-1E and MIN6 cells were assayed in the presence or absence of chloroquine (CQ, 10 μM, 24 h) for basal conversion of LC3B-I to -II by immunoblot. (B) Immunofluorescence images of cells treated or untreated with rapamycin (Rapa, 40 nM, 24 h). Puncta is representative of LC3B presence in autophagosomal structures. Nuclei were visualized by DAPI staining and UV fluorescence. (C) Electron micrographs of fetal β cells (1–5), and MIN6 (6). Sections from (1) were amplified in (2 and 3), and amplified section from (4) is shown in (5). Bars represent 500 nm. MIN6 autophagic vacuoles are highlighted with blue arrowheads. AV, autophagic vacuole; nu, nucleus; m, mitochondria; MV, multivacuolar body. (D) Bars represent the proportion of cells showing puncta under basal conditions from the experiment shown in (B), expressed as mean ± s.d. (n = 3), *p < 0.001 compared with each other cell line. (E) Quantification of cytoplasmic volume occupied by autophagosomes (left graph), and mean diameter of autophagosomes (right graph), *p < 0.001.
None
Figure 2. Protein aggregates in insulin secretion-deficient β cells. (A) Immunofluorescence images of fetal β cells, INS-1E and MIN6 cells with, ubiquitin-conjugated protein aggregates were visualized using FK2 mAb. (B) Immunofluorescence images of fetal β cells, under rapamycin treatment (40 nM, 24 h) alone or in combination with chloroquine (10 μM, 24 h). Images show signal from FK2 mAb (red puncta), LC3B (green puncta), and nuclei (blue). (C) Soluble or insoluble protein fractions were subjected to 12% SDS-PAGE, and analyzed with FK2 mAb. (D) Electron micrographs from fetal β cells, amplified region from (1) is shown in (2). Bars represent 500 nm. Protein aggregates are marked with (*), arrows indicate dilated ER. AV, autophagic vacuole; nu, nucleus; m, mitochondria; MV, multivacuolar body.
None
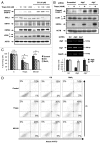
Figure 3. Differential UPR response and sensitivity to ER stress mediated cell death. (A) Representative immunoblots of fetal β cells and INS-1E stimulated with thapsigargin (10 nM) for the indicated times (upper part of the panel). Below, agarose gel images showing Xbp1 cDNA (cDNA) amplified by RT-PCR. Unspliced (171 bp) or spliced (145 bp) forms of Xbp1 are shown. (B) Cell survival assay by violet crystal staining, after 15 h of treatment with the designed doses of thapsigargin or MG132. Percentage of surviving fetal β cells (black line) and INS-1E (gray dashed line) is shown, expressed as mean ± s.d., *p < 0.05, **p < 0.01 (C) Fetal β cells or INS-1E were left untreated (control panels), or treated for 24 h with 10 nM thapsigargin (Thaps), or 100 nM MG132 and FITC-annexin V/propidium iodide (PI) staining were analyzed by flow cytometry. Dot-plots from a representative experiment are shown. (D) Fetal β cells from the experiment shown in (C) were fixed and DNA content was measured by PI staining and flow cytometry. Percentages of hypodiploid cells from representative histograms are shown.
None
Figure 4. Role of BCL2 family proteins in ER stress-mediated autophagy. (A) Cells were submitted to thapsigargin 100 nM for 15 h or 24 h, representative immunoblots are shown. Below, densitometric analysis of Bcl-2 from immunoblots, differences between fetal β cells and INS-1E were significative on all time points, p < 0.01. (B) Protein extracts from control cells or submitted to thapsigargin 100 nM treatment were subjected to immunoprecipitation with anti-BECN1 antibody and western blot. (C) Cytosolic extracts or endoplasmic reticulum (ER)-enriched fraction were subjected to western blot. CANX represents calnexin used as ER fraction marker.
None
Figure 5. Rapamycin treatment protected from ER stress-induced cell death in fetal β cells. (A) Cells were left untreated or treated with rapamycin 40 nM for 24 h. Thapsigargin 10 nM treatment was undertaken during the last 15 h of the experiment. Representative immunoblots are shown (B) From the same experiment, densitometric quantification of LC3B-II, BCL2, BCL2L2 and cleaved caspase-3 blots are shown. Significant differences were found between thapsigargin and thapsigargin plus rapamycin treatments, *p < 0.05; **p < 0.01. (C) Images from fetal β cells after thapsigargin treatment in the presence or absence of rapamycin (D) FITC-annexin V/PI staining from the described experiment was analyzed by flow cytometry. Dot-plots from a representative experiment are shown.
None
Figure 6. MTORC1 upregulation increased ER stress-mediated cell death on fetal β cells. (A) Fetal β cells were transiently transfected with a vector encoding FLAG-tagged wild-type Rheb (Rheb-WT), or constitutive active Rheb (Rheb-Q64L), and subjected or not to 10 nM thapsigargin treatment during 15 h. (B) Twenty-four hours after infection with scrambled or Tsc2 shRNA-encoding lentivirus, cells were left untreated or treated for 15 h with 10 nM thapsigargin. Representative immunoblots are shown.
None
Figure 7. Autophagy inhibition increased ER stress-mediated fetal β cell death. (A) Fetal β cells were treated with different concentrations of thapsigargin for 15 h, in the presence or absence of 10 μM chloroquine. Representative immunoblots from the experiment are shown. (B) Twenty-four hours after infection with scrambled, Atg5 or Atg7 shRNA-encoding lentivirus, cells were left untreated or treated for 15 h with 10 nM thapsigargin. Protein and RNA were collected for western blot (upper panels) and RT-PCR (lower panels), respectively. Below is shown the densitometric quantification of Atg5 or Atg7 mRNA levels. (C) Cells were left untreated (control), or treated for 24 h with autophagy inhibitors (10 μM chloroquine, CQ; 2 nM bafilomycin A1, BafA1) in the presence or absence of 10 nM thapsigargin (Thaps), or 100 nM MG132 during the last 15 h of the experiment. Bars represent surviving cells from cell survival assay by violet crystal staining, expressed as mean ± s.d., *p < 0.05. (D) From the experiment described in (C), FITC-annexin V/PI staining was analyzed by flow cytometry. Dot-plots from a representative experiment are shown.

References

    1. Fonseca SG, Burcin M, Gromada J, Urano F. Endoplasmic reticulum stress in beta-cells and development of diabetes. Curr Opin Pharmacol. 2009;9:763–70. doi: 10.1016/j.coph.2009.07.003. - DOI - PMC - PubMed
    1. Kahn SE. Clinical review 135: The importance of beta-cell failure in the development and progression of type 2 diabetes. J Clin Endocrinol Metab. 2001;86:4047–58. doi: 10.1210/jc.86.9.4047. - DOI - PubMed
    1. Ozcan U, Cao Q, Yilmaz E, Lee A-H, Iwakoshi NN, Ozdelen E, et al. Endoplasmic reticulum stress links obesity, insulin action, and type 2 diabetes. Science. 2004;306:457–61. doi: 10.1126/science.1103160. - DOI - PubMed
    1. Kahn SE, Halban PA. Release of incompletely processed proinsulin is the cause of the disproportionate proinsulinemia of NIDDM. Diabetes. 1997;46:1725–32. doi: 10.2337/diabetes.46.11.1725. - DOI - PubMed
    1. Lang DA, Matthews DR, Burnett M, Turner RC. Brief, irregular oscillations of basal plasma insulin and glucose concentrations in diabetic man. Diabetes. 1981;30:435–9. doi: 10.2337/diabetes.30.5.435. - DOI - PubMed

Publication types

MeSH terms