. 2012 Sep 6;3(9):e384.
doi: 10.1038/cddis.2012.124.

Spontaneous formation of IpaB ion channels in host cell membranes reveals how Shigella induces pyroptosis in macrophages

Affiliations

Spontaneous formation of IpaB ion channels in host cell membranes reveals how Shigella induces pyroptosis in macrophages

L Senerovic et al. Cell Death Dis. .

Abstract

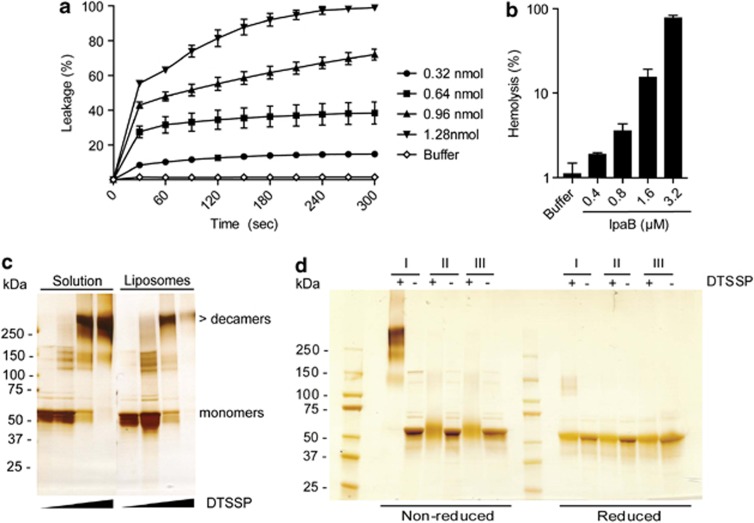
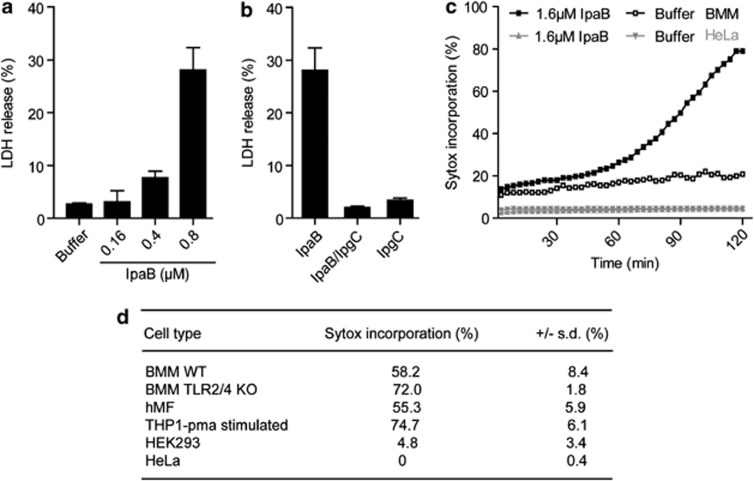
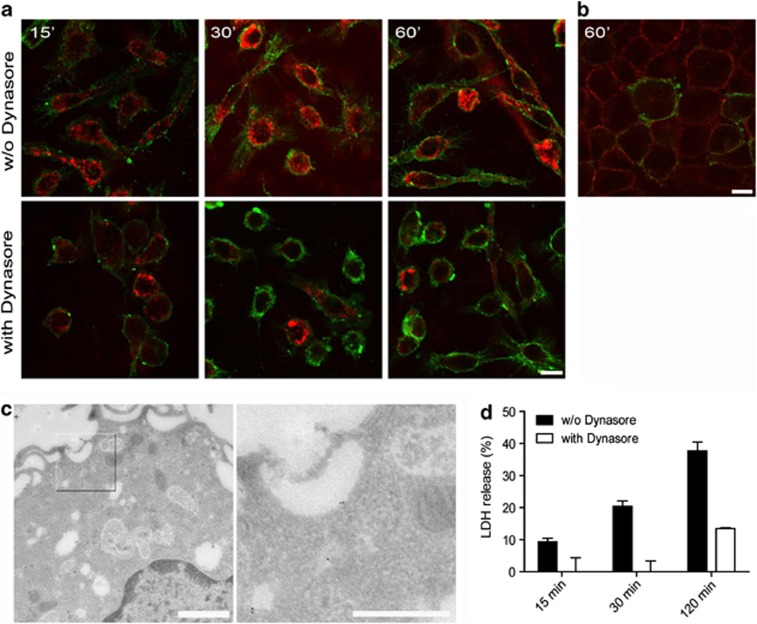
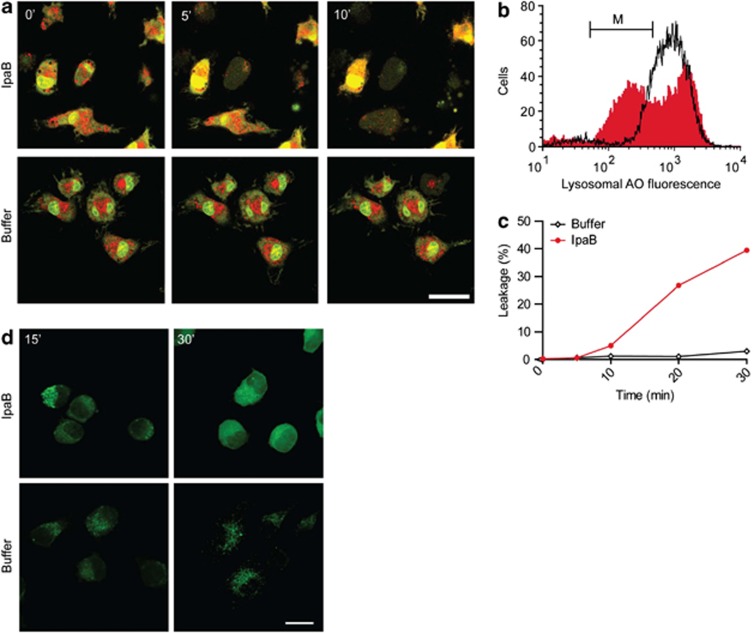
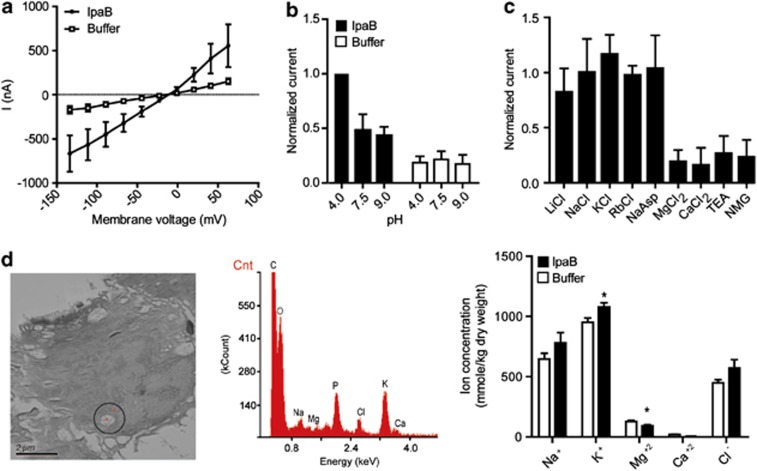
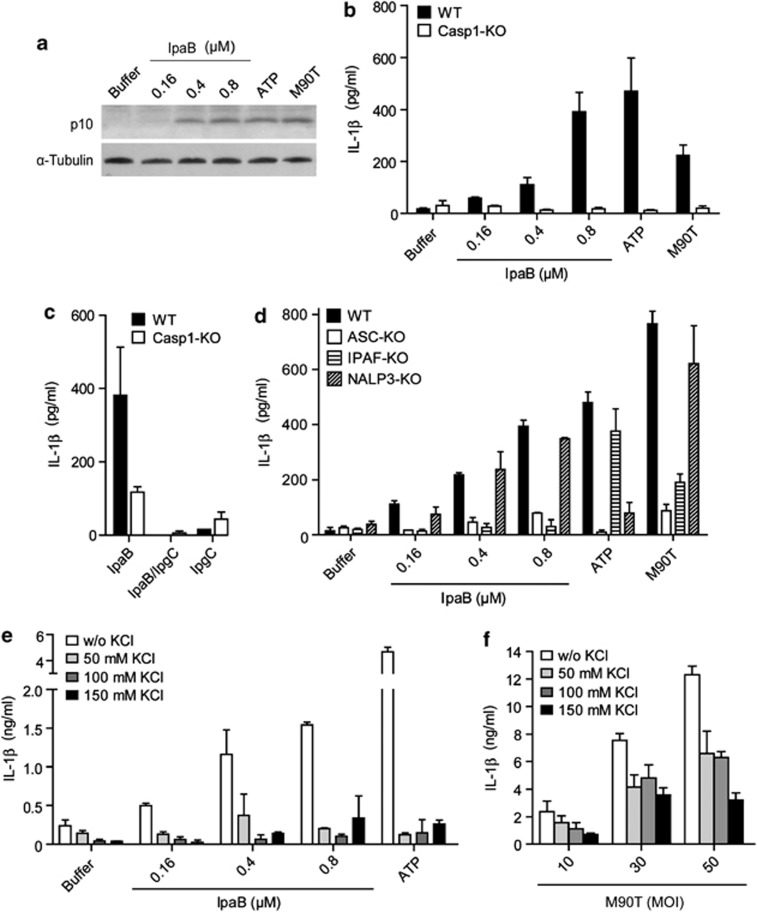
The Gram-negative bacterium Shigella flexneri invades the colonic epithelium and causes bacillary dysentery. S. flexneri requires the virulence factor invasion plasmid antigen B (IpaB) to invade host cells, escape from the phagosome and induce macrophage cell death. The mechanism by which IpaB functions remains unclear. Here, we show that purified IpaB spontaneously oligomerizes and inserts into the plasma membrane of target cells forming cation selective ion channels. After internalization, IpaB channels permit potassium influx within endolysosomal compartments inducing vacuolar destabilization. Endolysosomal leakage is followed by an ICE protease-activating factor-dependent activation of Caspase-1 in macrophages and cell death. Our results provide a mechanism for how the effector protein IpaB with its ion channel activity causes phagosomal destabilization and induces macrophage death. These data may explain how S. flexneri uses secreted IpaB to escape phagosome and kill the host cells during infection and, may be extended to homologs from other medically important enteropathogenic bacteria.


Figures

Figure 1
Figure 1
IpaB oligomers spontaneously integrate into eukaryotic membranes. (a) LUVs were pre-loaded with calcein and incubated with IpaB at indicated concentrations. Release of calcein was monitored for 5 min at 518 nm and plotted in percentage of Triton X-100 lysed liposomes. (b) One percent sheep RBCs were incubated with IpaB and hemolysis was followed by the increase of hemoglobin absorbance at 541 nm and quantified as percentage of Triton X-100 treated/ total lysed cells. In (a) and (b) values are the average of triplicates±S.D. (c) Oligomers of soluble and liposome-bound IpaB were detected by crosslinking for 1 h with 0, 0.01, 0.1 or 1 mM DTSSP and resolved under non-reducing conditions by SDS-PAGE gradient (4–15%) and silver-stained. (d) IpaB was incubated for 1 h with crosslinker DTSSP (1 mM), resolved under reducing or non-reducing conditions by SDS-PAGE gradient (4–15%) and visualized by silver stain. IpaB oligomerization was compared in the presence of: lane I, 0.0005% LDAO, lane II, LDAO concentration reduced to 0.0005% and then brought back to 0.05% and lane III, 0.05% LDAO. Results are representative of at least three independent experiments. See also Supplementary Figure 1
Figure 2
Figure 2
IpaB kills phagocytes but not epithelial cells. (a and b) Cytotoxicity of IpaB was quantified by measuring LDH release from macrophages after 2 h of treatment. Cells treated with indicated IpaB concentrations (a) or 0.8 μM IpaB, IpaB/IpgC or IpgC (b). (c) Kinetics of IpaB cytotoxicity in BMMs and HeLa cells detected by recording fluorescence of DNA-incorporated Sytox Green (Invitrogen, Darmstadt, Germany) dye at 518 nm for 2 h. (d) Cytotoxicity of IpaB expressed as % of totally lysed cells with Triton X-100. Cell death was detected as described in (c) and the values present cytotoxicity after 2 h of treatment with IpaB. Values are the average of triplicates±S.D. Results are representative of at least two independent experiments. See also Supplementary Figure 2
Figure 3
Figure 3
IpaB uptake is essential for its cytotoxic function. (a) Immunofluorescence microscopy of IpaB (0.8 μM) treated BMMs at indicated time points. IpaB was labeled using monoclonal antibody (H16) (red) and membrane is labeled using Cholera toxin subunit-B coupled to Alexa Fluor 488 (green). Upper row shows cells treated with IpaB and the lower row presents cells pre-incubated for 1 h with 80 μM Dynasore and then treated with IpaB for indicated time intervals. Scale bar, 10 μm. (b) Immunofluorescence microscopy of HeLa cells after 1 h incubation with IpaB (0.8 μM). IpaB is shown in red and plasma membrane in green. Labeling was performed as in (a). Scale bar, 10 μm. (c) Cryo-Immunogold Electron Microscopy of BMM after 10 min of treatment. IpaB specifically labeled with monoclonal antibody (H16) and a gold-conjugated secondary antibody showed endosomal localization. Scale bar, 1 μm in the overview and 500 nm in the detailed insert. (d) LDH release from macrophages treated with 0.8 μM IpaB without or with pre-incubation with 80 μM Dynasore. Values are the average of triplicates±S.D. Results are representative of at least two independent experiments. See also Supplementary Figure 3
Figure 4
Figure 4
IpaB induces lysosomal rupture. (a) Confocal Microscopy of BMMs labeled with AO (1 μg/ml) (excitation at 488 nm; emission at 650–690 nm) and incubated with 0.8 μM IpaB (upper row) or buffer (lower row). Images are taken at indicated time points from live cell imaging included in Supplementary Information (see Movie S1 and S2). AO accumulated in lysosomes is labeled red and bound to DNA or RNA in the cytosol is labeled green. Scale bar, 10 μm. (b) Flow cytometry of BMM stained with AO (1 μg/ml) and then treated for 5, 10, 20 and 30 min with IpaB (0.8 μM) or left untreated (buffer). AO was detected in the FL3 channel (X-axis). Histograms in red show fluorescence of cells treated with IpaB; histogram in black for untreated cells. Endolysosomal leakage was monitored by the reduction in the fluorescence of cells gated in M. The Y-axis presents the cells counts. (c) Quantification of cells gated in M incubated with IpaB or left untreated during 30 min as described in (b). Gated BMMs showed the endolysosomal leakage. (d) Confocal microscopy of BMMs loaded with Dextran-Alexa Fluor 488 (0.1 mg/ml) for 15 min (green) and subsequently treated with 0.8 μM IpaB or buffer for indicated times. Scale bar, 10 μm. See also Supplementary Movies 1 and 2
Figure 5
Figure 5
Characterization of the IpaB ion channels. (a) Two-electrode voltage-clamp recording presented as current-voltage relationship of X. laevis oocytes incubated with 1.6 μM IpaB for 4 h. Cells incubated with buffer containing LDAO were used as control. (b) pH dependence of IpaB-mediated ion conductance measured at −100 mV. Background control as in (a). (c) Current amplitudes in oocytes treated with IpaB recorded at −100 mV in the presence of different ions. Current values were normalized comparing with the value obtained for NaCl. The values shown are an average of 4–6 recorded cells±S.D. (d) Determination of ion contents with EPXMA in cryofixed BMMs after 10 min. Treatment with 0.8 μM IpaB or buffer containing LDAO. An example TEM image of a cryosectioned control cell (left panel) is shown together with a typical EPXMA spectrum used for quantification of anorganic ions (middle panel). Single measurements, indicated as red dots, were performed inside electron-light vacuole and the surrounding cytosol. The peak of emission for each anorganic ion is indicated with the element's symbol. Ion concentrations measured in the vacuoles of treated BMMs (right panel). Values are an average of 26–30 measured vacuoles±S.E.M. (asterisks, P<0.05 using Student's t-test). See also Supplementary Figures 4 and 5
Figure 6
Figure 6
Purified IpaB causes Caspase-1 activation and IL-1β release. (a) Immunoblot analysis of the Caspase-1 maturation to the active p10 subunit in 3 h LPS-primed macrophages treated with IpaB at the indicated concentrations for 2 h. Treatment with ATP or Shigella were used as positive controls. Cells incubated with buffer were used as negative control and α-Tubulin is used as loading control. (b, c and d) ELISA of IL-1β secretion by primary macrophages treated as described in (a). Wild-type (WT) and Caspase-1-deficient macrophages treated with IpaB at the indicated concentrations. Controls were used as in the previous panel (b). Macrophages treated with 0.8 μM IpaB were compared with cells treated with the same concentrations of IpaB/IpgC and IpgC (c). IL-1β secretion of IpaB treated WT BMM and Caspase-1 knockout cells (Casp1-KO) is shown in (b) and (c). Treatment of WT macrophages compared with ASC-, IPAF- and NALP3-defficient cells with IpaB at indicated concentrations. ATP or Shigella stimuli were used as positive controls and buffer as negative control (d). ELISA of IL-1β secretion by 3 h LPS-primed macrophages macrophages treated with IpaB for 2 h (e) or infected with S. flexneri for 1 h (f) in the presence of different extracellular KCl concentrations. Treatment with buffer containing LDAO and ATP were used as controls. Values are an average of triplicates±S.D. Results are representative of at least three independent experiments

Similar articles

Cited by

References

    1. Kotloff KL, Winickoff JP, Ivanoff B, Clemens JD, Swerdlow DL, Sansonetti PJ, et al. Global burden of Shigella infections: implications for vaccine development and implementation of control strategies. Bull World Health Organ. 1999;77:651–666. - PMC - PubMed
    1. Maurelli AT, Sansonetti PJ. Genetic determinants of Shigella pathogenicity. Annu Rev Microbiol. 1988;42:127–150. - PubMed
    1. Zychlinsky A, Prevost MC, Sansonetti PJ. Shigella flexneri induces apoptosis in infected macrophages. Nature. 1992;358:167–169. - PubMed
    1. Sansonetti PJ, Phalipon A, Arondel J, Thirumalai K, Banerjee S, Akira S, et al. Caspase-1 activation of IL-1beta and IL-18 are essential for Shigella flexneri-induced inflammation. Immunity. 2000;12:581–590. - PubMed
    1. Watarai M, Tobe T, Yoshikawa M, Sasakawa C. Contact of Shigella with host cells triggers release of Ipa invasins and is an essential function of invasiveness. Embo J. 1995;14:2461–2470. - PMC - PubMed

MeSH terms