. 2012 Oct 26;287(44):36944-67.
doi: 10.1074/jbc.M112.382481. Epub 2012 Sep 5.

Identification and quantification of a new family of peptide endocannabinoids (Pepcans) showing negative allosteric modulation at CB1 receptors

Affiliations

Identification and quantification of a new family of peptide endocannabinoids (Pepcans) showing negative allosteric modulation at CB1 receptors

Mark Bauer et al. J Biol Chem. .

Abstract

The α-hemoglobin-derived dodecapeptide RVD-hemopressin (RVDPVNFKLLSH) has been proposed to be an endogenous agonist for the cannabinoid receptor type 1 (CB(1)). To study this peptide, we have raised mAbs against its C-terminal part. Using an immunoaffinity mass spectrometry approach, a whole family of N-terminally extended peptides in addition to RVD-Hpα were identified in rodent brain extracts and human and mouse plasma. We designated these peptides Pepcan-12 (RVDPVNFKLLSH) to Pepcan-23 (SALSDLHAHKLRVDPVNFKLLSH), referring to peptide length. The most abundant Pepcans found in the brain were tested for CB(1) receptor binding. In the classical radioligand displacement assay, Pepcan-12 was the most efficacious ligand but only partially displaced both [(3)H]CP55,940 and [(3)H]WIN55,212-2. The data were fitted with the allosteric ternary complex model, revealing a cooperativity factor value α < 1, thus indicating a negative allosteric modulation. Dissociation kinetic studies of [(3)H]CP55,940 in the absence and presence of Pepcan-12 confirmed these results by showing increased dissociation rate constants induced by Pepcan-12. A fluorescently labeled Pepcan-12 analog was synthesized to investigate the binding to CB(1) receptors. Competition binding studies revealed K(i) values of several Pepcans in the nanomolar range. Accordingly, using competitive ELISA, we found low nanomolar concentrations of Pepcans in human plasma and ∼100 pmol/g in mouse brain. Surprisingly, Pepcan-12 exhibited potent negative allosteric modulation of the orthosteric agonist-induced cAMP accumulation, [(35)S]GTPγS binding, and CB(1) receptor internalization. Pepcans are the first endogenous allosteric modulators identified for CB(1) receptors. Given their abundance in the brain, Pepcans could play an important physiological role in modulating endocannabinoid signaling.


Figures

FIGURE 1.
FIGURE 1.
A, peptide-specific immune responses to antigen KLH-C-Aca-Aca-RVDPVNFKLLSH (Table 1) of three NZBNZW mice (after the third immunization) determined by ELISA (n = 1). Bottom, results from NH4SCN elution ELISA of the corresponding mouse sera taken 3 weeks after the second and third immunization. The avidity index corresponds to the molar NH4SCN concentration that displaces 50% of binding toward coated ovalbumin-C-Aca-Aca-RVDPVNFKLLSH (Table 1) of sera used at half-maximal titer concentrations of individual animals. The line displays the geometric mean of IC50 values that were determined in triplicate experiments. B–D, minimal epitopes of RVD-Hpα-specific mAbs. Color-coded bead-based peptide arrays were employed to determine the minimal epitopes of the RVD-Hpα specific mAbs. The array was fabricated from a set of N-terminally and C-terminally truncated versions of the RVD-Hpα peptide. Mean fluorescence intensities (MFI) (n = 3) are plotted against the respective peptide sequences in a bar chart. Results for C-terminally truncated peptides are displayed in light gray (left) and for N-terminally truncated peptides in dark gray (right). BSA-coated beads served as control. Representative results for mAb 1A12 (B) and mAb 7A5 (C) are shown. Results for reagent control are shown in D. Results indicate an epitope of mAb 1A12 containing the peptide sequence FKLLSH (B). C, epitope mapping of mAb 7A5 revealed a neoepitope bearing the sequence KLLSH. Minimal epitopes of four mAbs are indicated in Table 2. Error bars, S.D., AU, arbitrary units.
FIGURE 2.
FIGURE 2.
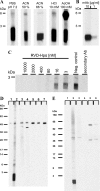
A–C, Western blots of mouse brain extracts with the mAb 1A12. A, Western blots of mouse brain extracts using five different extraction buffers: PBS, pH 7.2, ACN/H2O 1:1 (ACN 50%), ACN/H2O 2:1 (ACN 66%), 10 mm HCl, and 100 mm AcOH. B, mAb 1A12 recognized the synthetic peptide RVD-Hpα (1423.8 Da) at two different antibody concentrations (10 and 1 μg/ml). C, competitive Western blot of the ACN 66% brain extract with the mAb 1A12 using increasing concentrations of the synthetic RVD-Hpα as competitor. 10 μm [Val5]angiotensin I was taken as negative control peptide. For A and C, the mAb 1A12 was incubated at 10 μg/ml. Entire Western blots of the 10 mm HCl and ACN 66% mouse brain extracts using six different anti-RVD-Hpα mAbs (1A10 (lane 1), 1A12 (lane 2), 2C11 (lane 3), 7A5 (lane 4), 2C1 (lane 5), and 8D4 (lane 6)) are shown in D and E, respectively. In both blots, only mAb 1A12 stained a band in the mass range of RVD-Hpα. The 50 kDa band of the HCl extract (D) is stained by the secondary antibody (goat anti-mouse IgG γ-chain, lane 7). In blot E, this band is not visible because ACN efficiently precipitates high molecular weight proteins, such as immunoglobulins. Representative blots of three independent experiments are shown.
FIGURE 3.
FIGURE 3.
Mass spectra of different rodent brain and a mouse plasma sample extract with immunoaffinity enrichment using the mAb 1A12. A–C, results from mouse, hamster, and rat brains extracted with ACN, respectively. D, mass spectrum of mouse plasma extracted with ACN 66%. The identified peptides are displayed in gray. E and F, MS/MS fragmentation spectra of the peaks at m/z 1424.8 (RVDPVNFKLLSH) and m/z 2011.1 (HAHKLRVDPVNFKLLSH). a-, b-, and y-ion series are displayed in the tandem mass spectra.
FIGURE 4.
FIGURE 4.
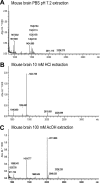
Mass spectra of different mouse brain extracts with immunoaffinity enrichment using mAb 1A12. A–C, spectra from mouse brains extracted with PBS, pH 7.2, 10 mm HCl, and 100 mm AcOH.
FIGURE 5.
FIGURE 5.
A–D, Pepcan-induced [3H]CP55,940 and [3H]WIN55,212-2 displacement from human CB1 receptors. 1 μm Pepcan-12, -14, -15, -17, and -20 was incubated with CHO-hCB1 membranes in the presence of 0.5 nm [3H]CP55,940 (A) or 2.5 nm [3H]WIN55,212-2 (B). Pepcan-12 was the most efficient peptide to displace both radioligands, and therefore its CB1 binding properties were further investigated. Different concentrations of Pepcan-12 (0.1 nm to 1 μm) were incubated with CHO-hCB1 membranes in the presence of 0.5 nm [3H]CP55,940 (C) or 2.5 nm [3H]WIN55,212-2 (D). The Ki values for the positive controls WIN55,212-2 (2.5 ± 1.3 nm) and CP55,940 (2 ± 1.1 nm) were fitted using the three-parameter one-site competitive binding equation for orthosteric ligands. For Pepcan-12, the allosteric TCM equation was used. The obtained pKB and α values are shown in Table 3. The nonspecific binding was detected in the presence of 10 μm WIN55,212-2 or CP55,940 for [3H]CP55,940 or [3H]WIN55,212-2, respectively, and subtracted from all data points. Data show means ± S.E. (error bars), n = 12–15 from 4–5 independent experiments. *, p < 0.05; **, p < 0.01, one-way analysis of variance followed by Dunnett's post hoc test. E, dissociation of 0.5 nm [3H]CP55,940 from human CB1 receptors in presence of 1 μm CP55,940 plus either vehicle or 300 nm Pepcan-12. The data were analyzed by a two-phase exponential decay model and the obtained rate constants, and corresponding half-lives of both phases are listed in Table 4. Results show means ± S.E. (n = 15) from five independent experiments. The corresponding equations for all models mentioned are given under “Experimental procedures.”
FIGURE 6.
FIGURE 6.
Pepcan-F4 receptor binding properties and selectivity studies. A, 100 nm of each of the fluorescein-labeled Pepcan-12 derivatives, Pepcan-F1 to -F4 (Table 1), was incubated with 1 × 10⁵ CHO-hCB1 cells for 60 min at 37 °C and then washed twice with ice-cold binding buffer. Fluorescence intensities were compared with non-transfected CHO cells. Data show means ± S.E. (error bars) (n = 6) from two independent experiments. B, total, nonspecific, and specific saturation binding curves of Pepcan-F4. The Kd value was obtained by nonlinear fit (one-site specific binding model) of the specific binding curve, which was obtained by subtracting the fluorescence intensity measured in untransfected CHO cells (nonspecific binding) of the fluorescent signal measured in CHO-hCB1 cells (total binding). Data show means ± S.E. (n = 6) from three independent experiments. AFU, arbitrary fluorescence units. C, binding interactions of Pepcan-F4 with different human receptor (CB1, CB2, TRPV1 and GPR55)-transfected and untransfected cell lines. A 250 nm concentration of Pepcan-F4 was incubated with 2 × 10⁶ detached cells for 60 min at 37 °C under shaking and washed twice with PBS, 0.5% BSA, 5% FCS prior to measurement by FACS on a FACScan BD equipped with a solid state laser (Cytek). Data were analyzed on the CellQuest software. FACS experiments were carried out as described before (72). The CB receptor-negative HL60 cell line was described previously (72). Data show mean fluorescence values (geo mean) ± S.D. (n = 9) from three independent experiments. D, representative images of three independent experiments of wild-type CHO, CHO-hCB1, and N18TG2 cells with Pepcan-F4 (100 nm for CHO and CHO-hCB1 cells; 1 μm for N18TG2). Cells were incubated for 60 min at 37 °C and washed once with PBS. Images were obtained with a Nikon DSFi1 camera mounted on a Nikon Eclipse TS100 microscope equipped with a Tripleband DAPI/FITC/TRITC HC filter set (AHF, Tübingen, Germany). Bar, 10 μm.
FIGURE 7.
FIGURE 7.
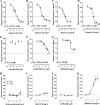
Pepcan-induced Pepcan-F4 displacement from human CB1 receptors. Different concentrations (1 nm to 10 μm) of Pepcan-12 (A), -14 (B), -15 (C), -17 (D), -20 (E), RVDPVNFKLL (F), and RVDPVNF (G) were incubated with 1 × 10⁶ CHO-hCB1 cells in the presence of a 100 nm concentration of the fluorescently labeled Pepcan-F4 for 60 min at 37 °C under shaking. The IC50 values (“absolute” IC50 values representing the concentration of competitor displacing 50% of Pepcan-F4 (33)) of Pepcans were estimated from fitted nonlinear curves and were used to calculate the Ki values by applying the Cheng-Prusoff equation as described under “Experimental Procedures.” Data show means ± S.E. (error bars) (n = 6–9) from 2–3 independent experiments. 1 × 10⁶ CHO-hCB1 cells were incubated with 100 nm Pepcan-F4 in the presence of different concentrations of AEA or 2-AG (H), SR141716 (I), CP55,940 (J), and WIN55,212-2 (K) for 60 min at 37 °C under shaking. 2-AG and AEA weakly increased the Pepcan-F4 fluorescence intensity only at 10 μm, whereas SR141716 and WIN55,212-2 (1 and 10 μm) induced a moderate and high fluorescence increase, respectively (*, p < 0.05, Student's unpaired t test of competitor versus vehicle control). Data show means ± S.E. (n = 6–9) from 2–3 independent experiments.
FIGURE 8.
FIGURE 8.
Structural representations of the α2β2 tetramer Hb (Protein Data Bank entry 2DN2) that display the location of the α-chain-derived Pepcan-12 (RVDPVNFKLLSH) sequence (colored in red) until Pepcan-23 (SALSDLHAHKLRVDPVNFKLLSH) with the sequence SALSDLHAHKL colored in green. A and B, images of Hb with Hb α-chains colored in blue and β-chains in yellow. C and D, surface plots of Hb show the internal location of Pepcan-12 and demonstrate that the N-terminal part of Pepcan-23 reaches the protein surface, possibly exposing it for a proteolytic attack. Images were generated using PyMOL software.
FIGURE 9.
FIGURE 9.
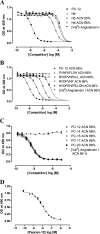
Characterization of the mAb 1A12 in C-ELISA. Selected compounds were analyzed for their potential to displace the binding of the mAb 1A12 toward the coated ovalbumin-Pepcan-12 conjugate (Table 1) in C-ELISA with or without ACN extraction. A, Hb with and without ACN extractions. B, rat hemopressin (PVNFKFLSH), the C-terminal truncated peptides RVDPVNFKLL and RVDPVNF, and the hemoglobin β-chain-derived peptide HVDPENFRLLGN after ACN extraction. C, Pepcan-14, -15, -17, and -20 after ACN extraction. As a reference peptide, Pepcan-12 was used, and the similar sized peptide [Val5]angiotensin I served as negative control. D, representative standard curve of the synthetic Pepcan-12 used for the quantification of Pepcans from mouse brain and human plasma. pIC50 values of compounds with and without ACN extractions were obtained from nonlinear regression (shared bottom values for graphs A and B) and are listed in Table 6. The corresponding graphs for peptide competitors without ACN extraction are not shown because the pIC50 values did not differ substantially from the ones obtained with ACN extraction. Data show means ± S.D. (error bars) (n = 2–3) in A–C and a cumulated standard curve of two independent experiments in duplicates in D.
FIGURE 10.
FIGURE 10.
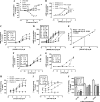
Negative allosteric modulation of cannabinoid signaling at the human CB1 receptor by Pepcan-12. All data were analyzed by using a four-parameter dose-response model with variable slope described under “Experimental Procedures.” A, measurement of cAMP accumulation induced by CP55,940 (pEC50 = 8.55 ± 0.15 nm; Emax = 176.5 ± 8.0), WIN55,212 (see Table 8), 2-AG (see Table 8), SR141716 (pEC50 = 9.48 ± 0.08 nm; Emax = 13.7 ± 2.87), and Pepcan-12 (no significant change of basal cAMP accumulation) at hCB1 receptors. Results show means ± S.E. (error bars) (n = 6–15) from 2–5 independent experiments. B, preincubation for 16 h with 5 ng/ml PTX did not significantly alter the cAMP accumulations induced by WIN55,212-2 and 2-AG. Data show means ± S.D. (n = 4) of two independent experiments. C and D, WIN55,212-2-stimulated cAMP accumulation in the presence of different concentrations of Pepcan-12 (C) and SR141716 (D) (0 nm (vehicle control): pEC50 = 6.88 ± 0.15, Emax = 506.7 ± 36.6; 0.1 nm: pEC50 = 6.87 ± 0.22, Emax = 452.0 ± 66.8; 1 nm: pEC50 = 6.72 ± 0.10, Emax = 477.9 ± 28.1; 10 nm: pEC50 = 6.36 ± 0.09*, Emax = 527.7 ± 35.7; 25 nm: pEC50 = 5.68 ± 0.05***, 50 nm: pEC50 = 5.08 ± 0.09***. Emax values for the nonlinear fits of the 25 and 50 nm curves were constrained to 491.1, representing the average Emax values of the other curves. *, p < 0.05; ***, p < 0.001, one-way analysis of variance followed by Dunnett's post hoc test). Data show means ± S.E. (n = 9) from three independent experiments. Results from D were used to generate a Schild plot (E) (see “Experimental Procedures”) for the analysis of competitive binding of SR141716. Shown is 2-AG-stimulated cAMP accumulation in the presence of different concentrations of Pepcan-12 (F) and SR141716 (G). Data show means ± S.E. (n = 6–9) from 2–3 independent experiments. Shown is HU-210-stimulated [35S]GTPγS binding in the presence of different concentrations of Pepcan-12 (H) and SR141716 (I). Pepcan-12 did not elicit a significant change of basal [35S]GTPγS binding. Results show means ± S.E. (n = 6–30) from 2–10 independent experiments. pEC50 and Emax values of the curves displayed in C and F–I are shown in Table 8. J, partial reduction of the [35S]GTPγS binding by Pepcan-12 measured at three different concentrations of 2-AG. Data show means ± S.E. (n = 9–30) from 3–10 independent experiments. **, p < 0.01; ***, p < 0.001, one-way analysis of variance followed by Dunnett's post hoc test.
FIGURE 11.
FIGURE 11.
A and B, influence of Pepcan-12 to -20 on cAMP accumulation and [35S]GTPγS binding induced by WIN55,212-2, 2-AG, and HU-210. Data show means ± S.E. (n = 9–12) from 3–4 independent experiments (*, p < 0.05; **, p < 0.01; ***, p < 0.001, Student's unpaired t test of Pepcan-treated versus vehicle control-treated cannabinoid receptor agonist groups). C, aggregation measured for Pepcan-12 and Pepcan-20. Results show the peptide recovery of a low (10 nm) and a high (1 μm) concentration of Pepcan-12 and -20 in RPMI1640 medium after incubation and subsequent centrifugation by ultrafiltration and quantification by competitive ELISA. Results were normalized to the 10 nm recovery of the corresponding Pepcan. Two molecular mass cut-off membranes (2000 and 3000) were used to investigate the eventual formation of lower molecular weight aggregates, such as dimers or trimers. Data show means ± S.E. (n = 9) from three independent experiments (*, p < 0.05; **, p < 0.01; ***, p < 0.001, Student's unpaired t test between the indicated groups). D, Pepcans, 2-AG, and WIN55,212-2 induce partial internalization of CB1 receptors in CHO-hCB1 cells. In combination with 2-AG and WIN55,212-2, the induced internalization was partially reversed by Pepcan-12. All compounds were used at 1 μm. Data show means ± S.E. (error bars) (n = 9) from three independent experiments (*, p < 0.05; **, p < 0.01; ***, p < 0.001, Student's unpaired t test of compounds versus vehicle control; #, p < 0.05, t test between the indicated groups).
FIGURE 12.
FIGURE 12.
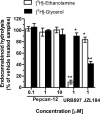
Effect of Pepcan-12 on AEA and 2-AG hydrolysis in pig brain homogenate. The hydrolytic products [3H]ethanolamine from AEA breakdown and [3H]glycerol from 2-AG breakdown were quantified. The positive controls URB597 (fatty acid amide hydrolase inhibitor) and JZL184 (monoacylglycerol lipase inhibitor) showed significant inhibition of AEA and 2-AG breakdown, respectively. Data show means ± S.D. (error bars) (n = 3) (*, p < 0.05; **, p < 0.01, Student's unpaired t test of compounds versus vehicle control).

References

    1. Matsuda L. A., Lolait S. J., Brownstein M. J., Young A. C., Bonner T. I. (1990) Structure of a cannabinoid receptor and functional expression of the cloned cDNA. Nature 346, 561–564 - PubMed
    1. Munro S., Thomas K. L., Abu-Shaar M. (1993) Molecular characterization of a peripheral receptor for cannabinoids. Nature 365, 61–65 - PubMed
    1. Pertwee R. G., Howlett A. C., Abood M. E., Alexander S. P., Di Marzo V., Elphick M. R., Greasley P. J., Hansen H. S., Kunos G., Mackie K., Mechoulam R., Ross R. A. (2010) International Union of Basic and Clinical Pharmacology. LXXIX. Cannabinoid receptors and their ligands. Beyond CB1 and CB2. Pharmacol. Rev. 62, 588–631 - PMC - PubMed
    1. Mackie K. (2006) Cannabinoid receptors as therapeutic targets. Annu. Rev. Pharmacol. Toxicol. 46, 101–122 - PubMed
    1. Hanus L. O. (2009) Pharmacological and therapeutic secrets of plant and brain (endo)cannabinoids. Med. Res. Rev. 29, 213–271 - PubMed

Publication types

MeSH terms

Substances

LinkOut - more resources