. 2012 Oct 19;287(43):36609-16.
doi: 10.1074/jbc.M112.410746. Epub 2012 Sep 5.

Bromodomain and extra-terminal (BET) bromodomain inhibition activate transcription via transient release of positive transcription elongation factor b (P-TEFb) from 7SK small nuclear ribonucleoprotein

Affiliations

Bromodomain and extra-terminal (BET) bromodomain inhibition activate transcription via transient release of positive transcription elongation factor b (P-TEFb) from 7SK small nuclear ribonucleoprotein

Koen Bartholomeeusen et al. J Biol Chem. .

Erratum in

  • J Biol Chem. 2013 Apr 26;288(17):12214

Abstract

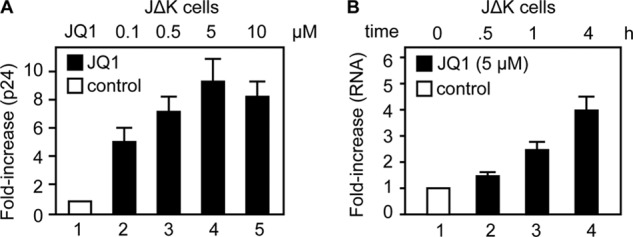
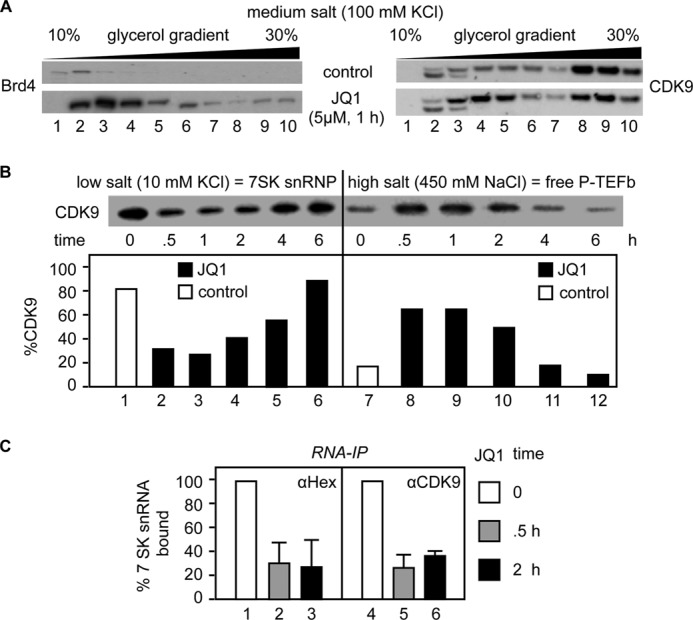
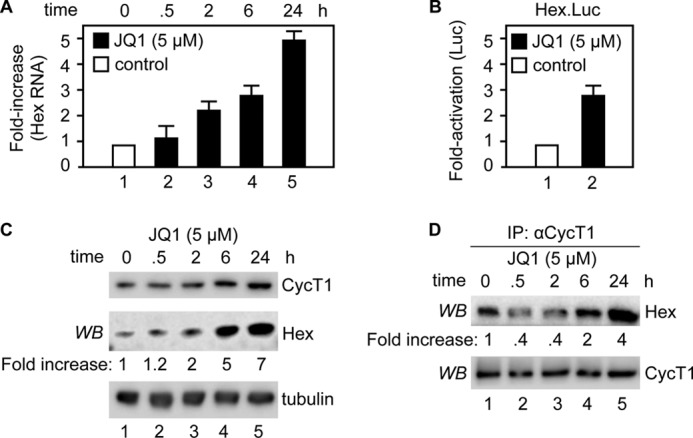
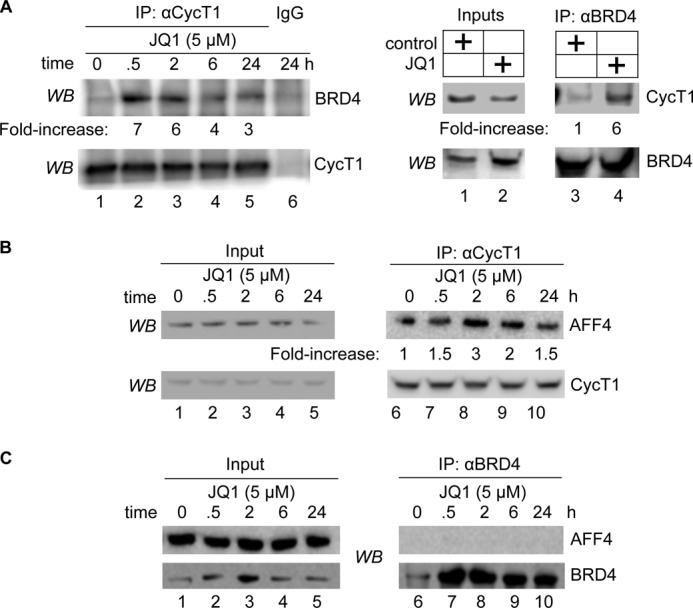
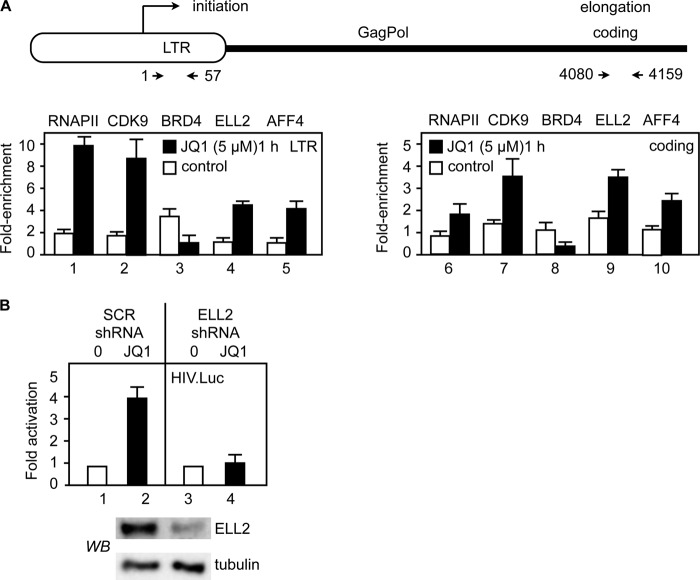
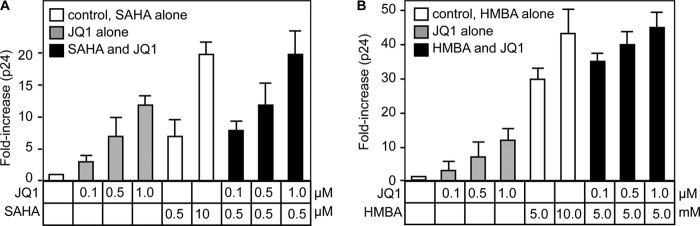
By phosphorylating elongation factors and the C-terminal domain of RNA polymerase II, the positive transcription elongation factor b (P-TEFb) is the critical kinase for transcription elongation and co-transcriptional processing of eukaryotic genes. It exists in inactive small nuclear ribonucleoprotein (7SK snRNP) and active (free P-TEFb) complexes in cells. The P-TEFb equilibrium determines the state of cellular activation, proliferation, and differentiation. Free P-TEFb, which is required for growth, can be recruited to RNA polymerase II via transcription factors, BRD4, or the super elongation complex (SEC). UV light, various signaling cascades, transcriptional blockade, or compounds such as hexamethylene bisacetamide (HMBA), suberoylanilide hydroxamic acid (SAHA), and other histone deacetylase inhibitors lead to a rapid release of free P-TEFb, followed by its reassembly into the 7SK snRNP. As a consequence, transcription of HEXIM1, a critical 7SK snRNP subunit, and HIV is induced. In this study, we found that a bromodomain and extra-terminal (BET) bromodomain inhibitor, JQ1, which inhibits BRD4 by blocking its association with chromatin, also leads to the rapid release of free P-TEFb from the 7SK snRNP. Indeed, JQ1 transiently increased levels of free P-TEFb and BRD4·P-TEFb and SEC·P-TEFb complexes in cells. As a consequence, the levels of HEXIM1 and HIV proteins rose. Importantly, the knockdown of ELL2, a subunit of the SEC, blocked the ability of JQ1 to increase HIV transcription. Finally, the effects of JQ1 and HMBA or SAHA on the P-TEFb equilibrium were cooperative. We conclude that HMBA, SAHA, and JQ1 affect transcription elongation by a similar and convergent mechanism.


Figures

FIGURE 1.
FIGURE 1.
JQ1 activates HIV transcription. A, JΔK cells were treated with increasing concentrations of JQ1 as indicated for 24 h. The production of new viral particles was determined by p24 capsid ELISA and is presented as -fold increase over the DMSO control (bar 1). B, JΔK cells were treated with JQ1 (5 μm) for the indicated times, and HIV-specific mRNA levels were determined by RT-qPCR and normalized to actin mRNA. The results are presented as -fold increase over the DMSO control (bar 1). Error bars represent S.E. of duplicate (A) or triplicate (B) experiments.
FIGURE 2.
FIGURE 2.
JQ1 directs the disruption and reassembly of the 7SK snRNP. A, cell lysates of JΔK cells treated with DMSO (upper panels) or JQ1 (5 μm for 1 h; lower panels) were subjected to 10–30% glycerol gradient sedimentation. BRD4 (left panels) and CDK9 (right panels) in each fraction were detected by Western blotting. B, Jurkat cells were subjected to differential salt extraction after JQ1 treatment (5 μm) for the indicated times. The levels of CDK9 extracted in low-salt (7SK snRNP; lanes 1–6) and high-salt (free P-TEFb; lanes 7–12) buffers were determined by Western blotting (upper panel) and quantified. The results are presented as relative distributions in the 7SK snRNP and free P-TEFb fractions (lower panels). C, the association between 7SK snRNA and HEXIM1 or CDK9 after JQ1 treatment (5 μm) for the indicated times was determined by RNA immunoprecipitations (RNA-IP) with anti-HEXIM1 (αHex; left panel) and anti-CDK9 (right panel) antibodies, followed by RT-qPCR with primers specific to 7SK snRNA. Data are presented relative to the DMSO control (bars 1 and 4). Error bars represent S.E. of triplicate experiments.
FIGURE 3.
FIGURE 3.
JQ1 increases HEXIM1 levels for reassembly of the 7SK snRNP. A, Jurkat cells were treated with JQ1 (5 μm) for the indicated times. HEXIM1 (Hex) mRNA levels were determined by RT-qPCR and normalized to actin mRNA. The results are presented as -fold increase over the DMSO control (bar 1). Error bars represent S.E. of triplicate experiments. B, Jurkat cells were transfected with the HEXIM1 promoter-luciferase reporter gene plasmid (Hex.Luc) for 24 h and treated with DMSO or JQ1 (5 μm) for an additional 24 h prior to luciferase assays. Luciferase activity is presented as -fold activation over the DMSO control (bar 1). The error bar represents S.E. of triplicate experiments. C, the protein levels of HEXIM1, CycT1, and tubulin in Jurkat cells treated with JQ1 (5 μm) for the indicated times were determined by Western blotting (WB). Ratios between HEXIM1 and tubulin were calculated for each time point and are presented as -fold increase over the DMSO control (lane 1). D, Jurkat cells were treated with JQ1 (5 μm) for the indicated times, and cell lysates were subjected to immunoprecipitations (IP) with anti-CycT1 antibody. The levels of HEXIM1 and CycT1 proteins in the immunoprecipitations were determined by Western blotting. Ratios of immunoprecipitated HEXIM1 to CycT1 were calculated and are presented as -fold increase over the DMSO control (lane 1).
FIGURE 4.
FIGURE 4.
JQ1 increases the association between P-TEFb, BRD4, and AFF4 from the SEC. A, Jurkat cells were treated with JQ1 (5 μm) for the indicated times (left panels) or for 30 min (right panels), and cell lysates were subjected to immunoprecipitations (IP) with anti-CycT1 (left panels) and anti-BRD4 (right panels) antibodies. The levels of the indicated proteins in the 5% input (right panels) and immunoprecipitations (left panels) were determined by Western blotting (WB). Ratios between immunoprecipitated BRD4 and CycT1 (left panels, BRD4/CycT1; right panels, CycT1/BRD4) were calculated and are presented as -fold increase over the DMSO control (lanes 1 and 6). B, Jurkat cells were treated with JQ1 (5 μm) for the indicated times, and cell lysates were subjected to immunoprecipitations with anti-CycT1 antibody. The levels of the indicated proteins in the 5% input (lanes 1–5) and immunoprecipitations (lanes 6–10) were determined by Western blotting. Ratios of immunoprecipitated AFF4 to CycT1 were calculated and are presented as -fold increase over the DMSO control (lane 6). C, Jurkat cells were treated with JQ1 (5 μm) for the indicated times, and cell lysates were subjected to immunoprecipitations with anti-BRD4 antibody. The levels of the indicated proteins in the 5% input (lanes 1–5) and immunoprecipitations (lanes 6–10) were determined by Western blotting.
FIGURE 5.
FIGURE 5.
JQ1 increases AFF4 and ELL2 levels at the HIV LTR and coding regions, and inactivation of ELL2 blocks its effects on HIV transcription. A, upper panel, schematic representation of the HIV promoter (LTR) and the Gag-Pol coding regions. Arrows indicate positions of primers for qPCR after ChIP. Lower panels, JΔK cells treated with DMSO (white bars) or JQ1 (5 μm; black bars) for 1 h were subjected to ChIP with the indicated antibodies. The qPCR signals obtained with the LTR primers (bars 1-5) or the coding primers (bars 6–10) were normalized to the input and are presented as -fold enrichment over the signals obtained with the IgG control. Error bars represent S.E. of triplicate experiments. B, upper panel, Jurkat cells were co-transfected with the HIV LTR-luciferase (HIV.Luc) plasmid target and scrambled (SCR; bars 1 and 2) and ELL2 (ELL2, bars 2 and 4) shRNA plasmids for 48 h prior to the addition of DMSO (bars 1 and 3) or JQ1 (5 μm; bars 2 and 4). After an additional 24 h, luciferase activity was determined. Data are presented relative to the DMSO control. ELL2 knockdown was confirmed by Western blotting (WB; middle panel) with tubulin as the loading control (lower panel). Error bars represent S.E. of triplicate experiments.
FIGURE 6.
FIGURE 6.
JQ1, SAHA, and HMBA have similar effects on HIV production. A and B, JΔK cells were treated with the indicated concentrations of JQ1 (gray bars), SAHA (A, white bars), HMBA (B, white bars), or combinations (black bars). After 24 h, the production of HIV was determined by p24 capsid ELISA and is presented as -fold increase over the DMSO control. Error bars represent S.E. of triplicate experiments.

References

    1. Peterlin B. M., Price D. H. (2006) Controlling the elongation phase of transcription with P-TEFb. Mol. Cell 23, 297–305 - PubMed
    1. Saunders A., Core L. J., Lis J. T. (2006) Breaking barriers to transcription elongation. Nat. Rev. Mol. Cell Biol. 7, 557–567 - PubMed
    1. Zhou Q., Li T., Price D. H. (2012) RNA polymerase II elongation control. Annu. Rev. Biochem. 81, 119–143 - PMC - PubMed
    1. Nechaev S., Adelman K. (2011) Pol II waiting in the starting gates: regulating the transition from transcription initiation into productive elongation. Biochim. Biophys. Acta 1809, 34–45 - PMC - PubMed
    1. Li J., Gilmour D. S. (2011) Promoter proximal pausing and the control of gene expression. Curr. Opin. Genet. Dev. 21, 231–235 - PMC - PubMed

Publication types

MeSH terms