

Child mortality estimation: estimating sex differences in childhood mortality since the 1970s
- PMID: 22952433
- PMCID: PMC3429399
- DOI: 10.1371/journal.pmed.1001287
Child mortality estimation: estimating sex differences in childhood mortality since the 1970s
Abstract
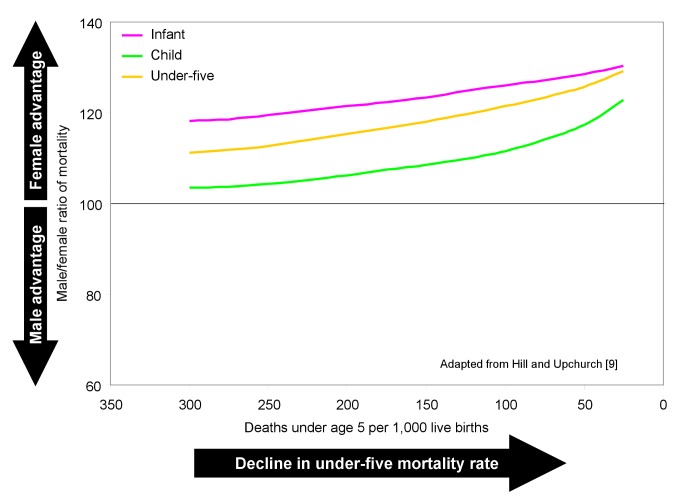
Introduction: Producing estimates of infant (under age 1 y), child (age 1-4 y), and under-five (under age 5 y) mortality rates disaggregated by sex is complicated by problems with data quality and availability. Interpretation of sex differences requires nuanced analysis: girls have a biological advantage against many causes of death that may be eroded if they are disadvantaged in access to resources. Earlier studies found that girls in some regions were not experiencing the survival advantage expected at given levels of mortality. In this paper I generate new estimates of sex differences for the 1970s to the 2000s.
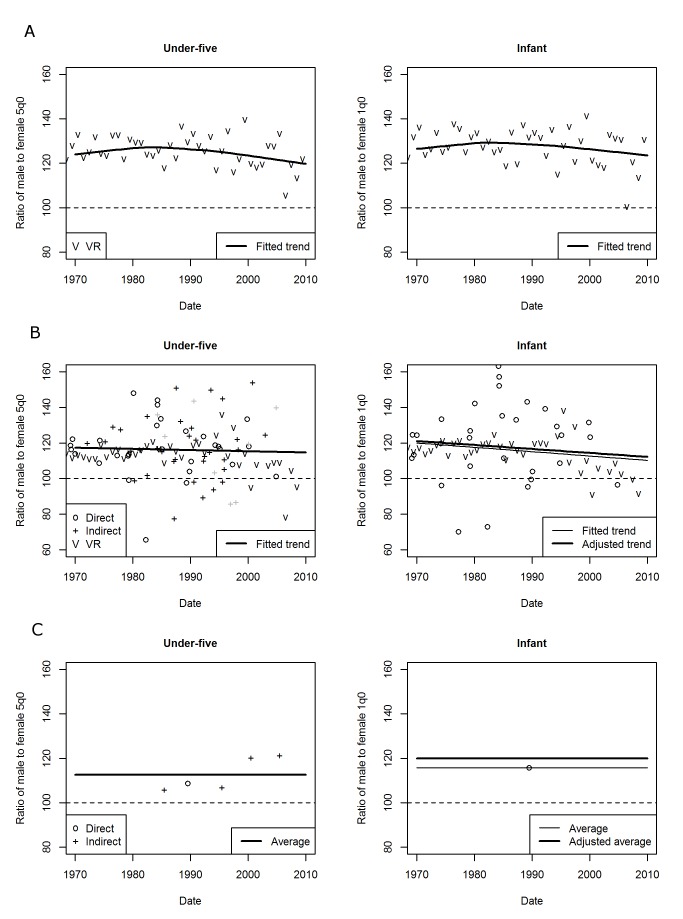
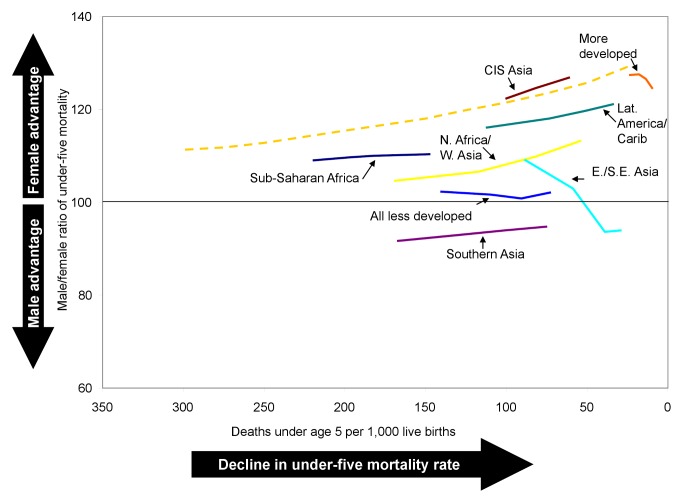
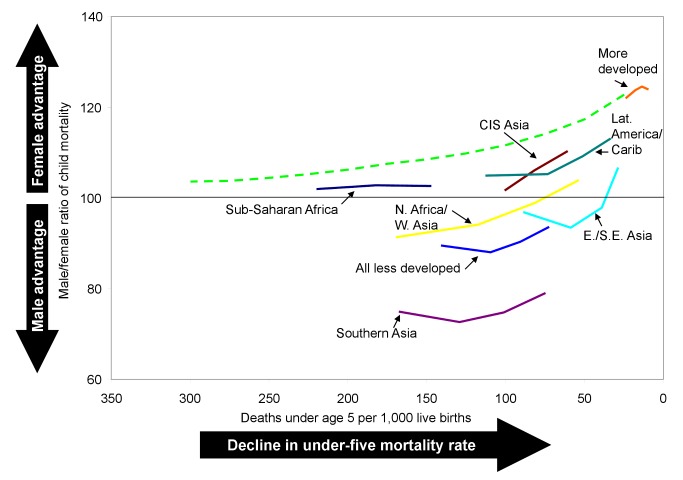
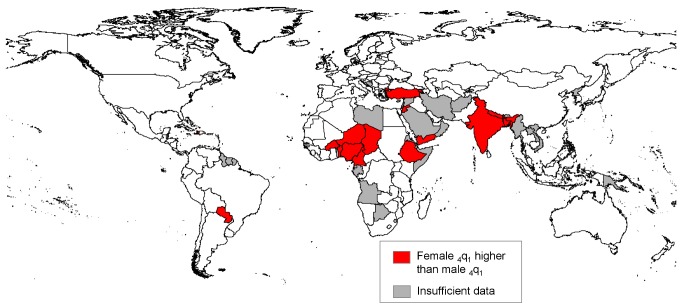
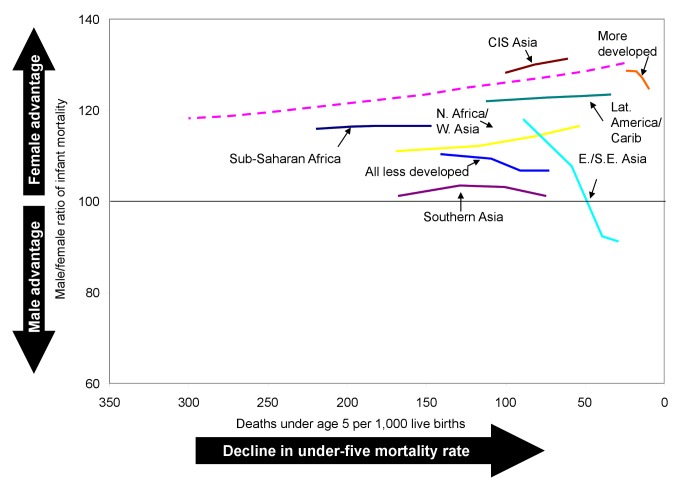
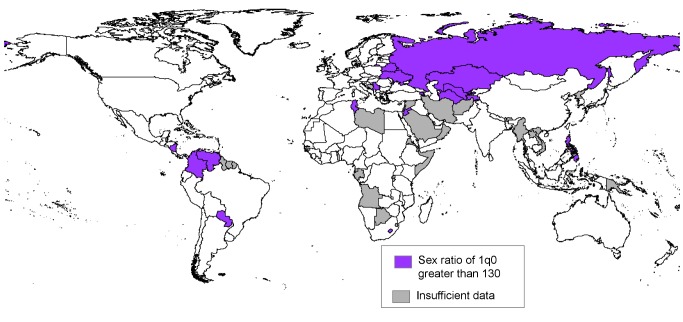
Methods and findings: Simple fitting methods were applied to male-to-female ratios of infant and under-five mortality rates from vital registration, surveys, and censuses. The sex ratio estimates were used to disaggregate published series of both-sexes mortality rates that were based on a larger number of sources. In many developing countries, I found that sex ratios of mortality have changed in the same direction as historically occurred in developed countries, but typically had a lower degree of female advantage for a given level of mortality. Regional average sex ratios weighted by numbers of births were found to be highly influenced by China and India, the only countries where both infant mortality and overall under-five mortality were estimated to be higher for girls than for boys in the 2000s. For the less developed regions (comprising Africa, Asia excluding Japan, Latin America/Caribbean, and Oceania excluding Australia and New Zealand), on average, boys' under-five mortality in the 2000s was about 2% higher than girls'. A number of countries were found to still experience higher mortality for girls than boys in the 1-4-y age group, with concentrations in southern Asia, northern Africa/western Asia, and western Africa. In the more developed regions (comprising Europe, northern America, Japan, Australia, and New Zealand), I found that the sex ratio of infant mortality peaked in the 1970s or 1980s and declined thereafter.
Conclusions: The methods developed here pinpoint regions and countries where sex differences in mortality merit closer examination to ensure that both sexes are sharing equally in access to health resources. Further study of the distribution of causes of death in different settings will aid the interpretation of differences in survival for boys and girls. Please see later in the article for the Editors' Summary.
Conflict of interest statement
The author has declared that no competing interests exist.
Figures
References
-
- United Nations Secretariat (1998) Levels and trends of sex differentials in infant, child and under-five mortality. In: Too young to die: genes or gender? ST/ESA/SER.A/155. New York: United Nations. pp. 84–108.
-
- United Nations Department of Economic and Social Affairs Population Division (2011) Sex differentials in childhood mortality. ST/ESA/SER.A/314. New York: United Nations.
-
- Hill K, You D, Inoue M, Oestergaard MZ (2012) Child mortality estimation: accelerated progress in reducing global child mortality, 1990–2010. PLoS Med 9: e1011303 doi:10.1371/journal.pmed.1001303. - DOI - PMC - PubMed
-
- Waldron I (1998) Sex differences in infant and early childhood mortality: major causes of death and possible biological causes. In: Too young to die: genes or gender? ST/ESA/SER.A/155. New York: United Nations. pp. 64–83.
-
- Garenne M (1982) Variations in the age pattern of infant and child mortality with special reference to a case study in Ngayokheme (rural Senegal) [PhD dissertation]. Philadelphia: Department of Demography, University of Pennsylvania.
MeSH terms
LinkOut - more resources
Full Text Sources
Medical
