Comparative Study
. 2012;9(8):e1001288.
doi: 10.1371/journal.pmed.1001288. Epub 2012 Aug 28.

Child mortality estimation: a comparison of UN IGME and IHME estimates of levels and trends in under-five mortality rates and deaths

Affiliations
Comparative Study

Child mortality estimation: a comparison of UN IGME and IHME estimates of levels and trends in under-five mortality rates and deaths

Leontine Alkema et al. PLoS Med. 2012.

Abstract

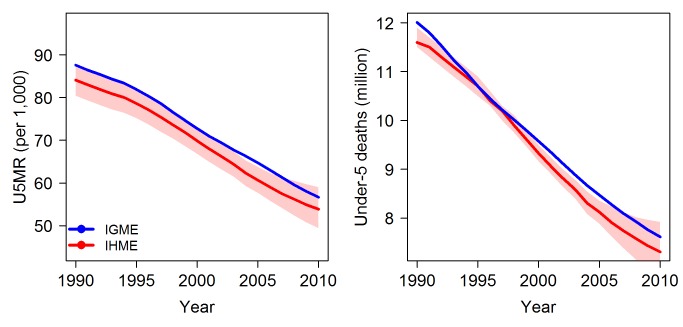
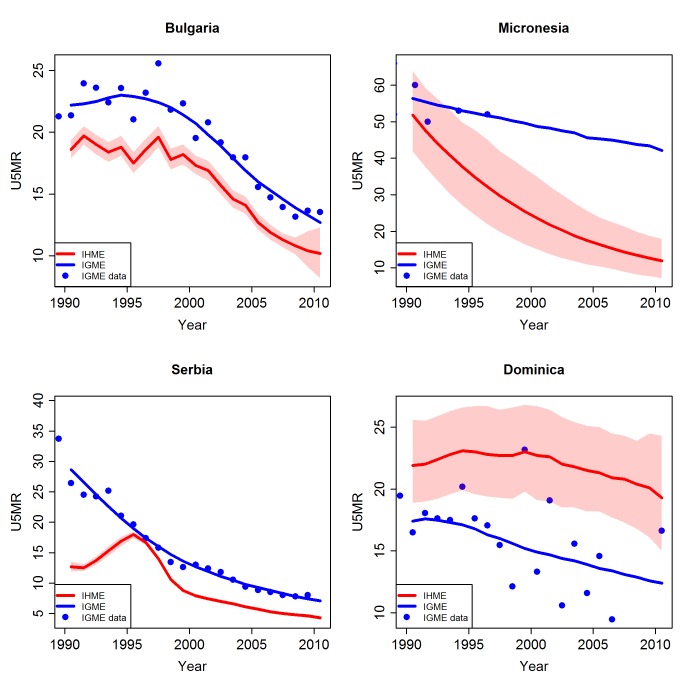
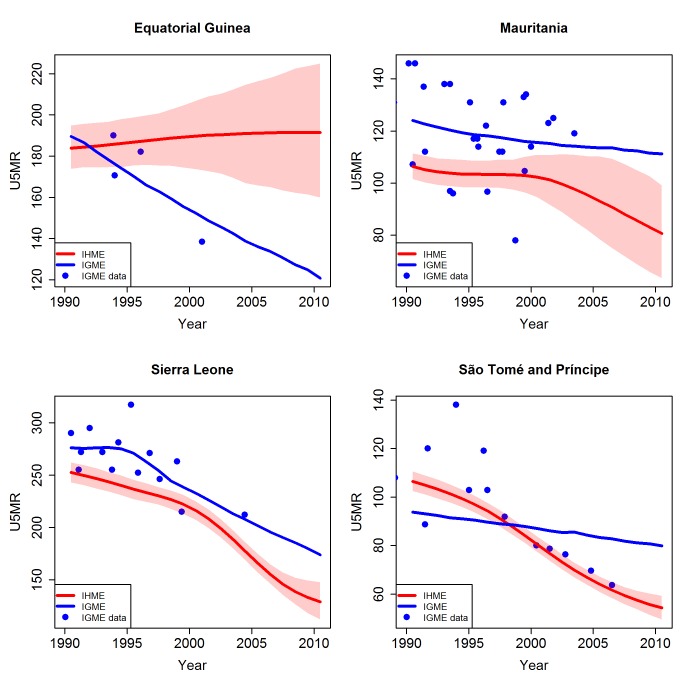
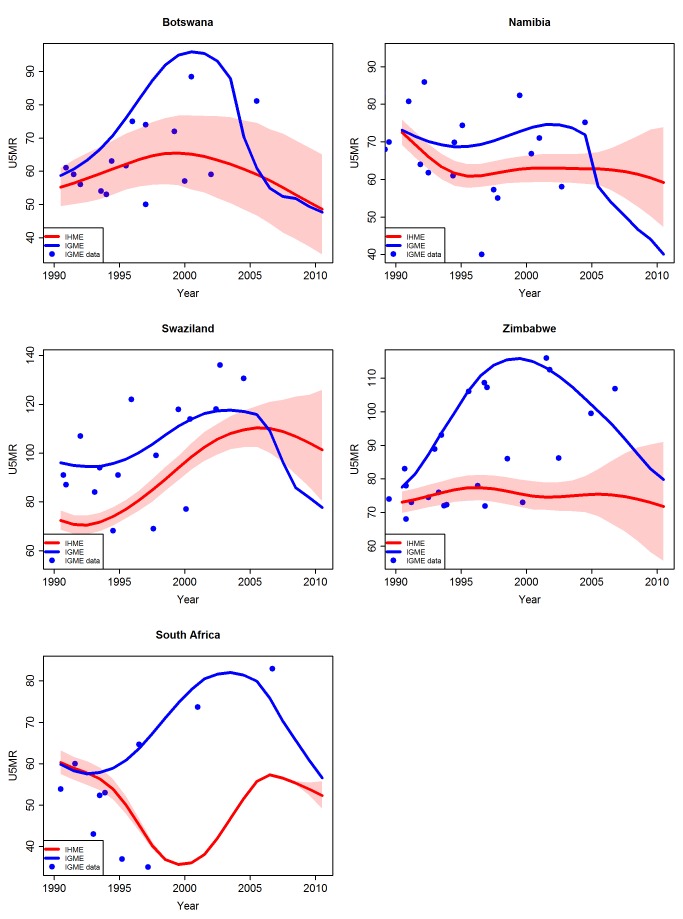
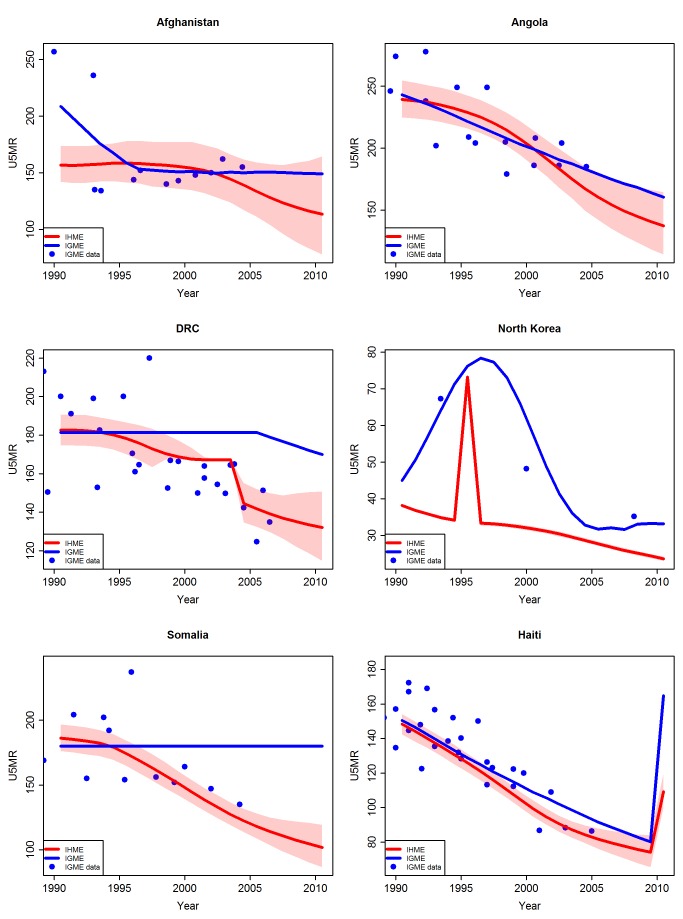
Background: Millennium Development Goal 4 calls for a reduction in the under-five mortality rate (U5MR) by two-thirds between 1990 and 2015. In 2011, estimates were published by the United Nations Inter-agency Group for Child Mortality Estimation (UN IGME) and the Institute for Health Metrics and Evaluation (IHME). The difference in the U5MR estimates produced by the two research groups was more than 10% and corresponded to more than ten deaths per 1,000 live births for 10% of all countries in 1990 and 20% of all countries in 2010, which can lead to conflicting conclusions with respect to countries' progress. To understand what caused the differences in estimates, we summarised differences in underlying data and modelling approaches used by the two groups, and analysed their effects.

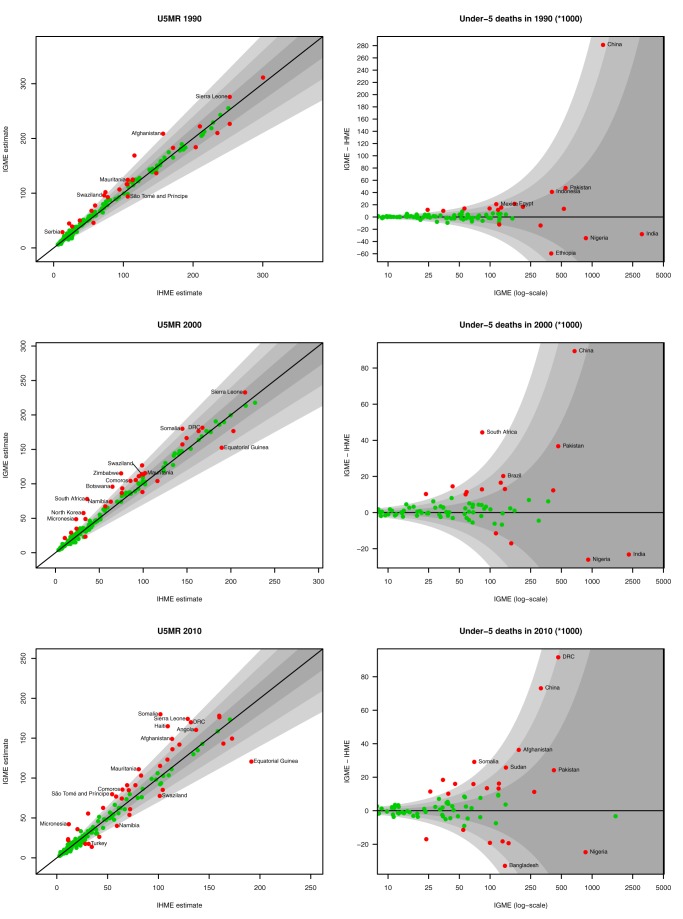
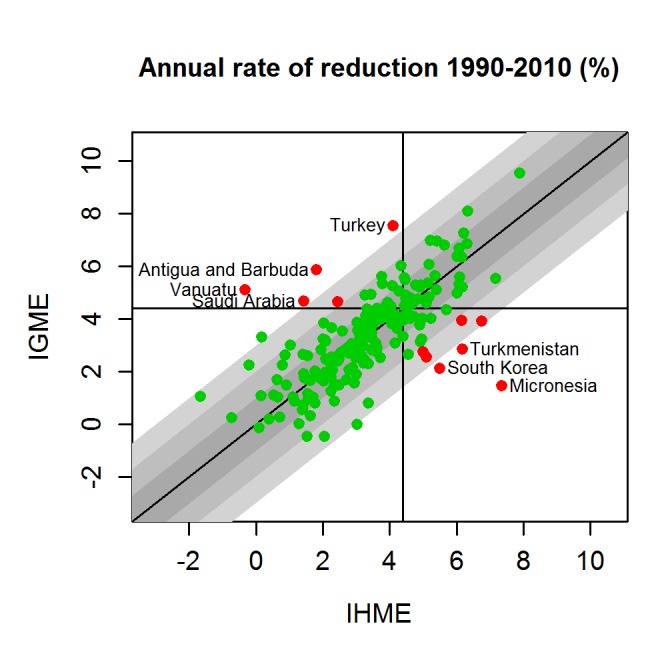
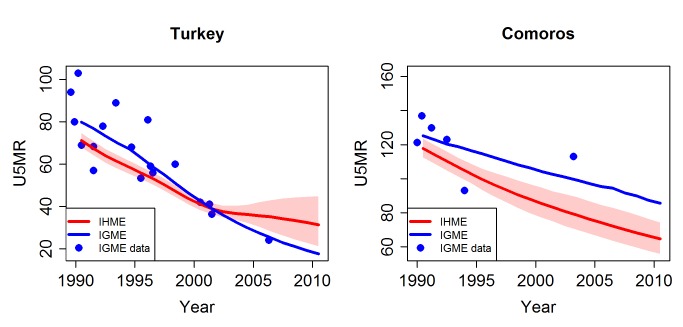
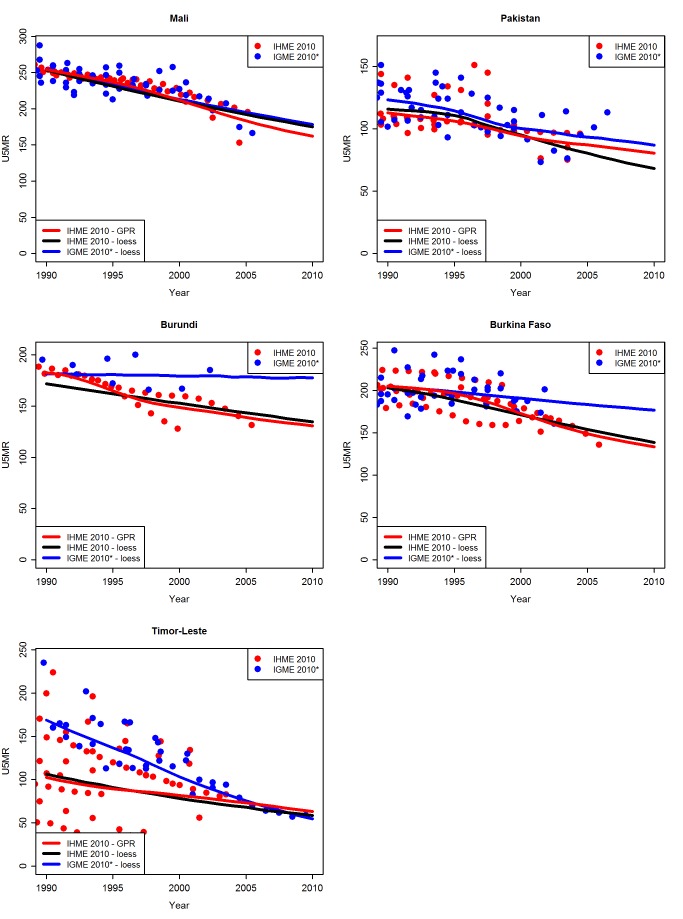
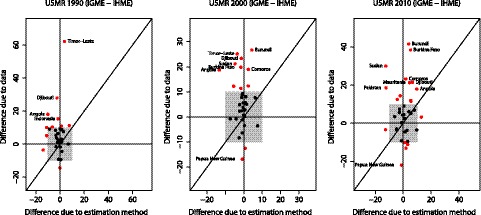
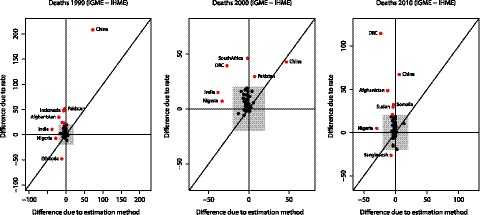
Methods and findings: UN IGME and IHME estimation approaches differ with respect to the construction of databases and the pre-processing of data, trend fitting procedures, inclusion and exclusion of data series, and additional adjustment procedures. Large differences in U5MR estimates between the UN IGME and the IHME exist in countries with conflicts or civil unrest, countries with high HIV prevalence, and countries where the underlying data used to derive the estimates were different, especially if the exclusion of data series differed between the two research groups. A decomposition of the differences showed that differences in estimates due to using different data (inclusion of data series and pre-processing of data) are on average larger than the differences due to using different trend fitting methods.

Conclusions: Substantial country-specific differences between UN IGME and IHME estimates for U5MR and the number of under-five deaths exist because of various differences in data and modelling assumptions used. Often differences are illustrative of the lack of reliable data and likely to decrease as more data become available. Improved transparency on methods and data used will help to improve understanding about the drivers of the differences. Please see later in the article for the Editors' Summary.


Conflict of interest statement

LA is a member of the technical advisory group of the UN IGME. DY is working at the United Nations Children's Fund which is a lead member of the UN IGME. The views expressed in this paper are those of the authors and do not necessarily reflect the views of the United Nations Children's Fund.

Figures

Figure 1
Figure 1. Comparison of global estimates of the U5MR and the number of under-five deaths, from 1990 to 2010.
Estimates by the UN IGME (blue) and the IHME (red, with 95% uncertainty intervals represented by the shaded areas).
Figure 2
Figure 2. UN IGME and IHME estimates of U5MR and under-five deaths for 1990, 2000, and 2010.
Left: UN IGME U5MR estimates are plotted against IHME U5MR estimates. Grey areas represent relative differences of up to ±10%, 20%, and 30%, respectively. Countries for which the estimates differ by more than ten deaths per 1,000 births are highlighted in red. Right: Difference in the number of under-five deaths between the UN IGME and IHME estimates for 1990, 2000, and 2010, plotted against the UN IGME estimate of the number of deaths (on the log scale). Grey areas represent relative differences of up to ±10%, 20%, and 30%, respectively. Countries for which the estimates differ by more than 10,000 deaths are highlighted in red.
Figure 3
Figure 3. UN IGME and IHME estimates of the annual rate of reduction for 1990–2010.
UN IGME estimates are plotted against IHME estimates. Grey area illustrates absolute differences of up to 1%, 2%, and 3%, respectively (absolute difference). Red indicates that the difference is at least 2% and the conclusion as to whether the country is on track to meet MDG 4 (a 4.4% annual decline) differs between the IHME and the UN IGME.
Figure 4
Figure 4. Comparison of U5MR estimates from 1990 to 2010 for examples of countries with different completeness of the databases used by the UN IGME and the IHME.
Estimates by the UN IGME (blue line) and the IHME (red line, with 95% confidence intervals represented by the shaded areas). Data from the UN IGME 2011 database (IGME data) are added as blue dots.
Figure 5
Figure 5. Comparison of U5MR estimates from 1990 to 2010 for examples of countries with different treatment of vital registration data by the UN IGME and the IHME.
Estimates by the UN IGME (blue line) and the IHME (red line, with 95% confidence intervals represented by the shaded areas). Data from the UN IGME 2011 database (IGME data) are added as blue dots.
Figure 6
Figure 6. Comparison of U5MR estimates from 1990 to 2010 for examples of countries where different data series were included and excluded by the UN IGME and the IHME.
Estimates by the UN IGME (blue line) and the IHME (red line, with 95% confidence intervals represented by the shaded areas). Data from the UN IGME 2011 database (IGME data) are added as blue dots.
Figure 7
Figure 7. Comparison of U5MR estimates from 1990 to 2010 for examples of high HIV prevalence countries where the UN IGME carried out an adjusted estimation procedure.
Estimates by the UN IGME (blue line) and the IHME (red line, with 95% confidence intervals represented by the shaded areas). Data from the UN IGME 2011 database (IGME data) are added as blue dots. Note that for South Africa, treatment of VR data also differs between the UN IGME and the IHME.
Figure 8
Figure 8. Comparison of U5MR estimates from 1990 to 2010 for examples of countries with conflicts/natural disasters or dubious data quality.
Estimates by the UN IGME (blue line) and the IHME (red line, with 95% confidence intervals represented by the shaded areas). Data from the UN IGME 2011 database (IGME data) are added as blue dots.
Figure 9
Figure 9. Examples of U5MR estimates based on loess versus GPR fitting methods.
For each country is shown (i) loess fit to the 2011 UN IGME database (IGME 2010*; data and fit in blue; dataset excludes data collected in 2010), (ii) loess fit to the 2010 IHME database (data in red; fit in black), and (iii) GPR fit to the 2010 IHME database (IHME 2010; data and fit in red).
Figure 10
Figure 10. Decomposition of differences in U5MR for 1990, 2000, and 2010 into differences due to data and differences due to use of GPR.
The grey box represents differences up to ten deaths per 1,000 births. Countries for which the difference due to either factor is larger than ten deaths per 1,000 births are highlighted in red.
Figure 11
Figure 11. Decomposition of differences in under-five deaths for 1990, 2000, and 2010 into differences due to rates and differences due to estimation method.
The grey box represents differences up to 20,000 deaths. Countries for which the difference due to either factor is larger than 20,000 deaths are highlighted in red.

References

    1. United Nations Children's Fund (2011) Levels & trends in child mortality: report 2011. Estimates developed by the UN Inter-agency Group for Child Morality Estimation. New York: United Nations Children's Fund.
    1. Lozano R, Wang H, Foreman KJ, Rajaratnam JK, Naghavi M, et al. (2011) Progress towards Millennium Development Goals 4 and 5 on maternal and child mortality: an updated systematic analysis. Lancet 378: 1139–1165. - PubMed
    1. Boerma JT, Mathers C, Abou-Zahr C (2010) WHO and global health monitoring: the way forward. PLoS Med 7: e1000373 doi:10.1371/journal.pmed.1000373. - DOI - PMC - PubMed
    1. Murray CJL, Lopez AD (2010) Production and analysis of health indicators: the role of academia. PLoS Med 7: e1001004 doi:10.1371/journal.pmed.1001004. - DOI - PMC - PubMed
    1. Department of International Economic and Social Affairs (1983) Manual X—indirect techniques for demographic estimation. New York: United Nations.

Publication types

MeSH terms