

Child mortality estimation: appropriate time periods for child mortality estimates from full birth histories
- PMID: 22952435
- PMCID: PMC3429388
- DOI: 10.1371/journal.pmed.1001289
Child mortality estimation: appropriate time periods for child mortality estimates from full birth histories
Abstract
Background: Child mortality estimates from complete birth histories from Demographic and Health Surveys (DHS) surveys and similar surveys are a chief source of data used to track Millennium Development Goal 4, which aims for a reduction of under-five mortality by two-thirds between 1990 and 2015. Based on the expected sample sizes when the DHS program commenced, the estimates are usually based on 5-y time periods. Recent surveys have had larger sample sizes than early surveys, and here we aimed to explore the benefits of using shorter time periods than 5 y for estimation. We also explore the benefit of changing the estimation procedure from being based on years before the survey, i.e., measured with reference to the date of the interview for each woman, to being based on calendar years.
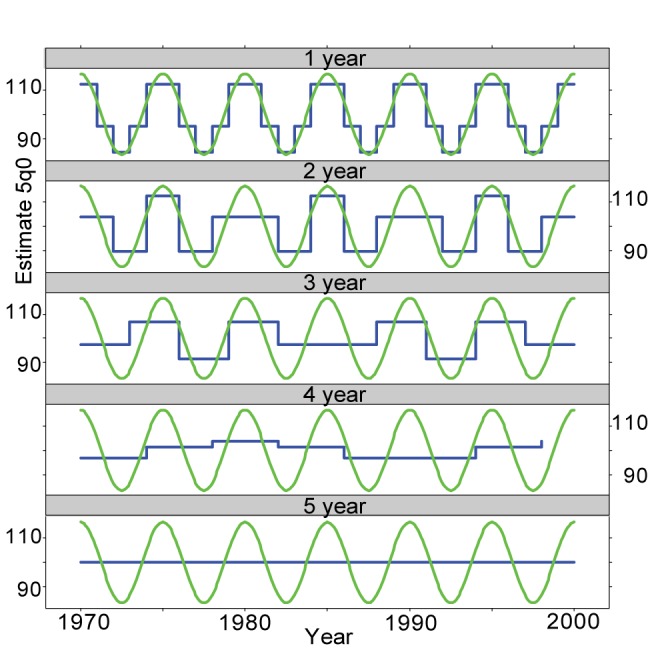
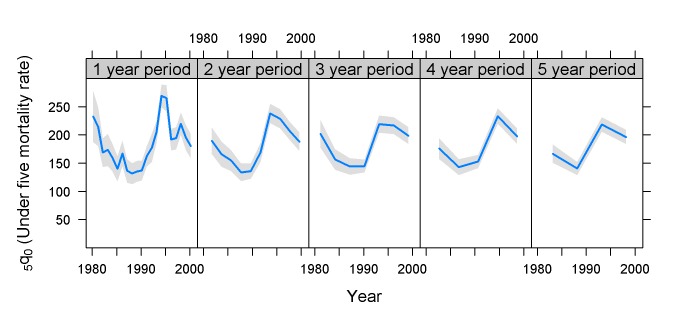
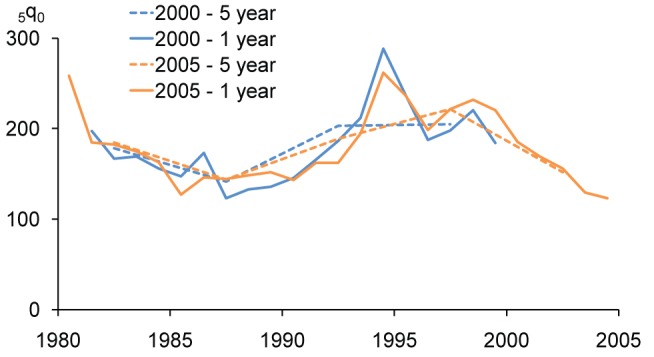
Methods and findings: Jackknife variance estimation was used to calculate standard errors for 207 DHS surveys in order to explore to what extent the large samples in recent surveys can be used to produce estimates based on 1-, 2-, 3-, 4-, and 5-y periods. We also recalculated the estimates for the surveys into calendar-year-based estimates. We demonstrate that estimation for 1-y periods is indeed possible for many recent surveys.
Conclusions: The reduction in bias achieved using 1-y periods and calendar-year-based estimation is worthwhile in some cases. In particular, it allows tracking of the effects of particular events such as droughts, epidemics, or conflict on child mortality in a way not possible with previous estimation procedures. Recommendations to use estimation for short time periods when possible and to use calendar-year-based estimation were adopted in the United Nations 2011 estimates of child mortality.
Conflict of interest statement
The authors have declared the following competing interests: Stanton-Hill Research supported this study. Kenneth Hill of Stanton-Hill Research is also the chair of the Technical Advisory Group (TAG) to the UN Inter Agency group of Child Mortality Estimation. There are no patents, products in development or marketed products to declare. This does not alter our adherence to all the
Figures


References
-
- Measure DHS (1996) Sampling manual, DHS-III basic documentation No 6. Calverton: Macro International.
-
- Hill K, You D, Inoue M, Oestergaard MZ (2012) Child Mortality Estimation: Accelerated progress in reducing global child mortality, 1990–2010. PLoS Med 9: e1001303 doi:10.1371/journal.pmed.1001303. - DOI - PMC - PubMed
-
- United Nations (1993) Sampling errors in household surveys. New York: United Nations Department for Economic and Social Information and Policy Analyses.
-
- Ward D (2007) Data and metadata reporting and presentation handbook: Paris: Organisation for Economic Co-operation and Development.
-
- Särndal C-E, Swensson B, Wretman J (1992) Model assisted survey sampling. New York: Springer-Verlag. 694 p.
Publication types
MeSH terms
LinkOut - more resources
Full Text Sources
Medical
