. 2012;8(8):e1002885.
doi: 10.1371/journal.ppat.1002885. Epub 2012 Aug 30.

Measles immune suppression: lessons from the macaque model

Affiliations

Measles immune suppression: lessons from the macaque model

Rory D de Vries et al. PLoS Pathog. 2012.

Abstract

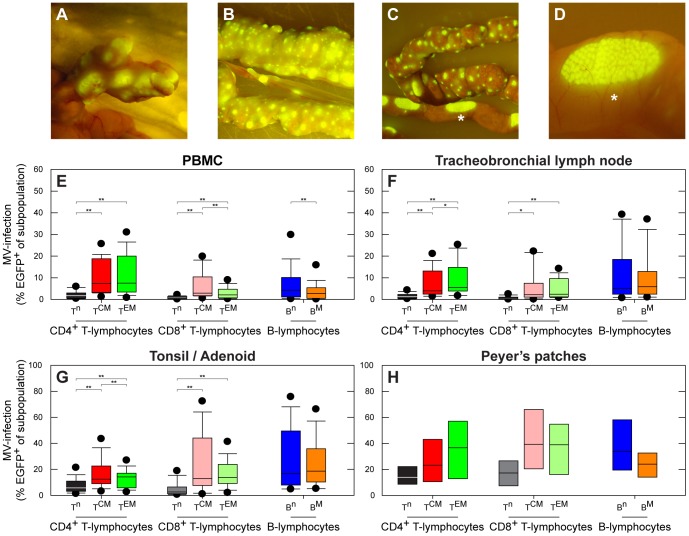
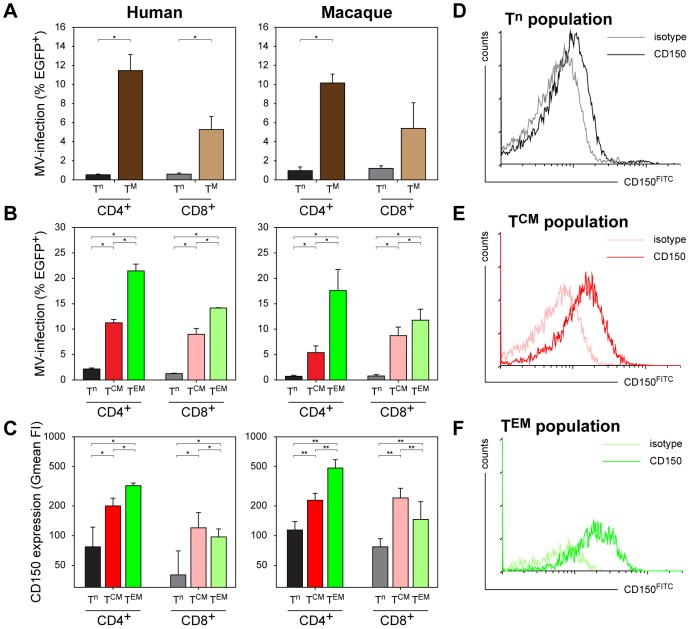
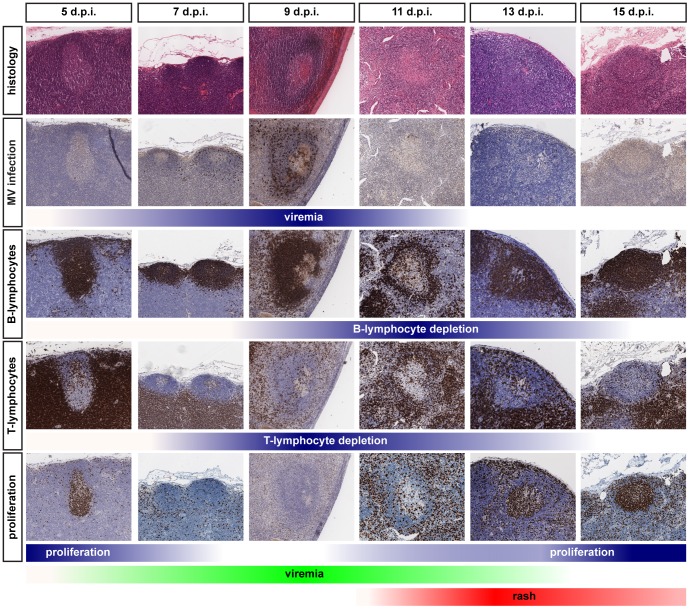
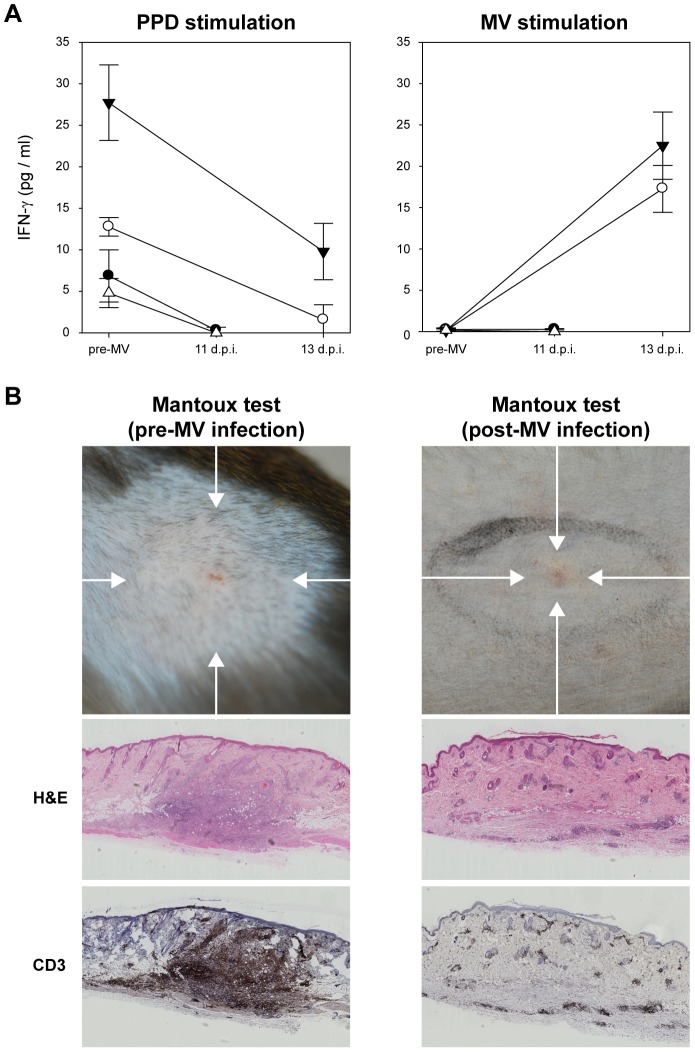
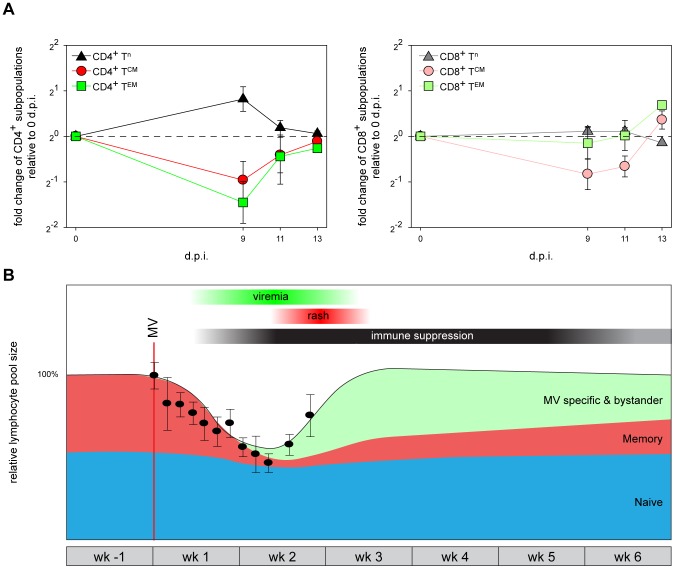
Measles remains a significant childhood disease, and is associated with a transient immune suppression. Paradoxically, measles virus (MV) infection also induces robust MV-specific immune responses. Current hypotheses for the mechanism underlying measles immune suppression focus on functional impairment of lymphocytes or antigen-presenting cells, caused by infection with or exposure to MV. We have generated stable recombinant MVs that express enhanced green fluorescent protein, and remain virulent in non-human primates. By performing a comprehensive study of virological, immunological, hematological and histopathological observations made in animals euthanized at different time points after MV infection, we developed a model explaining measles immune suppression which fits with the "measles paradox". Here we show that MV preferentially infects CD45RA(-) memory T-lymphocytes and follicular B-lymphocytes, resulting in high infection levels in these populations. After the peak of viremia MV-infected lymphocytes were cleared within days, followed by immune activation and lymph node enlargement. During this period tuberculin-specific T-lymphocyte responses disappeared, whilst strong MV-specific T-lymphocyte responses emerged. Histopathological analysis of lymphoid tissues showed lymphocyte depletion in the B- and T-cell areas in the absence of apoptotic cells, paralleled by infiltration of T-lymphocytes into B-cell follicles and reappearance of proliferating cells. Our findings indicate an immune-mediated clearance of MV-infected CD45RA(-) memory T-lymphocytes and follicular B-lymphocytes, which causes temporary immunological amnesia. The rapid oligoclonal expansion of MV-specific lymphocytes and bystander cells masks this depletion, explaining the short duration of measles lymphopenia yet long duration of immune suppression.


Conflict of interest statement

A.D.M.E. Osterhaus wishes to declare, for the avoidance of any misunderstanding on competing interests, that he co-founded and is chief scientific officer of Viroclinics Biosciences, a company set up in collaboration with Erasmus MC. However, for clarification, no materials or support were received from the company, and no agreements were in place concerning the execution or publication of this work. This does not alter our adherence to all PLoS Pathogens policies on sharing data and materials. The authors have no additional financial interests.

Figures

Figure 1
Figure 1. MV infects high percentages of B-lymphocytes and CD45RA memory T-lymphocytes.
(A–D) Macroscopic detection of EGFP in lymphoid tissues of the gastro-intestinal tract in three different macaques: mesenteric lymph nodes (A), gut-associated lymphoid tissue (GALT) (B and C), including the Peyer's patches (C and D). Panel D is an enlargement of panel C (indicated by asterisk); (E–H) MV infection percentages in lymphocyte subsets during the approximate peak viremia. T-lymphocyte subpopulations were identified as Tn (CD45RA+), TCM (CD45RACCR7+) or TEM (CD45RACCR7), B-lymphocytes were identified as Bn (CD27IgD+) or BM (CD27+IgD). Box plots were chosen since the data were not normally distributed, and show the median infection percentages with the 25th–75th percentiles, error bars indicate the 10th–90th percentiles, dots the 5th–95th percentiles. The 10th–90th percentiles and 5th–95th percentiles are only shown if the number of observations is at least ten; **, P<0.01. *, P<0.05. In panel E, F and G 14 animals were included; in panel H 3 animals were included.
Figure 2
Figure 2. Susceptibility of human or macaque T-lymphocyte subsets to in vitro MV infection.
(A) Human or macaque PBMC were sorted into naive (CD45RA+, Tn) or memory (CD45RA, TM) CD4+ or CD8+ T-lymphocytes, and infected with MV in vitro. Percentages MV-infected T-lymphocytes were determined 2 d.p.i. by measuring EGFP fluorescence by flow cytometry. CD4+ (human and macaque) and CD8+ (human only) TM were significantly more susceptible to MV infection than the corresponding Tn. For macaque CD8+ T-lymphocytes the difference was significant in two out of three experiments; (B) Unsorted human and macaque PBMC were infected, MV infection percentages in the different T-lymphocyte subsets were determined 2 d.p.i. by flow cytometry. Both in human and macaque PBMC the CD4+ and CD8+ TCM and TEM were significantly more susceptible to MV infection than the corresponding Tn subpopulations. In addition, CD4+ TEM and, to a lesser extent, CD8+ TEM proved more susceptible to MV infection than TCM. (C–F) Levels of CD150 expression on the different T-lymphocyte subsets in human and macaque PBMC. (C) PBMC collected from human or macaque donors were stained for memory markers as described in Figure S1, in combination with an IgG1 isotype control or CD150FITC staining. CD150 expression on the different subsets is shown as geometric mean fluorescence intensity (Gmean FI) ± SD. Both for humans and macaques CD150 expression on CD4+ and CD8+ TCM and TEM was significantly higher than on Tn. Interestingly, in CD4+ T-lymphocytes CD150 expression was significantly higher on TEM than on TCM, whereas in CD8+ T-lymphocytes an inverse pattern was observed. (D–F) An IgG1 isotype control was used to determine the level of background staining, and is shown in combination with the CD150 staining for each subset. **, P<0.01. *, P<0.05. Experiments were performed with sorted cells from 3 macaque and 2 human donors, and unsorted cells from 4 macaque and 5 human donors. Data are shown as means ± standard deviation (SD) of representative donors.
Figure 3
Figure 3. Histology and immunohistochemistry of lymphoid tissues obtained from macaques euthanized between 5 and 15 d.p.i.
Serial sections were stained for histological changes (H&E), MV infection (EGFP), B-lymphocytes (CD20), T-lymphocytes (CD3) or proliferating cells (Ki67). Multiple lymphoid tissues from multiple animals collected at each time-point were analyzed, panels shown are representative for the tissues that have been examined. The color intensity of the blue bars below the photomicrographs indicates the relative levels of viremia, lymphocyte depletion or proliferation. The green and red bars at the bottom indicate the appearance and disappearance of viremia and rash and correspond to the bars in Figure 5B.
Figure 4
Figure 4. MV infection causes temporary immunological amnesia.
(A) T-lymphocyte responses to PPD and MV were measured by IFN-γ production after in vitro stimulation of PBMC collected from 4 BCG-vaccinated macaques. Measurements were performed in triplicate, graphs shows means ± SD; (B) Mantoux tests were performed 7 days before (n = 4) and 8 (n = 2) or 10 (n = 2) days after MV infection. Images were collected 3 days after intra-dermal injection with tuberculin. Before MV infection classical delayed-type hypersensitivity responses were observed, associated with diffuse swelling and redness (indicated by arrows), after MV only a small localized papule was observed (indicated by arrow). H&E and CD3 staining of the corresponding skin tissues showed infiltration of T-lymphocytes in the dermis of the pre-infection Mantoux response, which was absent after MV infection. Representative images from 4 animals are shown.
Figure 5
Figure 5. A model for measles immune suppression.
(A) Relative population sizes of CD4+ or CD8+ Tn, TCM and TEM in PBMC at different d.p.i., expressed as fold changes relative to 0 d.p.i. Means ± SEM of 9 animals are shown. (B). A model describing the changes in the relative size of pre-existing naive lymphocytes (blue), pre-existing memory lymphocytes (red, sum of TM and follicular B-lymphocytes) and newly induced MV-specific (and bystander) lymphocytes (green) before, during and after measles. The relative WBC counts obtained from the macaques included in this study have been overlaid (black circles, means ± SEM). Thirty-four animals were included to obtain the WBC count graph. The red line indicates the time-point of MV-infection, bars above the graph indicate the approximate period of MV viremia (green), rash (red) and immune suppression (black).

References

    1. Beckford AP, Kaschula RO, Stephen C (1985) Factors associated with fatal cases of measles. A retrospective autopsy study. S Afr Med J 68: 858–863. - PubMed
    1. Akramuzzaman SM, Cutts FT, Wheeler JG, Hossain MJ (2000) Increased childhood morbidity after measles is short-term in urban Bangladesh. Am J Epidemiol 151: 723–735. - PubMed
    1. Shanks GD, Lee SE, Howard A, Brundage JF (2011) Extreme mortality after first introduction of measles virus to the polynesian island of Rotuma, 1911. Am J Epidemiol 173: 1211–1222. - PubMed
    1. Von Pirquet CE (1908) Das Verhalten der kutanen Tuberkulin-reaktion während der Masern. Dtsch Med Wochenschr 34: 1297–1300.
    1. Tamashiro VG, Perez HH, Griffin DE (1987) Prospective study of the magnitude and duration of changes in tuberculin reactivity during uncomplicated and complicated measles. Pediatr Infect Dis J 6: 451–454. - PubMed

Publication types

MeSH terms

Substances