Increasing coverage of transcription factor position weight matrices through domain-level homology
- PMID: 22952610
- PMCID: PMC3428306
- DOI: 10.1371/journal.pone.0042779
Increasing coverage of transcription factor position weight matrices through domain-level homology
Abstract
Transcription factor-DNA interactions, central to cellular regulation and control, are commonly described by position weight matrices (PWMs). These matrices are frequently used to predict transcription factor binding sites in regulatory regions of DNA to complement and guide further experimental investigation. The DNA sequence preferences of transcription factors, encoded in PWMs, are dictated primarily by select residues within the DNA binding domain(s) that interact directly with DNA. Therefore, the DNA binding properties of homologous transcription factors with identical DNA binding domains may be characterized by PWMs derived from different species. Accordingly, we have implemented a fully automated domain-level homology searching method for identical DNA binding sequences.By applying the domain-level homology search to transcription factors with existing PWMs in the JASPAR and TRANSFAC databases, we were able to significantly increase coverage in terms of the total number of PWMs associated with a given species, assign PWMs to transcription factors that did not previously have any associations, and increase the number of represented species with PWMs over an order of magnitude. Additionally, using protein binding microarray (PBM) data, we have validated the domain-level method by demonstrating that transcription factor pairs with matching DNA binding domains exhibit comparable DNA binding specificity predictions to transcription factor pairs with completely identical sequences.The increased coverage achieved herein demonstrates the potential for more thorough species-associated investigation of protein-DNA interactions using existing resources. The PWM scanning results highlight the challenging nature of transcription factors that contain multiple DNA binding domains, as well as the impact of motif discovery on the ability to predict DNA binding properties. The method is additionally suitable for identifying domain-level homology mappings to enable utilization of additional information sources in the study of transcription factors. The domain-level homology search method, resulting PWM mappings, web-based user interface, and web API are publicly available at http://dodoma.systemsbiology.netdodoma.systemsbiology.net.
Conflict of interest statement
Figures


 ) for position weight matrix (PWM) scanning of transcription factor pairs and their accompanying experimental protein binding microarray (PBM) fluorescence intensities. Transcription factor pair groupings, as in Figure 1, were cross scans of completely-identical pairs (CCI), cross scans of domain-identical pairs (CDI), self scans of completely-identical pairs (SCI), and self scans of domain-identical pairs (SDI). Each point represents a PWM:PBM pairing as described in the Methods. The transcription factor Elf3 (UniPROBE identifiers UP00090 and UP00407) was an outlier with the lowest correlation coefficients. The lower correlation coefficients for these identifiers is likely due to the transcription factor Elf3 having two different DNA binding domains.
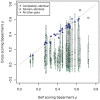
 ) between position weight matrix-based scores and experimental PBM fluorescence intensities. The blue points are the completely-identical and domain-identical transcription factor pairs of Figure 1. The alignment of blue points along the gray diagonal line demonstrates the comparable performance of PWMs derived from completely-identical and domain-identical transcription factor pairs, whereas the magnitude of
  is an indication of how well the PWM captures the DNA binding properties of the transcription factor. As a point of comparison, the correlation coefficients for all other pairwise sets of transcription factors were calculated. The green points below the gray diagonal are indicative of PWMs from other transcription factors that failed to capture the DNA binding properties in the PBM data. Green points near the diagonal resulted from other transcription factors within the same domain family (e.g., homeodomain) that have similar PWMs and, therefore, DNA binding properties. UniPROBE identifiers UP00017 and UP00389 were significantly outperformed by other PWMs in the data set (see text for details).

References
-
- Stormo GD (2000) DNA binding sites: representation and discovery. Bioinformatics 16: 16–23. - PubMed
-
- Wasserman WW, Sandelin A (2004) Applied bioinformatics for the identification of regulatory elements. Nat Rev Genet 5: 276–287. - PubMed
-
- Berg OG, von Hippel PH (1987) Selection of DNA binding sites by regulatory proteins. Statisticalmechanical theory and application to operators and promoters. J Mol Biol 193: 723–750. - PubMed
Publication types
MeSH terms
Substances
Grants and funding
LinkOut - more resources
Full Text Sources

