Comparative Study
. 2012;7(8):e42931.
doi: 10.1371/journal.pone.0042931. Epub 2012 Aug 30.

Comparative transcriptome analysis of two olive cultivars in response to NaCl-stress

Affiliations
Comparative Study

Comparative transcriptome analysis of two olive cultivars in response to NaCl-stress

Christos Bazakos et al. PLoS One. 2012.

Abstract

Background: Olive (Olea europaea L.) cultivation is rapidly expanding and low quality saline water is often used for irrigation. The molecular basis of salt tolerance in olive, though, has not yet been investigated at a system level. In this study a comparative transcriptomics approach was used as a tool to unravel gene regulatory networks underlying salinity response in olive trees by simulating as much as possible olive growing conditions in the field. Specifically, we investigated the genotype-dependent differences in the transcriptome response of two olive cultivars, a salt-tolerant and a salt-sensitive one.

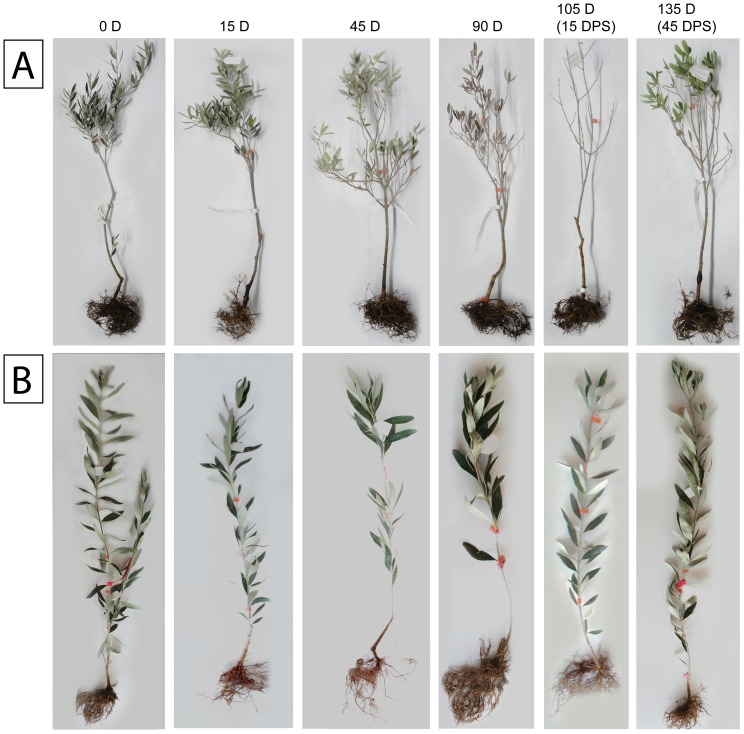
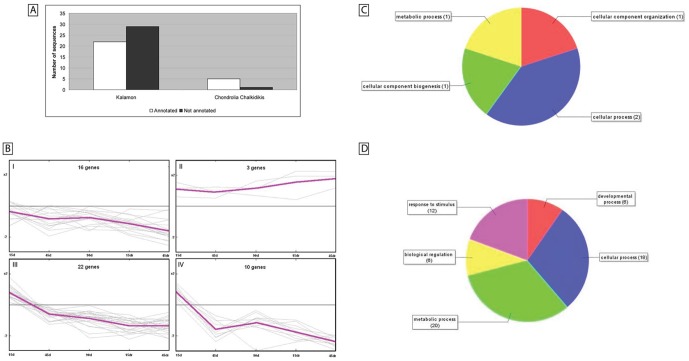
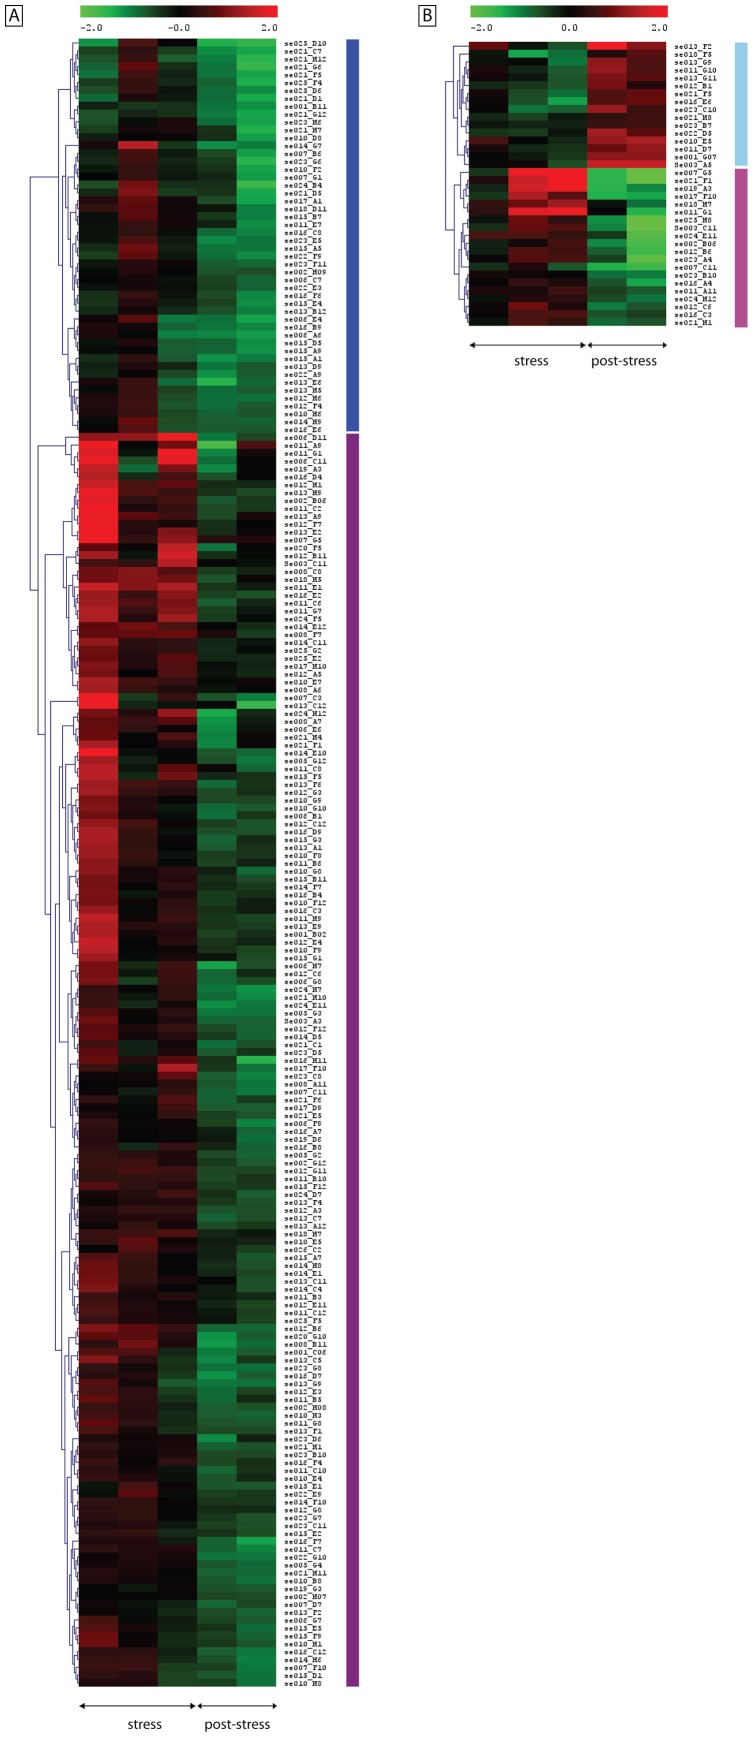
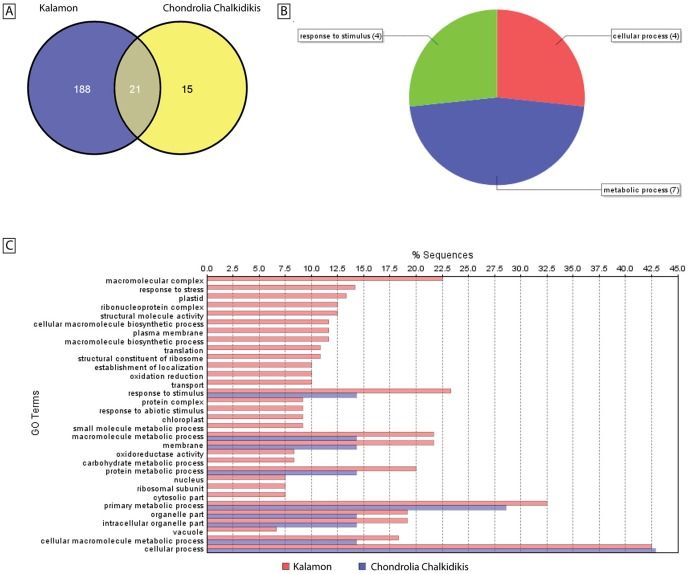
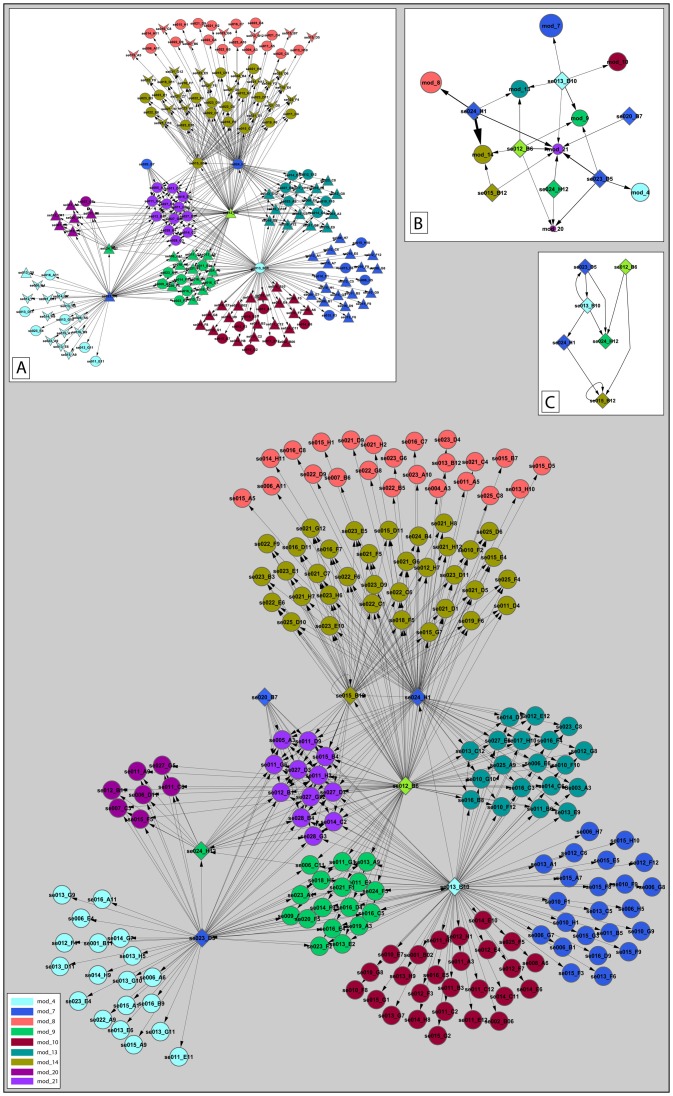
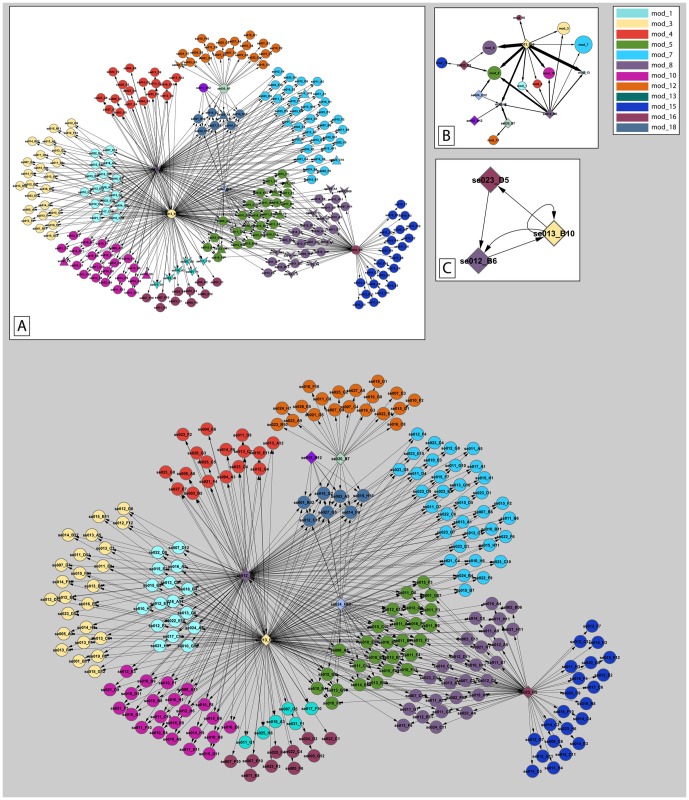
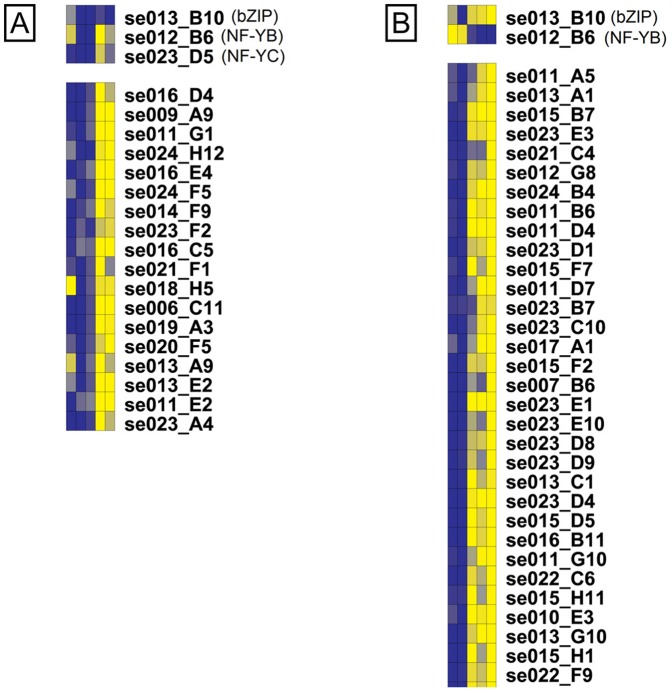
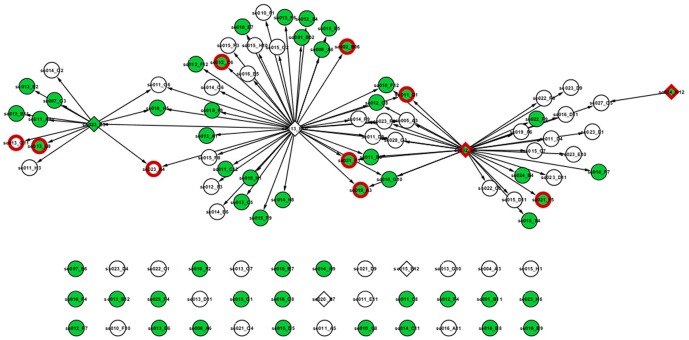
Methodology/principal findings: A 135-day long salinity experiment was conducted using one-year old trees exposed to NaCl stress for 90 days followed by 45 days of post-stress period during the summer. A cDNA library made of olive seedling mRNAs was sequenced and an olive microarray was constructed. Total RNA was extracted from root samples after 15, 45 and 90 days of NaCl-treatment as well as after 15 and 45 days of post-treatment period and used for microarray hybridizations. SAM analysis between the NaCl-stress and the post-stress time course resulted in the identification of 209 and 36 differentially expressed transcripts in the salt-tolerant and salt-sensitive cultivar, respectively. Hierarchical clustering revealed two major, distinct clusters for each cultivar. Despite the limited number of probe sets, transcriptional regulatory networks were constructed for both cultivars while several hierarchically-clustered interacting transcription factor regulators such as JERF and bZIP homologues were identified.

Conclusions/significance: A systems biology approach was used and differentially expressed transcripts as well as regulatory interactions were identified. The comparison of the interactions among transcription factors in olive with those reported for Arabidopsis might indicate similarities in the response of a tree species with Arabidopsis at the transcriptional level under salinity stress.


Conflict of interest statement

Competing Interests: The authors have declared that no competing interests exist.

Figures

Figure 1
Figure 1. Pie chart of the EST annotation of olive seedling cDNA library.
Biological process level 3 of 1956 transcripts according to Blast2GO database.
Figure 2
Figure 2. Visual symptoms of Na-Cl stress.
One-year-old olive trees cvs Chondrolia Chalkidikis [A] and Kalamon [B] throughout the experimental timepoints: 15 days, 45 days and 90 days of stress and 15 days and 45 days post-stress.
Figure 3
Figure 3. GO annotation of the differentially expressed transcripts.
[A] 22/51 of the differentially expressed transcripts (2-class paired SAM) of cv. Kalamon and 5/6 of the differentially expressed transcripts (2-class paired SAM) transcripts of cv. Chondrolia Chalkidikis were annotated using the 1e-6 threshold of blastx in the Blast2GO software. [B] K-means clustering of the 51 Kalamon differentially expressed transcripts. Log2 (Treated/Control) gene expression data were best represented by four k-means clusters. Time and fold change are indicated on the x- and y-axes, respectively. In each cluster, the number of transcripts is indicated. A pseudoline in magenta colour superimposed on each cluster represents the general pattern of expression. [C] Pie chart of the cv. Chondrolia Chalkidikis annotated transcripts. [D] Pie chart of the cv. Kalamon annotated transcripts.
Figure 4
Figure 4. Differentially expressed transcripts between the stress and the post-stress period.
Hierarchical clustering revealed the existence of distinct clusters in both cultivars. [A] In cv. Kalamon, 209 differentially expressed transcripts were hierarchically grouped in two major clusters denoted with two vertical bars. The blue bar represents a cluster comprised of 50 transcripts which are up-regulated only after 45 days of stress. The magenta bar represents a cluster comprised of 159 transcripts which are up-regulated throughout the stress period. [B] In cv. Chondrolia Chalkidikis, 36 differentially expressed transcripts were hierarchically grouped in two major clusters denoted with two vertical bars. The light blue bar represents a cluster of 16 transcripts which are down-regulated during stress and up-regulated during post-stress period. The light magenta bar represents a cluster comprised of 20 transcripts which are up-regulated after 45 and 90 days of stress and down-regulated during post-stress period.
Figure 5
Figure 5. Comparison, GO annotation and Fisher's exact test of differentially expressed transcripts under stress and post-stress.
[A] Venn diagrams of the differentially expressed transcripts in cross-cultivar microarray comparisons. The Venn diagrams show the number of overlapping and non-overlapping transcripts with significantly differential expression between stress and post-stress period. 188 unique transcripts were identified in cv. Kalamon and 15 in cv. Chondrolia Chalkidikis while 21 transcripts were common in both cultivars. [B] GO annotation level 2 of the 21 transcripts. [C] Fisher's exact test for the probability that the observed distribution of terms in the set of cv. Kalamon transcripts was significantly different (FDR<0.05) from the set of cv. Chondrolia Chalkidikis transcripts.
Figure 6
Figure 6. Transcriptional regulatory network of cv. Kalamon under salinity.
A total number of 186 transcripts participated in the regulatory program, clustered in 9 non-overlapping modules (main frame). Modules are color-coded as indicated in the left-down inset. Diamonds represent transcripts encoding transcription factors (TFs) whereas circles represent transcripts regulated by TFs. The directionality of the regulation is indicated through arrowed edges heading from the TF to the target gene. [Inset A] Transcripts are divided into three categories. The triangles represent differentially expressed transcripts which are grouped in the magenta-colored cluster (see Figure 4A); V-shapes represent differentially expressed transcripts which are grouped in the blue-colored cluster (see Figure 4A). The circles represent non-differentially expressed transcripts. [Inset B] An abstract representation of the transcriptional regulatory network. The diamonds represent TFs. The circles represent modules and the length of their diameter is proportional to their transcript number. The color of each module is similar with those of the main frame. The width of the arrow is proportional to the weight of the regulatory interaction. [Inset C] The hierarchical TF regulatory network. The color of each TF is similar to the color of the module it belongs. The directionality of the regulation is indicated through arrowed edges.
Figure 7
Figure 7. Transcriptional regulatory network of the response of cv. Chondrolia Chalkidikis under salinity.
A total number of 237 transcripts participated in the regulatory program, clustered in 12 non-overlapping modules (main frame). Modules are color-coded as indicated in the right-up inset. Diamonds represent transcripts encoding transcription factors (TFs) whereas circles represent transcripts regulated by TFs. The directionality of the regulation is indicated through arrowed edges heading from the TF to the target gene. [Inset A] Transcripts are divided into three categories. The triangles represent differentially expressed transcripts which are grouped in the magenta-colored cluster (see Figure 4B); V-shapes represent differentially expressed transcripts which are grouped in the blue-colored cluster (see Figure 4B). The circles represent non-differentially expressed transcripts. [Inset B] An abstract representation of the transcriptional regulatory network. The diamonds represent TFs. The circles represent modules and the length of their diameter is proportional to their transcript number. The color of each module is similar with those of the main frame. The width of the arrow is proportional to the weight of the regulatory interaction. [Inset C] The hierarchical TF regulatory network. The color of each TF is similar to the color of the module it belongs to. The directionality of the regulation is indicated through arrowed edges.
Figure 8
Figure 8. Expression panel of selected regulatory networks.
The upper panel represents the regulatory TFs of a module and the lower panel the transcripts it consists of. Each column represents a time-point. The expression of the transcripts and TFs is color-coded with the dark blue representing lower expression whereas the bright yellow represents higher expression. [A] module-9 in cv. Kalamon; [B] module-7 in cv. Chondrolia Chalkidikis. Both modules are enriched in GO annotations related to stimulus response.
Figure 9
Figure 9. Intersection of the cv. Kalamon and cv. Chondrolia Chalkidikis transcriptional regulatory networks.
69 nodes share an edge that corresponds to a regulatory interaction between a TF and a transcript while 36 nodes are isolated, implicating their presence in both networks but with different interacting pairs. Diamond-shaped nodes represent TFs, circles represent regulatory transcripts. Green nodes are differentially expressed transcripts in cv Kalamon and red nodes are differentially expressed transcripts in cv Chondrolia Chalkidikis.

References

    1. Munns R (2002) Comparative physiology of salt and water stress. Plant, cell & environment 25: 239–250. - PubMed
    1. Tattini M, Montagni G, Traversi ML (2002) Gas exchange, water relations and osmotic adjustment in Phillyrea latifolia grown at various salinity concentrations. Tree physiology 22: 403–412. - PubMed
    1. Munns R (2005) Genes and salt tolerance: bringing them together. The New phytologist 167: 645–663. - PubMed
    1. Tattini M, Traversi M (2009) On the mechanism of salt tolerance in olive (Olea europaea L.) under low- or high-Ca2+ supply. Environmental and Experimental Botany 65: 72–81.
    1. Tattini M, Bertoni P, Caselli S (1992) Genotypic responses of olive plants to sodium chloride. Journal of Plant Nutrition 15: 1467–1485.

Publication types