. 2012;7(8):e43403.
doi: 10.1371/journal.pone.0043403. Epub 2012 Aug 29.

Fenton reaction induced cancer in wild type rats recapitulates genomic alterations observed in human cancer

Affiliations

Fenton reaction induced cancer in wild type rats recapitulates genomic alterations observed in human cancer

Shinya Akatsuka et al. PLoS One. 2012.

Abstract

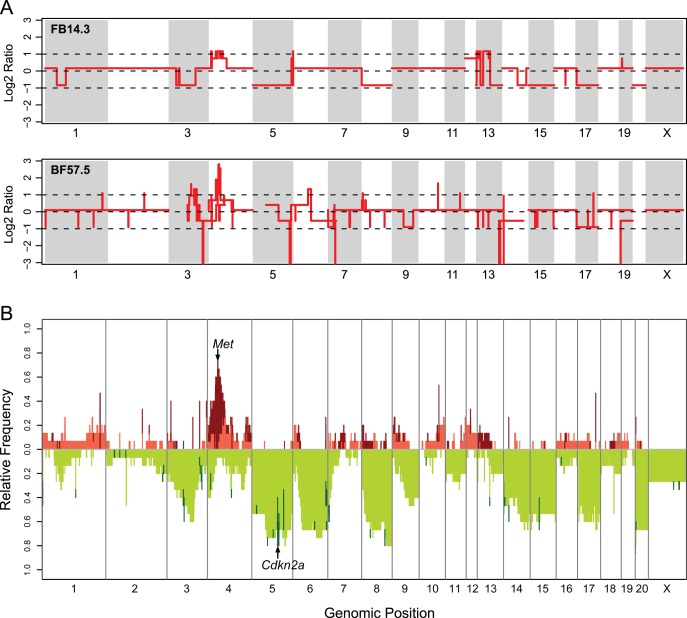
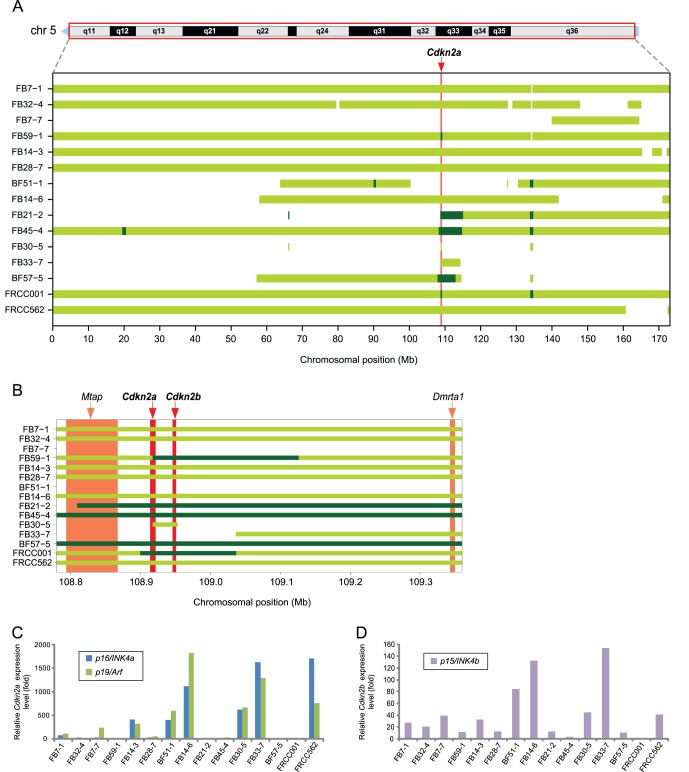
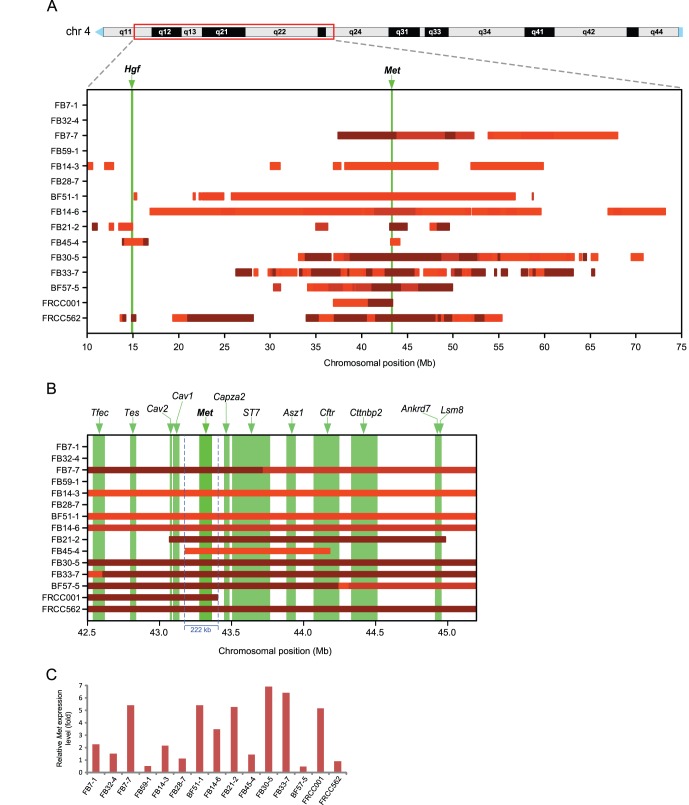
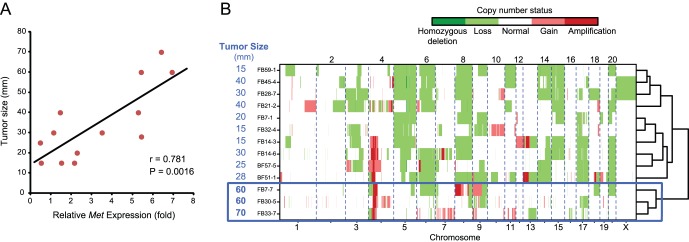
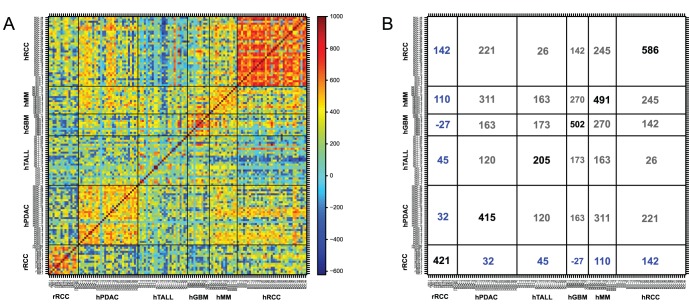
Iron overload has been associated with carcinogenesis in humans. Intraperitoneal administration of ferric nitrilotriacetate initiates a Fenton reaction in renal proximal tubules of rodents that ultimately leads to a high incidence of renal cell carcinoma (RCC) after repeated treatments. We performed high-resolution microarray comparative genomic hybridization to identify characteristics in the genomic profiles of this oxidative stress-induced rat RCCs. The results revealed extensive large-scale genomic alterations with a preference for deletions. Deletions and amplifications were numerous and sometimes fragmented, demonstrating that a Fenton reaction is a cause of such genomic alterations in vivo. Frequency plotting indicated that two of the most commonly altered loci corresponded to a Cdkn2a/2b deletion and a Met amplification. Tumor sizes were proportionally associated with Met expression and/or amplification, and clustering analysis confirmed our results. Furthermore, we developed a procedure to compare whole genomic patterns of the copy number alterations among different species based on chromosomal syntenic relationship. Patterns of the rat RCCs showed the strongest similarity to the human RCCs among five types of human cancers, followed by human malignant mesothelioma, an iron overload-associated cancer. Therefore, an iron-dependent Fenton chemical reaction causes large-scale genomic alterations during carcinogenesis, which may result in distinct genomic profiles. Based on the characteristics of extensive genome alterations in human cancer, our results suggest that this chemical reaction may play a major role during human carcinogenesis.


Conflict of interest statement

Competing Interests: The authors have declared that no competing interests exist.

Figures

Figure 1
Figure 1. Genome-wide views of DNA copy number alterations in Fe-NTA induced rat renal cell carcinomas (RCCs).
(A) Representative array-based CGH profiles from two RCC tumors. The red lines show log2 ratios of the estimated copy number over the inferred cancer ploidy versus the genomic position for all of the CGH microarray probes. (B) Frequency distribution of copy number aberrations across the whole rat genome. The relative frequencies of amplification (dark red), gain (tomato), loss (green yellow) and homozygous deletion (dark green) within 13 RCC tumors and two RCC cell lines are plotted at each genomic position. Two cancer-related loci, Met and Cdkn2a, which were most frequently affected by copy number aberration are indicated by the arrows.
Figure 2
Figure 2. Frequent extensive chromosomal losses in rat chromosome 5, and homozygous deletions at the region including the Cdkn2a and Cdkn2b loci.
(A) The bar chart represents the regions of chromosomal loss (green yellow) and homozygous deletion (dark green) along chromosome 5 for 13 RCC tumors and two RCC cell lines. The vertical red line on the background indicates the position of the Cdkn2a locus. (B) Magnified view of the bar chart centered on the Cdkn2a/2b loci. The genomic regions of all of the RefSeq genes included in the displayed range of the chromosome are depicted as vertical bars on the background. (C) Expression analysis of Cdkn2a (p16Ink4a and p19Arf) for 13 RCC tumors and two RCC cell lines, using real-time PCR with specific primer pairs for each different transcript. The values on the y-axis indicate relative mRNA expression level compared to an average of those in normal kidneys of three control rats. (D) Expression analysis of Cdkn2b (p15Ink4b) for 13 RCC tumors and two RCC cell lines by real-time PCR. The values on the y-axis indicate relative mRNA expression level compared to an average of those in normal kidneys of three control rats.
Figure 3
Figure 3. Frequent wide-ranging amplifications over a long pericentromeric region of chromosome 4 with the Met oncogene residing in the most overlapping section.
(A) The bar chart represents the amplification regions along a 65 Mb pericentrometic region of chromosome 4 for 13 RCC tumors and two RCC cell lines. Four grades of amplification are indicated by bar color gradation; the darker the red, the larger the amplitude. (B) A magnified view of the bar chart above shows the vicinity of the most overlapping region. The genomic regions of all of the RefSeq genes included in the displayed range of the chromosome are depicted as vertical bars in the background. (C) Expression analysis of Met for 13 RCC tumors and two RCC cell lines by real-time PCR. The values on the y-axis indicate relative mRNA expression level compared to an average of those in normal kidneys of three control rats.
Figure 4
Figure 4. Tumor sizes of Fe-NTA induced RCCs are controlled by the genetic features.
(A) Met expression is significantly correlated with tumor size. Pearson’s correlation coefficient (r) and the corresponding P value are written on the plot area. (B) Hierarchical clustering of the RCC tumors based on the whole genome patterns of the copy number changes. The large-size tumors form a distinct cluster.
Figure 5
Figure 5. Comparison of copy number alteration profiles in cancer genomes between Fe-NTA-induced rat RCCs and human tumors.
(A) The color plot represents a similarity matrix across the rat RCCs and various human cancers. rRCC, rat renal cell carcinoma; hPDAC, human pancreatic ductal adenocarcinoma; hTALL, human T-cell acute lymphoblastic leukemia; hGBM, human glioblastoma multiforme; hRCC, human renal cell carcinoma. (B) Numerical summary of the similarity matrix. The number in each square indicates an average value of similarity index (defined between −1000 and 1,000). Refer to the Materials and Methods section for details.

References

    1. Weinberg RA (2007) The biology of cancer. New York: Garland Science, Tailor & Francis Group, LLC.
    1. Klijn C, Holstege H, de Ridder J, Liu X, Reinders M, et al. (2008) Identification of cancer genes using a statistical framework for multiexperiment analysis of nondiscretized array CGH data. Nucleic Acids Res 36: e13. - PMC - PubMed
    1. Parsons DW, Jones S, Zhang X, Lin JC, Leary RJ, et al. (2008) An integrated genomic analysis of human glioblastoma multiforme. Science 321: 1807–1812. - PMC - PubMed
    1. Pfeifer GP, Hainaut P (2011) Next-generation sequencing: emerging lessons on the origins of human cancer. Curr Opin Oncol 23: 62–68. - PubMed
    1. Toyokuni S (1999) Reactive oxygen species-induced molecular damage and its applicaton in pathology. PatholInt 49: 91–102. - PubMed

Publication types