. 2012;7(8):e43432.
doi: 10.1371/journal.pone.0043432. Epub 2012 Aug 29.

Transcriptome and proteome dynamics of a light-dark synchronized bacterial cell cycle

Affiliations

Transcriptome and proteome dynamics of a light-dark synchronized bacterial cell cycle

Jacob R Waldbauer et al. PLoS One. 2012.

Abstract

Background: Growth of the ocean's most abundant primary producer, the cyanobacterium Prochlorococcus, is tightly synchronized to the natural 24-hour light-dark cycle. We sought to quantify the relationship between transcriptome and proteome dynamics that underlie this obligate photoautotroph's highly choreographed response to the daily oscillation in energy supply.

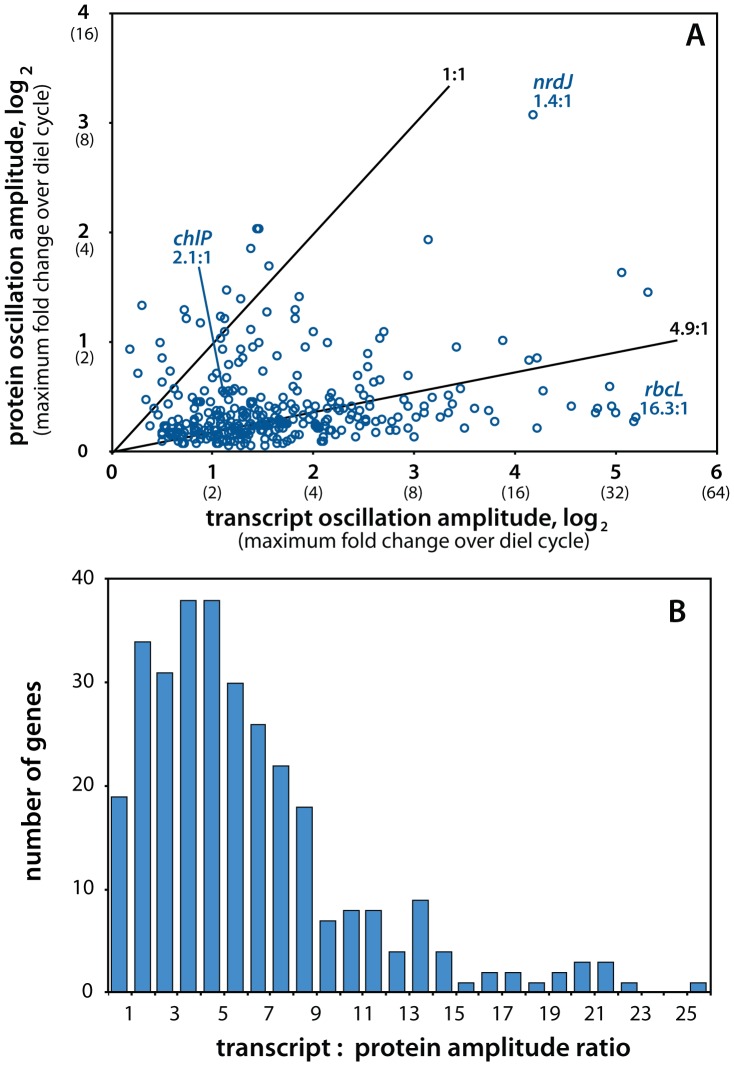
Methodology/principal findings: Using RNA-sequencing transcriptomics and mass spectrometry-based quantitative proteomics, we measured timecourses of paired mRNA-protein abundances for 312 genes every 2 hours over a light-dark cycle. These temporal expression patterns reveal strong oscillations in transcript abundance that are broadly damped at the protein level, with mRNA levels varying on average 2.3 times more than the corresponding protein. The single strongest observed protein-level oscillation is in a ribonucleotide reductase, which may reflect a defense strategy against phage infection. The peak in abundance of most proteins also lags that of their transcript by 2-8 hours, and the two are completely antiphase for some genes. While abundant antisense RNA was detected, it apparently does not account for the observed divergences between expression levels. The redirection of flux through central carbon metabolism from daytime carbon fixation to nighttime respiration is associated with quite small changes in relative enzyme abundances.

Conclusions/significance: Our results indicate that expression responses to periodic stimuli that are common in natural ecosystems (such as the diel cycle) can diverge significantly between the mRNA and protein levels. Protein expression patterns that are distinct from those of cognate mRNA have implications for the interpretation of transcriptome and metatranscriptome data in terms of cellular metabolism and its biogeochemical impact.


Conflict of interest statement

Competing Interests: The authors have declared that no competing interests exist.

Figures

Figure 1
Figure 1. Diel cell growth and cycling.
A Growth of the Prochlorococcus MED4 culture over the diel light/dark cycle. Cell density nearly doubled over the course of the experiment, indicating that 95% of the cells had divided. Local sunrise was at 0530h, and the light period lasted until sunset at 1830h. The simulated natural irradiance curve of the incubator was based on data from irradiance measurements at the Hawaii Ocean Time-series station ALOHA. Sampling for transcript and protein abundance measurements was performed every 2 hours over a 26-hour period. B Proportion of cells in different cell cycle phases over the diel period, as determined by DNA staining and flow cytometry. Cells are in B/G1 phase in the predawn through midday, then chromosome replication (C/S phase) begins, peaking just before sunset. Cell division (D/G2+M phase) begins around sunset and is mostly complete by midnight.
Figure 2
Figure 2. Example protein-transcript relationships.
Paired mRNA-protein timecourses over the diel cell cycle, illustrating the variety of relationships seen between transcripts and proteins. Gene product abundances are plotted on a log2-transformed scale (i.e., each unit reflects a 2-fold change in abundance). The key parameters of the expression oscillations explored here – the amplitude of oscillation and its temporal phasing – are indicated at right. Where error bars are not shown, they are smaller than the symbol size. A Ribonucleotide reductase nrdJ, a DNA synthesis enzyme. B The large subunit of Rubisco rbcL, which fixes CO2 into 3-phosphoglycerate in the Calvin cycle. C Geranylgeranyl diphosphate reductase chlP, a chlorophyll biosynthesis protein. Note that even though the peak of ChlP protein abundance (near 0200h) occurs before that of its mRNA (at 1400h), the protein-transcript lag is still taken to be positive, since the protein maximum is taken to follow the transcript peak from the previous diel cycle.
Figure 3
Figure 3. Amplitudes of mRNA and protein oscillations.
A Comparison of abundance oscillation amplitudes at the transcript and protein levels for the 312 paired expression timecourses. If mRNA and proteins underwent oscillations of the same magnitude, data would plot along the 1∶1 line. The observed median ratio between transcript and protein amplitudes was 4.9∶1 in log2-units, or 2.3-fold greater amplitude at the mRNA level. The three genes shown in Fig. 2, and their amplitude ratios, are indicated. B Histogram of transcript-protein amplitude ratios for the 312-gene dataset. For 293 genes (94%) the protein amplitude was damped relative to the corresponding transcript (amplitude ratio >1).
Figure 4
Figure 4. Phasing of mRNA and protein oscillations.
A Comparison of the phases (i.e., times of peak abundance) of transcripts and proteins for the 312 paired expression timecourses. If oscillations in mRNA and protein abundances were essentially synchronous, most of the data would plot along the main diagonal, within the ±2-hour window that we consider ‘in phase’ based on our sampling resolution. Genes plotting off the in-phase diagonal have progressively longer lag times between protein and trancript oscillations, as indicated by the parallel dotted lines. The three genes shown in Fig. 2, as well as their protein-transcript lag times, are indicated. B Histogram of protein-transcript lag times for the 312-gene dataset. Antiphase genes have transcript and protein oscillations offset by close to half of the 24-hour diel cell cycle.
Figure 5
Figure 5. Gene product dynamics of central carbon metabolism.
The Calvin cycle-pentose phosphate superpathway of carbon metabolism in Prochlorococcus. For each gene, the mRNA and protein timecourse data (and sinusoidal fits to them) are shown. The values of the phase and amplitude of oscillations at both expression levels are given in Table S3. Genes for which timecourses are not shown were either not detected in the proteome or not measurably oscillating in our experiment; note that cbbA, glpX and tktA catalyze multiple reactions. The Calvin cycle consumes CO2 and trades reducing power for fixed carbon, while the pentose phosphate pathway does the reverse; reactions in the shared intersection reverse direction depending on the net metabolic flux. The Calvin cycle is the dominant pathway in the light period, when photosynthesis supplies NADPH for carbon fixation. Calvin cycle genes peak near dawn at the mRNA level, and near midday at the protein level. The pentose phosphate pathway is dominant at night, when stores of carbon fixed during the day are respired. Transcripts of pentose phosphate pathway genes peak in the late afternoon, and their proteins after sunset. Genes of the shared intersection show cycling parameters akin to those of the Calvin cycle. For all genes of this superpathway, however, the amplitudes of protein abundance oscillation are much smaller than those of the corresponding mRNA, implying that this redirection of the net flow in this superpathway between light and dark periods is controlled by small changes in protein abundance and posttranslational regulation. Pathway schematic redrawn after .

References

    1. Crick F (1970) Central dogma of molecular biology. Nature 227: 561–563. - PubMed
    1. Picard F, Dressaire C, Girbal L, Cocaign-Bousquet M (2009) Examination of post-transcriptional regulations in prokaryotes by integrative biology. Comptes rendus biologies 332: 958–973. - PubMed
    1. Evguenieva-Hackenberg E, Klug G (2011) New aspects of RNA processing in prokaryotes. Current Opinion in Microbiology 14: 587–592. - PubMed
    1. Lee PS, Shaw LB, Choe LH, Mehra A, Hatzimanikatis V, et al. (2003) Insights into the relation between mrna and protein expression patterns: II. Experimental observations in Escherichia coli . Biotechnology and bioengineering 84: 834–841. - PubMed
    1. Kramer G, Sprenger RR, Nessen MA, Roseboom W, Speijer D, et al. (2010) Proteome-wide alterations in Escherichia coli translation rates upon anaerobiosis. Molecular & cellular proteomics 9: 2508–2516. - PMC - PubMed

Publication types