. 2012;7(8):e43602.
doi: 10.1371/journal.pone.0043602. Epub 2012 Aug 30.

Early reduction of microglia activation by irradiation in a model of chronic glaucoma

Affiliations

Early reduction of microglia activation by irradiation in a model of chronic glaucoma

Alejandra Bosco et al. PLoS One. 2012.

Abstract

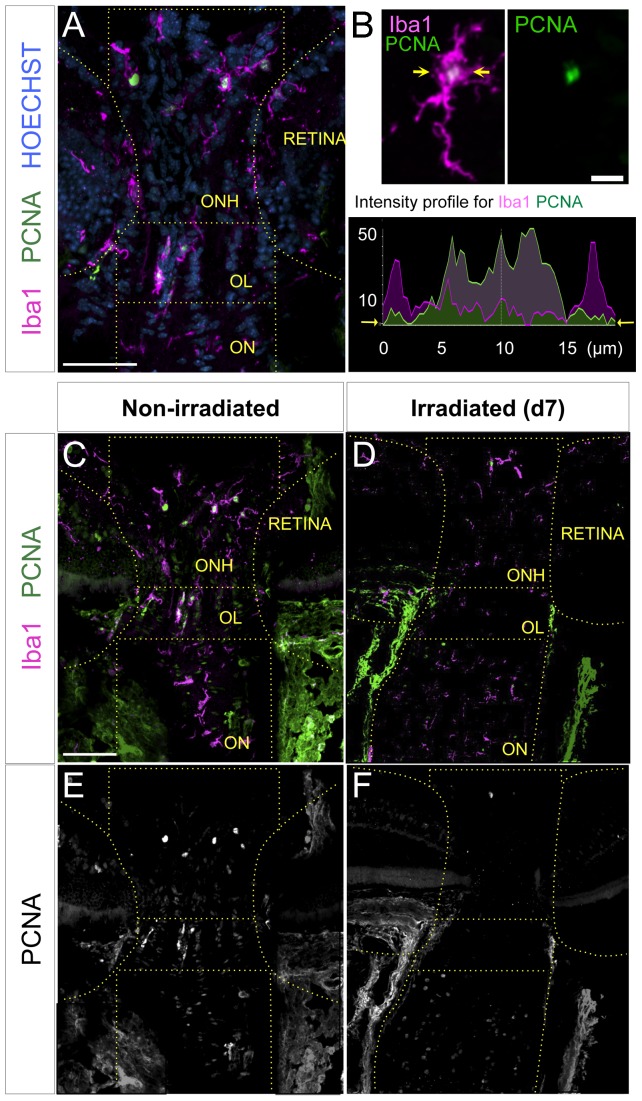
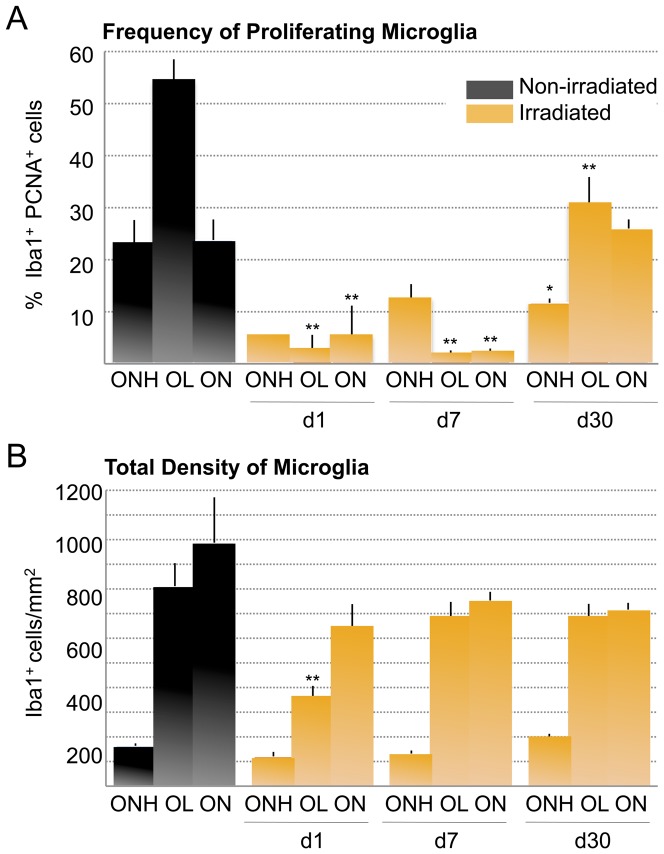
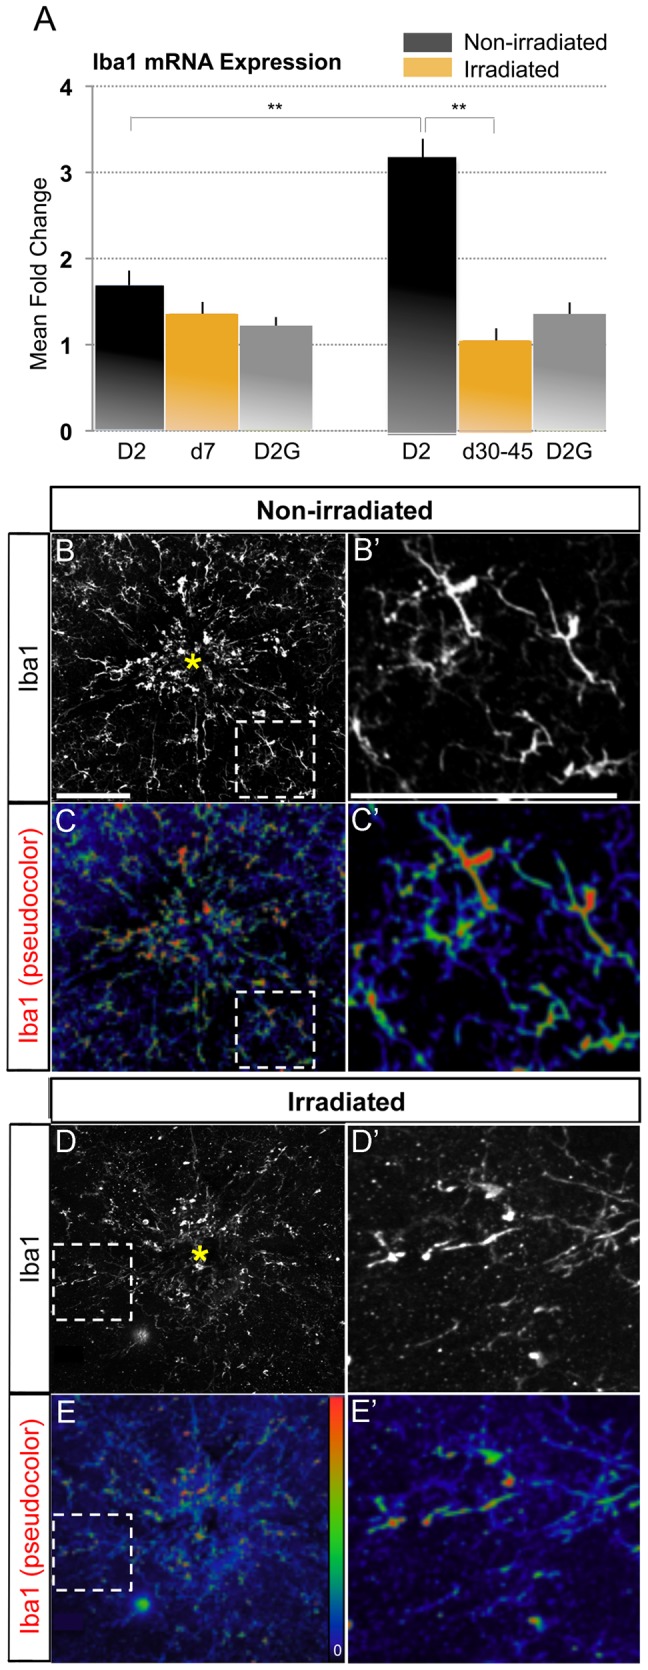
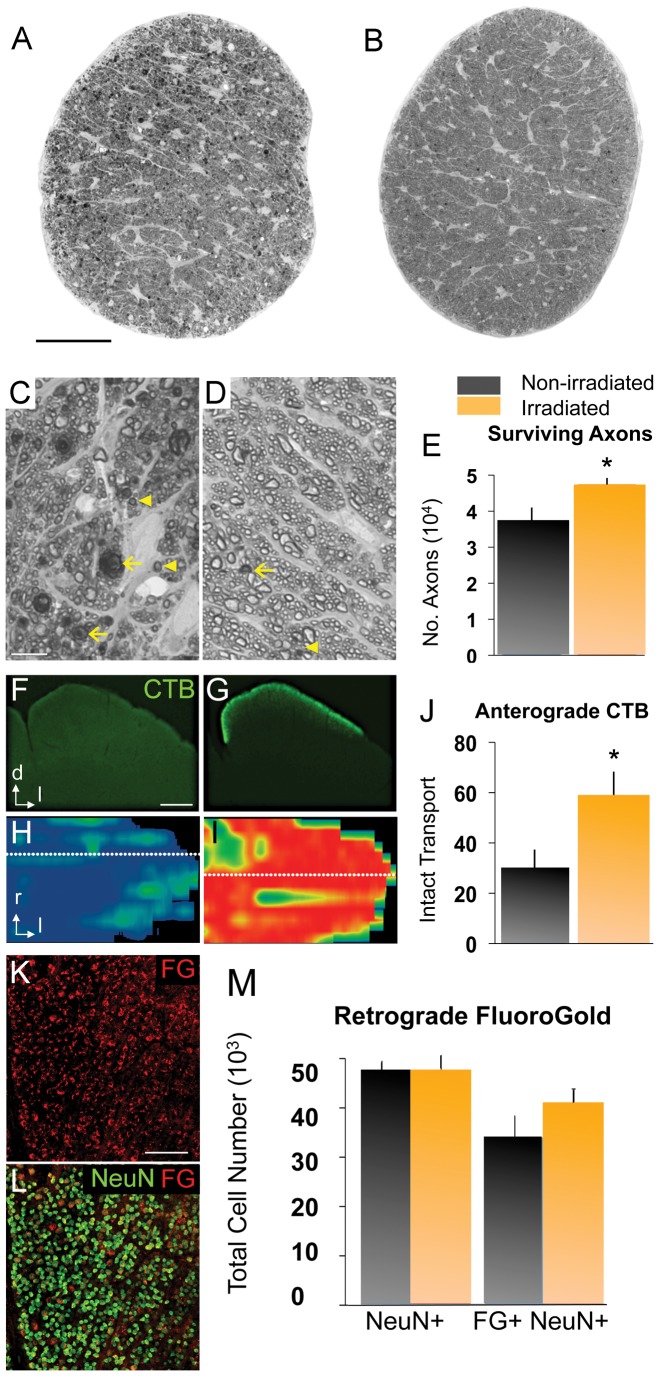
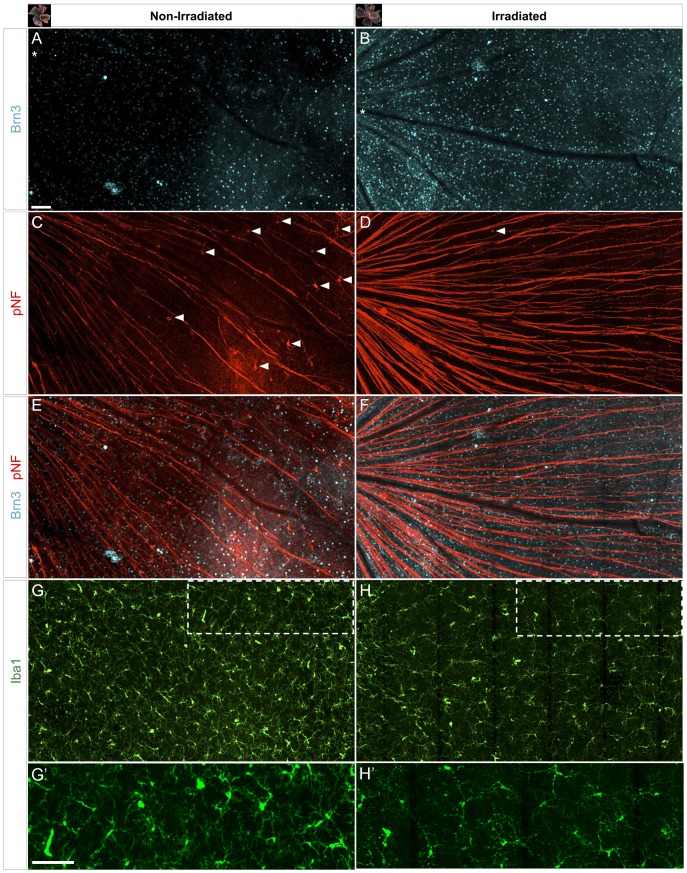
Glaucoma is a neurodegenerative disease that results in the progressive decline and ultimate death of retinal ganglion cells (RGCs). While multiple risk factors are associated with glaucoma, the mechanisms leading to onset and progression of the disease remain unknown. Molecular analysis in various glaucoma models has revealed involvement of non-neuronal cell populations, including astrocytes, Mueller glia and microglia, at early stages of glaucoma. High-dose irradiation was reported to have a significant long-term protective effect in the DBA/2J (D2) mouse model of glaucoma, although the cellular and molecular basis for this effect remains unclear. In particular, the acute effects of irradiation on specific cell populations, including non-neuronal cells, in the D2 retina and nerve have not been assessed. Here we report that irradiation induces transient reduction in proliferating microglia within the optic nerve head and glial lamina within the first week post-irradiation. This was accompanied by reduced microglial activation, with no effect on astrocyte gliosis in those regions. At later stages we confirm that early high-dose irradiation of the mouse head results in improvement of axonal structural integrity and anterograde transport function, without reduction of intraocular pressure. Thus reduced microglial activation induced by irradiation at early stages is associated with reduced optic nerve and retinal neurodegeneration in the D2 mouse model of glaucoma.


Conflict of interest statement

Competing Interests: The authors have declared that no competing interests exist.

Figures

Figure 1
Figure 1. Irradiation results in depletion of proliferative microglia within the proximal optic nerve regions.
(A) Iba1-positive cells with and without nuclear expression of the proliferative marker (PCNA) were detected in radial sections along the ONH, OL and proximal ON (delineated) shown in a single 1 µm optical slice. (B) Overlay of Iba1 and PCNA, plus single-channel view for PCNA. Scale bar represents 10 µm. The colocalization of Iba1 and PCNA to individual cells was confirmed by tracing their linear intensity profiles in single optical slices (between the arrows). Cycling microglial cells were positively identified by the nuclear localization of PCNA expression within the cytoplasmic Iba1 expression (graph). (C, E) Non-irradiated D2 mice show concentration of proliferating microglia within the unmyelinated ONH and OL, shown in a maximal Z-projection. Cycling microglia have a green or white nucleus in the overlay view of Iba1 and PCNA stainings, which is shown as single PCNA-channel for clarity. (D, F) 7 days (d7) after irradiation microglia proliferation appears negligible along the proximal nerve, as shown in a maximal Z-projection. Scale bars, 100 µm.
Figure 2
Figure 2. Irradiation reduces microgliosis in the unmyelinated optic nerve.
Quantification of the proportion of cycling microglial cells (PCNA and Iba1-positive) per optic nerve compartment in non-irradiated and irradiated D2 mice (n = 6 samples per timepoint and experimental group). The statistical significance indicated for each compartment and timepoint is relative to non-irradiated controls. (A) In non-irradiated D2 mice aged 4 to 6 weeks, the proportion of proliferating microglia is ∼50% within the OL, and ∼25% within the ONH and ON. At 1 day and 7 days after irradiation, numbers of cycling microglia are reduced in all optic nerve portions, with maximal reduction within the OL (p<0.001), and with significant effect in the ONH and proximal ON (p<0.01). 30 days post-treatment the unmyelinated ONH and OL compartments have recovered only half of its original proliferating microglia, whereas the proximal ON has been repopulated. (B) Total number of Iba1-positive microglia (per area) within each optic nerve compartment. The density of total microglia demonstrates that irradiation has an acute and specific effect on cycling microglia resident within the OL (p<0.01).
Figure 3
Figure 3. Irradiation reduced early microglia activation within the central retina and proximal optic nerve compartments.
(A) Quantitative RT-PCR analysis of Iba1 transcript in a sample including the central 100 µm of retina, ONH, OL and proximal 200 µm of myelinated optic nerve, collected from non-irradiated D2 and non-glaucoma D2G, and irradiated D2 mice (n = 10 per group and age). 7 days post-irradiation there are comparable levels of Iba1 expression as in age-matched non-irradiated D2 or D2G samples. 30 to 45 days after irradiation Iba1 expression is significantly lower than the elevated levels of expression seen in non-irradiated D2 tissue at this age (p<0.01), and is comparable to levels of Iba1 expression in age-matched non-glaucoma D2G mice. (B, C) Representative retinal wholemounts from non-irradiated and irradiated D2 mice at 3 months of age show clustering of large, activated microglia with high Iba1 expression within the central retina and optic disc (yellow asterisk) in non-irradiated conditions. In age-matched irradiated mice few high-Iba1 expressing microglia are detectable, and display little clustering. (D, E) In non-irradiated D2 retinas, Iba1 expression (pseudocolor code indicated as inset bar) is highly upregulated in the microglial cells concentrated at the optic disc, while only few cells show high expression levels in untreated D2. (B'–E') High magnification views of framed areas shown in B–E. Scale bars, 100 µm.
Figure 4
Figure 4. Head irradiation protects D2 mice from optic nerve degeneration.
(A, B) Optic nerve cross-sections stained with PPD, from naïve (11 mo old) and irradiated (12 mo old) D2 mice. Scale bar, 250 µm. (C, D) Higher magnification view of the same nerves. Scale bar, 10 µm. (C) Non-irradiated D2 nerves show abundant degenerating axon profiles with dark, condensed axoplasm (arrowheads) and disorganized myelin sheaths (arrows), as well as extensive gliosis. (D) Irradiated D2 nerves mostly show healthy axons with clear axoplasm and uniform myelin sheaths, and rare degenerating profiles (arrows). (E) Total optic axon counts from irradiated D2 nerves (n = 29; 12 mo old) show a significant increase in mean axon number compared to non-irradiated D2 mice (n = 16; 10 and 11 mo old; p<0.01). (F–J) The anterograde transport of CTB by RGC axons from the retina to the superior colliculus (SC) was measured in non-irradiated (n = 16; 10 and 11 mo old) and irradiated D2 mice (n = 17; 12 mo old). (F) Non-irradiated D2 mice (11 mo old) showed severe loss of CTB signal, as seen in coronal section of the SC (dorsal, d; lateral, l). Scale bar, 500 µm. (G) Irradiated D2 mice (12 mo old) showed persistent CTB transport to the superficial layers of the SC. (H, I) Reconstruction of the retinotopic SC map, showing the density of CTB signal (red, green and blue indicate 100, 50 and 0% density, respectively). Dotted lines indicate location of sections shown in F and G; rostral, r; lateral, l. (H) Non-irradiated D2 mice showed near total CTB depletion. (I) Irradiated D2 mice showed almost complete CTB label and a normal retinotopic pattern. (J) Irradiation significantly protected axonal anterograde transport in D2 optic nerves (p<0.05). K) Flat-mount of an irradiated D2 retina at 9 mo of age showing FG labeled cells (red). L) Most NeuN+ RGCs (green) in this retina are retrogradely labeled with FG (red). Scale bar, 100 µm. M) Quantitative stereology of both NeuN+ RGCs and FG+/NeuN+ RGCs in flat-mounted retinas. Non-irradiated retinas (dark bars, n = 8; 9–10 mo old) and irradiated retinas (yellow bars, n = 8; 9–10 mo old) showed no differences in the total number of NeuN+ RGCs per retina between treatments, but slightly more retrogradely labeled FG+ RGCs in the irradiated retinas. Error bars = SEM.
Figure 5
Figure 5. Irradiation reduces RGC decline and microglia activation within the retina.
Confocal images of triple-immunostained (Brn3, pNF and Iba1) flat-mounted retinas from non-irradiated (11 mo old) and irradiated (12 mo old) D2 mice (n = 8 retinas per group). Representative fields (∼1.6×0.9 mm2) show matching position (optic disc at left of asterisks) and a projection of the NFL and GCL, from central to peripheral eccentricities. (A–B) Most of the non-irradiated retina displays low numbers of RGCs expressing Brn3, whereas irradiated mice maintain a higher density of brightly labeled RGCs. (C, D) Co-immunostaining for pNF in the same non-irradiated retina shows a reduced number of optic axons, thinner axonal bundles and defasciculated axons that show beaded profiles in their entire length. In the irradiated retina, RGC axons are organized in bundles that show a higher and uniform pNF content, and some fragmentation mostly limited to the peripheral area. Only non-irradiated retinas show abundant RGCs with somadendritic accumulation of pNF (arrowheads). (E, F) Overlay of Brn3 and pNF staining reveals the colocalization of declining axons and sparse Brn3-positive RGCs in the non-irradiated D2 retina, in contrast to healthier, fasciculated axons in the irradiated mice. (G, H) Reflecting the abnormalities shown by the RGC markers, microglia (Iba1) had altered tiling around RGC axons and variable, increased density in non-irradiated retinas. Activated microglia, recognizable by their enlarged somata and reduced branching, were abundant in the non-irradiated retina, and infrequent in the irradiated ones. (G', H') High magnification views of framed areas shown in G, H. Scale bars, 100 µm.

References

    1. Quigley HA, Broman AT (2006) The number of people with glaucoma worldwide in 2010 and 2020. Br J Ophthalmol 90: 262–267. - PMC - PubMed
    1. Sommer A (1996) Glaucoma risk factors observed in the Baltimore Eye Survey. Current opinion in ophthalmology 7: 93–98. - PubMed
    1. Gupta N, Yucel YH (2007) Glaucoma as a neurodegenerative disease. Curr Opin Ophthalmol 18: 110–114. - PubMed
    1. Burgoyne CF (2011) A biomechanical paradigm for axonal insult within the optic nerve head in aging and glaucoma. Experimental eye research 93: 120–132. - PMC - PubMed
    1. Crish SD, Calkins DJ (2011) Neurodegeneration in glaucoma: progression and calcium-dependent intracellular mechanisms. Neuroscience 176: 1–11. - PMC - PubMed

Publication types

MeSH terms