. 2012;7(8):e44053.
doi: 10.1371/journal.pone.0044053. Epub 2012 Aug 27.

Meal time shift disturbs circadian rhythmicity along with metabolic and behavioral alterations in mice

Affiliations

Meal time shift disturbs circadian rhythmicity along with metabolic and behavioral alterations in mice

Ji-Ae Yoon et al. PLoS One. 2012.

Abstract

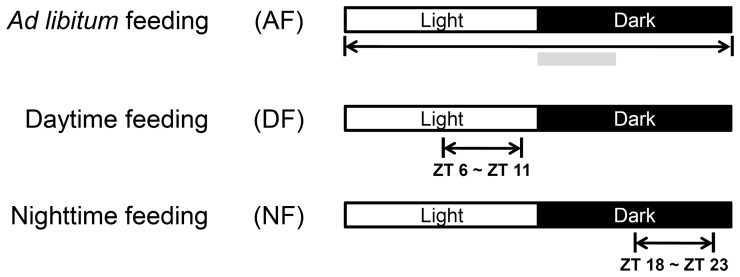
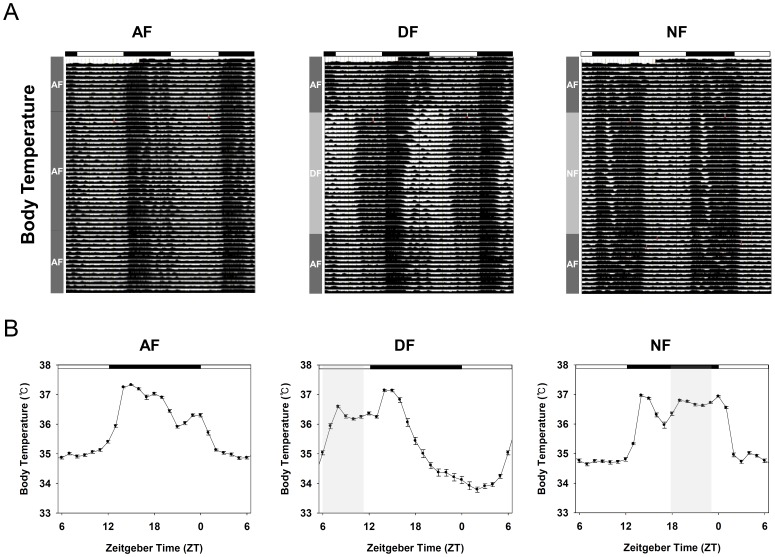
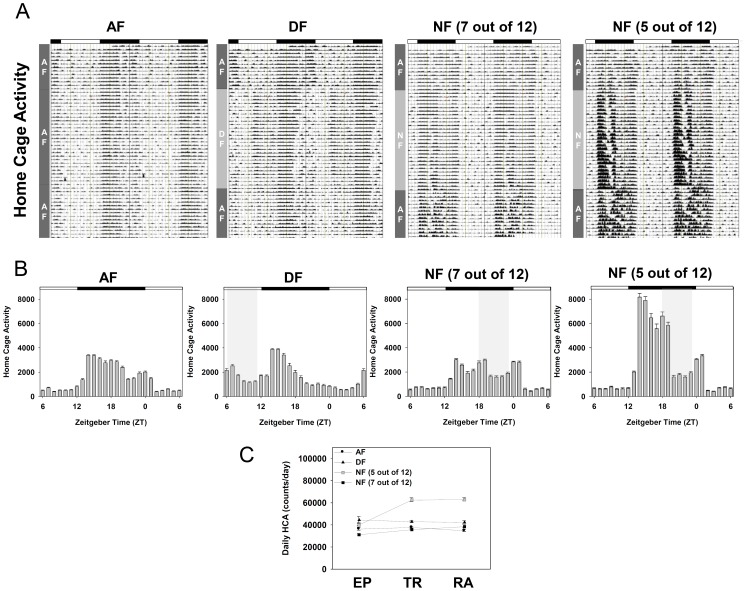
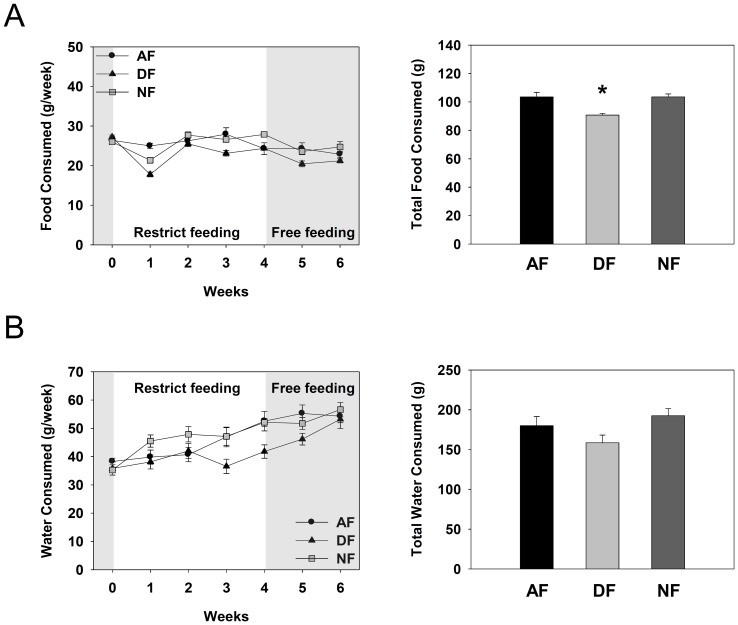
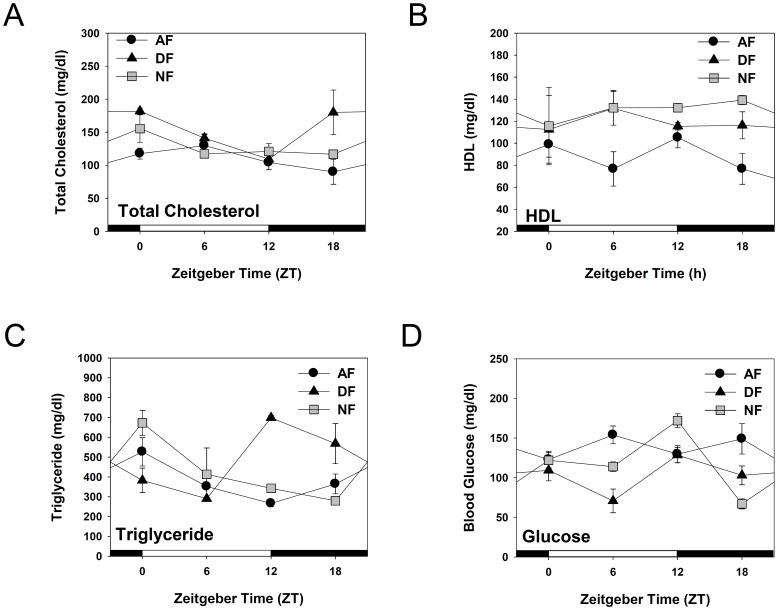
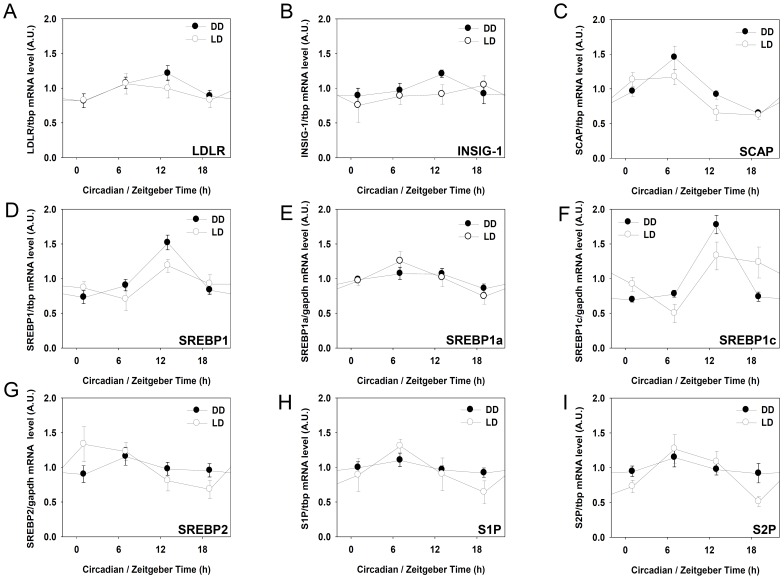
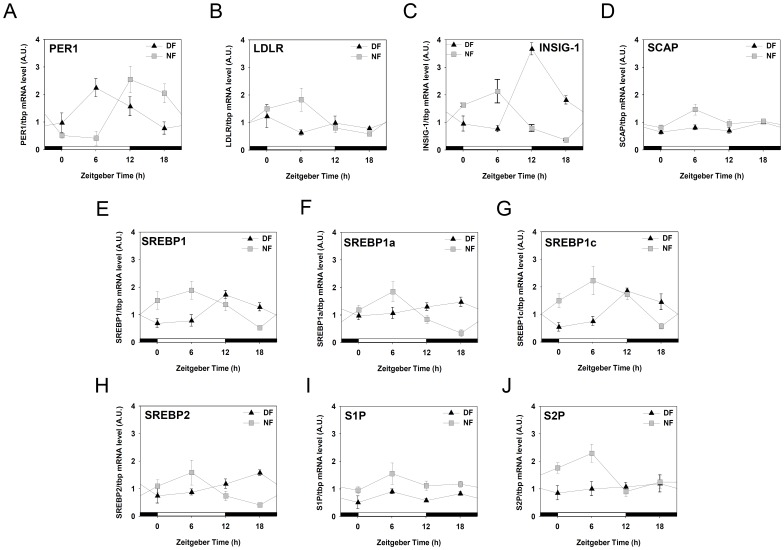
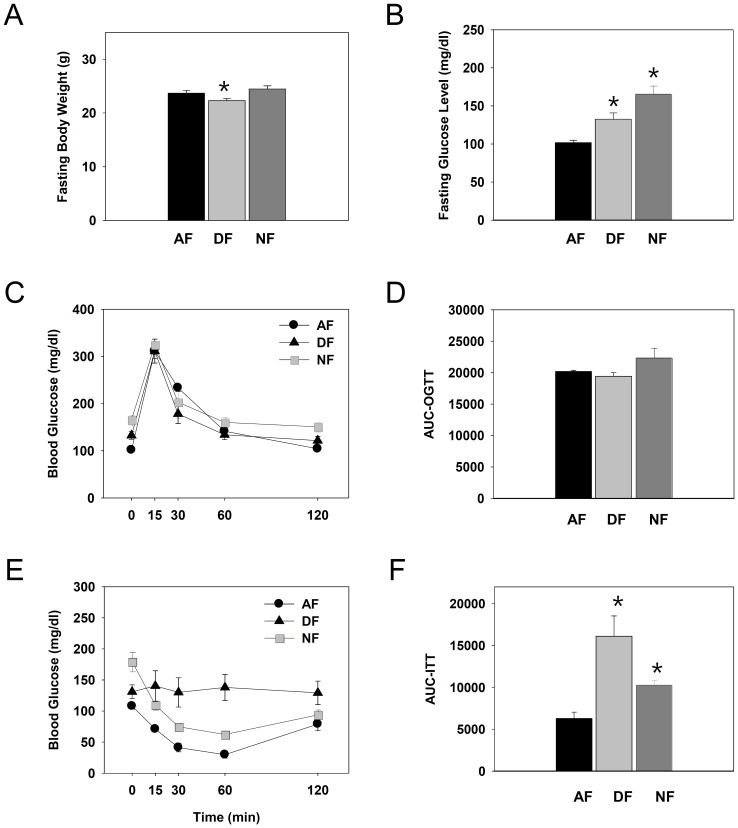
In modern society, growing numbers of people are engaged in various forms of shift works or trans-meridian travels. Such circadian misalignment is known to disturb endogenous diurnal rhythms, which may lead to harmful physiological consequences including metabolic syndrome, obesity, cancer, cardiovascular disorders, and gastric disorders as well as other physical and mental disorders. However, the precise mechanism(s) underlying these changes are yet unclear. The present work, therefore examined the effects of 6 h advance or delay of usual meal time on diurnal rhythmicities in home cage activity (HCA), body temperature (BT), blood metabolic markers, glucose homeostasis, and expression of genes that are involved in cholesterol homeostasis by feeding young adult male mice in a time-restrictive manner. Delay of meal time caused locomotive hyperactivity in a significant portion (42%) of subjects, while 6 h advance caused a torpor-like symptom during the late scotophase. Accordingly, daily rhythms of blood glucose and triglyceride were differentially affected by time-restrictive feeding regimen with concurrent metabolic alterations. Along with these physiological changes, time-restrictive feeding also influenced the circadian expression patterns of low density lipoprotein receptor (LDLR) as well as most LDLR regulatory factors. Strikingly, chronic advance of meal time induced insulin resistance, while chronic delay significantly elevated blood glucose levels. Taken together, our findings indicate that persistent shifts in usual meal time impact the diurnal rhythms of carbohydrate and lipid metabolisms in addition to HCA and BT, thereby posing critical implications for the health and diseases of shift workers.


Conflict of interest statement

Competing Interests: The authors have declared that no competing interests exist.

Figures

Figure 1
Figure 1. Experimental scheme.
Young adult C57BL/6J male mice (8 weeks old) were first entrained to a 12∶12 LD photoperiodic cycle for two weeks with food and water available ad libitum. Then mice were randomly divided into three groups: food available ad libitum (AF), food available during the late day (ZT 6 to 11) (DF), and food available during the late night (ZT 18 to 23) (NF) with water available all the time. This time-restrictive feeding regimen was maintained either up to the end of each experiment or for 4 weeks and then returned to ad libitum feeding (Figure 2 and 3). Gray bar indicates major meal time of normal adult mouse (Figure S1A).
Figure 2
Figure 2. Daily rhythms of body temperature in young adult male mice under time-restrictive feeding regimen.
Young adult male mice, surgically implanted with E-mitter probes, were first entrained to a 12∶12 LD photoperiodic cycle for two weeks with food and water available ad libitum. Then mice were fed time-restrictively as schematized in Figure 1 for 4 weeks and returned to being fed ad libitum. Body temperature (BT) was continuously recorded for 7 subsequent weeks (See M&M). (A) Representative double-plot actograms of BT in AF, DF, and NF mice. Dark rectangles above the actograms indicate the 12 h scotophase maintained throughout the experiment. (B) Daily patterns of BT during the time-restrictive feeding. To generate the daily pattern of BT, monitoring results for the whole time-restrictive period were averaged as 1 h bins and the resulting 28 day profiles were pooled according to the indicated ZT to generate the averaged daily pattern (mean ± S.E.M.). Statistical analyses are summarized in Table 1.
Figure 3
Figure 3. Daily rhythms of home cage activity in young adult male mice under time-restrictive feeding regimen.
Young adult male mice, surgically implanted with E-mitter probes, were first entrained to a 12∶12 LD photoperiodic cycle for two weeks with food and water available ad libitum. Then mice were fed time-restrictively as schematized in Figure 1 for 4 weeks and returned to being fed ad libitum. Home cage activity (HCA) was continuously recorded for 7 subsequent weeks (See M&M). (A) Representative double-plot actograms of HCA in AF, DF, and NF mice. Dark rectangles above the actograms indicate the 12 h scotophase maintained throughout the experiment. (B) Daily patterns of HCA during the time-restrictive feeding. To generate the daily pattern of HCA, monitoring results for the whole time-restrictive period were summed up as 1 h bins and the resulting 28 day profiles were pooled according to the indicated ZT to generate the averaged daily pattern (mean ± S.E.M.). Statistical analyses are summarized in Table 1. (C) Changes in daily HCA during the weeks of entrainment period (EP), 4 weeks of time-restrictive feeding (TR) and when returned to ad libitum feeding for 2 weeks (RA).
Figure 4
Figure 4. Weekly food and water consumption profiles.
Young adult male mice were first entrained to a 12∶12 LD photoperiodic cycle for 1 week, fed time-restrictively for 4 weeks, and then fed ad libitum for 2 weeks as described in Figure 1. Weekly consumption of food and water measured regularly at the end of each week. (A) Weekly food consumption profiles during the whole experimental period (left) and total food consumption during the 4 weeks of time restrictive feeding period (right). (B) Weekly water consumption profiles during the whole experimental period (left) and total water consumption during the 4 weeks of time restrictive feeding period (right). Data are expressed as mean ± S.E.M. (n = 4), *p<0.05 vs. other groups.
Figure 5
Figure 5. Daily rhythms of blood glucose and some metabolic parameters related to cholesterol homeostasis in mice fed time-restrictively.
Young adult male C57BL/6J mice were first entrained to a 12∶12 LD photoperiodic cycle for two weeks. Then mice were fed time-restrictively for seven consecutive days as denoted in Figure 1. Mice were sacrificed by cervical dislocation at the indicated ZT and whole blood samples were collected. Total cholesterol (A), HDL cholesterol (B), plasma triglyceride (C), blood glucose (D) levels were determined by specific kits obtained from CallegariTM. All data are expressed as mean ± S.E.M. (n = 4–8). Statistical analyses are summarized in Table 2.
Figure 6
Figure 6. Daily and circadian expressions of LDLR and some LDLR regulatory factors in the mouse liver.
To determine daily expression patterns, young adult C57BL/6J male mice were entrained to a 12L:12D cycle for two weeks and liver samples were quickly obtained at the indicated ZT. For circadian sampling, mice were entrained to a 12L:12D cycle for two weeks and released to constant darkness (DD). On the second day after light-off, liver samples were obtained at the indicated circadian time (CT). RNA isolation, reverse transcription, and real-time polymerase chain reaction to measure specific messages for mouse ldlr, and LDLR regulatory factors. All mRNA levels were normalized to tbp mRNA levels. Data are expressed as mean ± S.E.M. (n = 8).
Figure 7
Figure 7. Effects of one week of time-restrictive feeding on the phases of Per1, LDLR, and LDLR regulatory factors gene expression in the mouse liver.
Young adult male mice, entrained to a 12∶12 photoperiodic cycle, were fed time-restrictively for seven consecutive days as described in Figure 1. On the 8th day, mice were sacrificed at the indicated zeitgeber time (ZT) and liver samples were obtained. RNA isolation, reverse transcription, and real-time polymerase chain reaction were performed to measure specific messages for mouse Per1, ldlr, and LDLR regulatory factors. All mRNA levels were normalized to tbp mRNA levels. Data are expressed as mean ± S.E.M. (n = 4).
Figure 8
Figure 8. Effects of chronic time-restrictive feeding on body weight, fasting blood glucose, glucose tolerance, and response to insulin.
Young adult male mice were first entrained to a 12∶12 LD photoperiodic cycle for 2 weeks and then fed time-restrictively for 9 consecutive weeks. After 16 h fasting, mice were weighed (A) and fasting glucose levels were measured (B) at the 5th week. Then oral glucose tolerance test was performed. Blood glucose levels over time in response to an oral glucose load (C) and area under the curve for OGTT (D) are shown. At the 9th week, mice were weighed after 16 h fasting, and fasting glucose levels were measured. Then insulin tolerance test was performed. Blood glucose levels over time in response to insulin (E) and area under the curve (F) were determined. All data are expressed as mean ± S.E.M. (n = 3–4), *p<0.05 vs. control AF group.

References

    1. Dunlap JC, Loros JJ, DeCoursey PJ (2004) Chronobiology: Biological Timekeeping. Sinanuer Associates Inc, Sunderland, 406p.
    1. Refinetti R (2006) Circadian Physiology, 2nd ed. Taylor & Francis, Boca Raton, 667p.
    1. Sanchez-Alavez M, Klein I, Brownell SE, Tabarean IV, Davis CN, et al. (2007) Night eating and obesity in the EP3R-deficient mouse. PNAS USA 104: 3009–3014. - PMC - PubMed
    1. Arble DM, Ramsey KM, Bass J, Turek FW (2010) Circadian disruption and metabolic disease: findings from animal models. Best Pract Res Clin Endocrinol Metab 24: 785–800. - PMC - PubMed
    1. Szosland D (2010) Shift work and metabolic syndrome, diabetes mellitus and ischaemic heart disease. Int J Occup Med Environ Health 23: 287–291. - PubMed

Publication types

MeSH terms