. 2012;7(8):e44168.
doi: 10.1371/journal.pone.0044168. Epub 2012 Aug 27.

Endoplasmic reticulum sorting and kinesin-1 command the targeting of axonal GABAB receptors

Affiliations

Endoplasmic reticulum sorting and kinesin-1 command the targeting of axonal GABAB receptors

Viviana Valdés et al. PLoS One. 2012.

Abstract

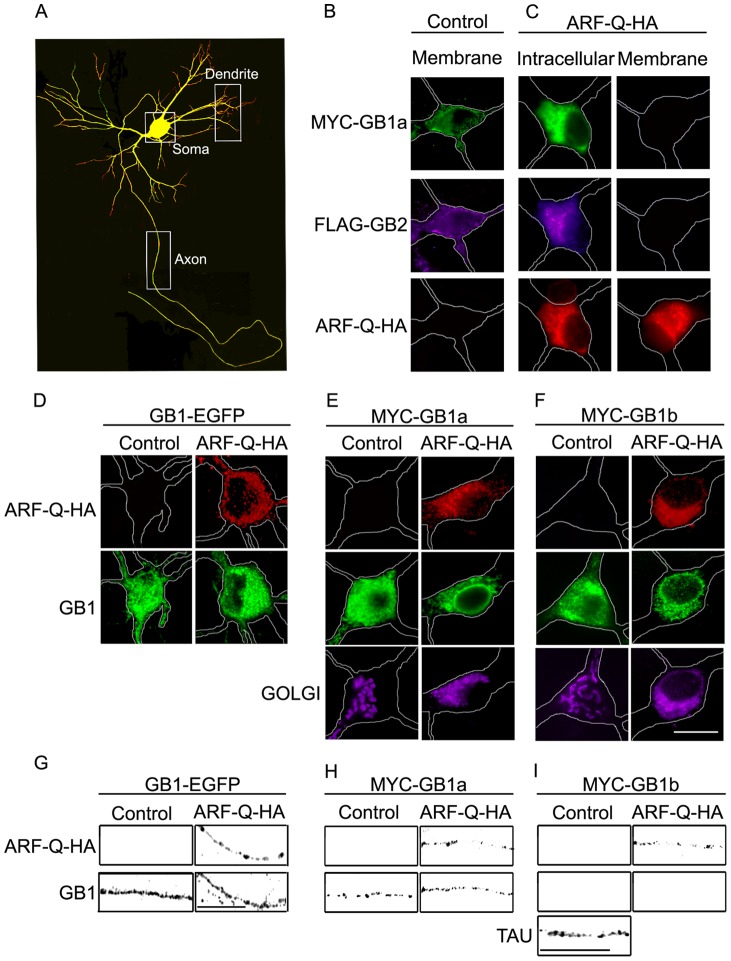
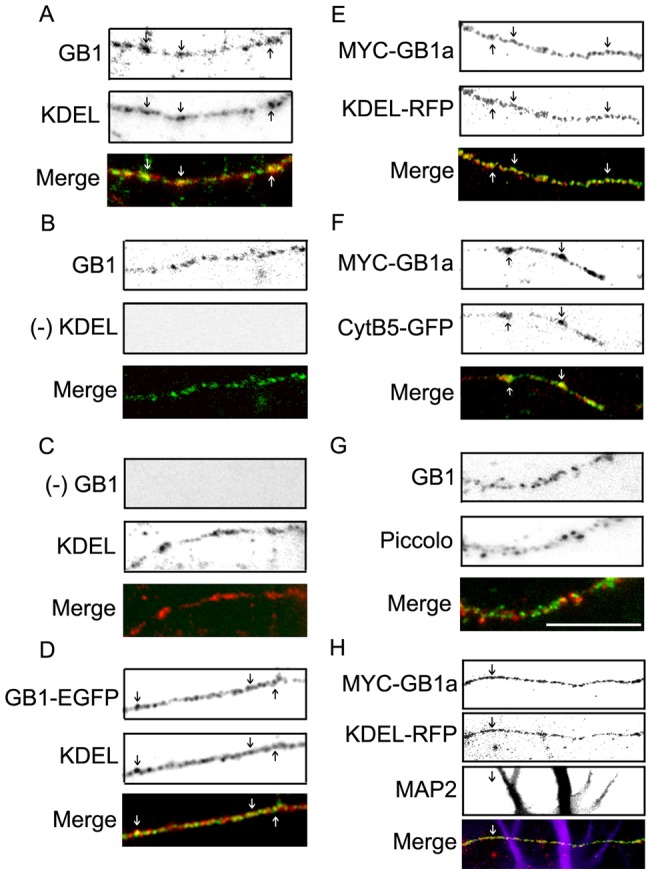
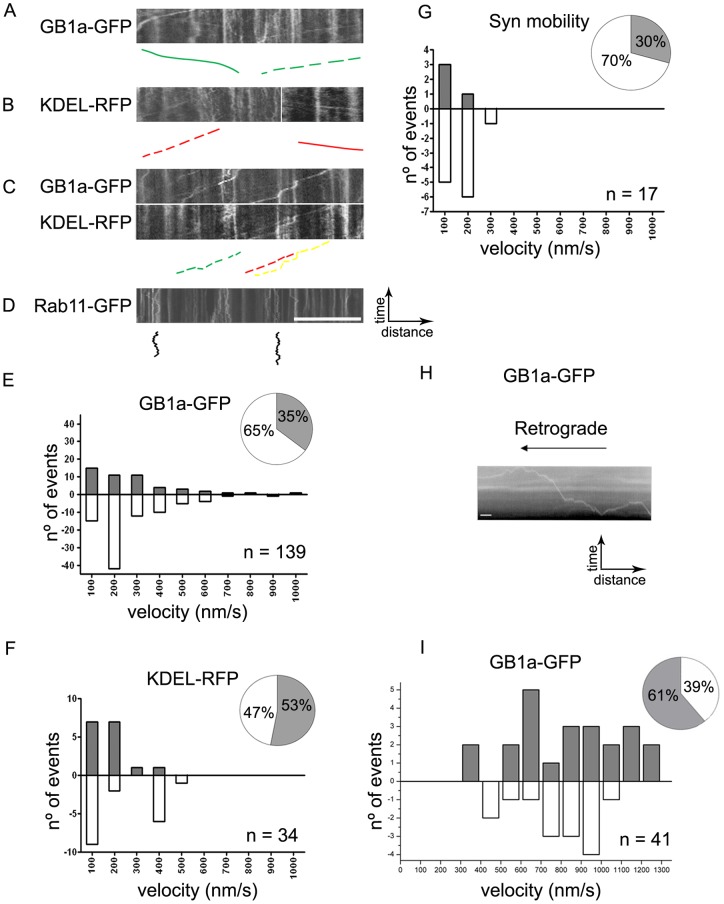
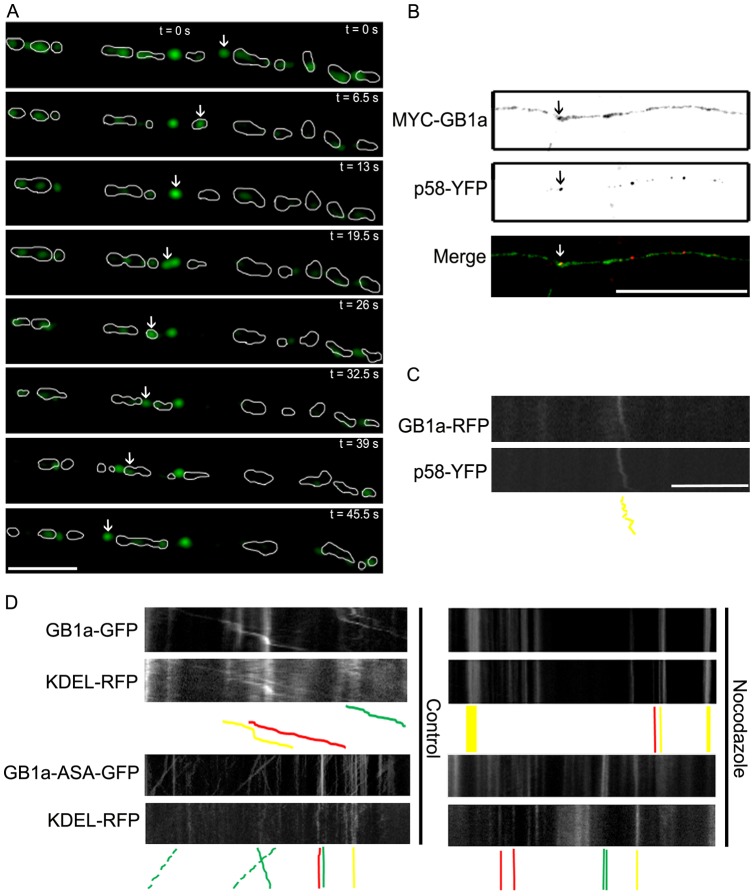
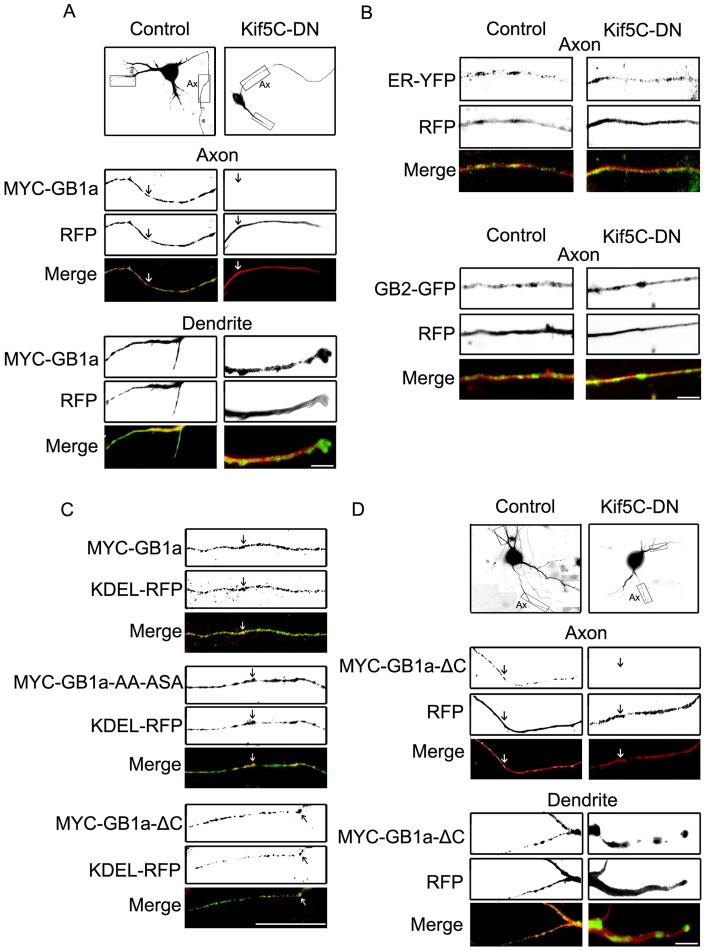
In neuronal cells the intracellular trafficking machinery controls the availability of neurotransmitter receptors at the plasma membrane, which is a critical determinant of synaptic strength. Metabotropic γ amino-butyric acid (GABA) type B receptors (GABA(B)Rs) are neurotransmitter receptors that modulate synaptic transmission by mediating the slow and prolonged responses to GABA. GABA(B)Rs are obligatory heteromers constituted by two subunits, GABA(B)R1 and GABA(B)R2. GABA(B)R1a and GABA(B)R1b are the most abundant subunit variants. GABA(B)R1b is located in the somatodendritic domain whereas GABA(B)R1a is additionally targeted to the axon. Sushi domains located at the N-terminus of GABA(B)R1a constitute the only difference between both variants and are necessary and sufficient for axonal targeting. The precise targeting machinery and the organelles involved in sorting and transport have not been described. Here we demonstrate that GABA(B)Rs require the Golgi apparatus for plasma membrane delivery but that axonal sorting and targeting of GABA(B)R1a operate in a pre-Golgi compartment. In the axon GABA(B)R1a subunits are enriched in the endoplasmic reticulum (ER), and their dynamic behavior and colocalization with other secretory organelles like the ER-to-Golgi intermediate compartment (ERGIC) suggest that they employ a local secretory route. The transport of axonal GABA(B)R1a is microtubule-dependent and kinesin-1, a molecular motor of the kinesin family, determines axonal localization. Considering that progression of GABA(B)Rs through the secretory pathway is regulated by an ER retention motif our data contribute to understand the role of the axonal ER in non-canonical sorting and targeting of neurotransmitter receptors.


Conflict of interest statement

Competing Interests: The authors have declared that no competing interests exist.

Figures

Figure 1
Figure 1. GABABR1a is targeted to the axon even after blockade of Golgi export.
(A) Hippocampal neurons were transfected with MYC-GABABR1a and RFP, and processed for immunofluorescence under permeabilized conditions. MYC-GABABR1a was detected with MYC antibodies (green) and RFP was detected without staining (red). Boxes indicate somatic, dendritic and axonal regions used throughout the study. (B) Hippocampal neurons were transfected with MYC-GABABR1a and FLAG-GABABR2 and processed for immunofluorescence under non-permeabilized conditions. MYC-GABABR1a was detected with MYC antibodies (MYC-GB1a, green) and FLAG-GABABR2 was detected with FLAG antibodies (FLAG-GB2, magenta) (representative image of n = 12 neurons). (C) Same as above for neurons transfected with MYC-GABABR1a, FLAG-GABABR2, and ARF1-Q71I-HA (ARF-Q-HA). ARF1-Q71I-HA was detected with HA antibodies (red). Neurons were labeled under permeabilized conditions to visualize intracellular GABABR subunits or non-permeabilized conditions to evaluate their abundance at the plasma membrane (representative image of n = 28 neurons). (D) Hippocampal neurons from GABABR1-EGFP mice in the absence (control) or presence of ARF1-Q71I-HA (ARF-Q-HA) and processed for immunofluorescence under permeabilized conditions. ARF1-Q71I-HA was detected with HA antibodies (ARF-Q-HA, red), GABABR1-EGFP signal was amplified with EGFP antibodies (GB1, green) (representative image of n = 10 neurons). (E) Hippocampal neurons were transfected with MYC-GABABR1a in the absence (control) or presence of ARF1-Q71I-HA (ARF-Q-HA) and processed for immunofluorescence under permeabilized conditions. ARF-Q-HA was detected with HA antibodies (red), MYC-GABABR1a was detected with MYC antibodies (green), the Golgi apparatus was detected by expressing pEYFP-Golgi (magenta) (representative image of n = 18 neurons). F) Same as above for neurons transfected with MYC-GABABR1b (representative image of n = 10 neurons). Scale bar for B-F represents 20 μm. G–I) Axons of hippocampal neurons under the experimental conditions of D-F (representative images of neurons examined above). Tau staining was used to visualize the axon when not labeled by MYC-GABABR1b. Scale bar for G–I represents 20 μm.
Figure 2
Figure 2. GABABR1a colocalizes with the ER in axons.
(A) Representative axon of hippocampal neurons processed for immunofluorescence under permeabilized conditions. GABABR1 was detected with GABABR1 antibodies (GB1, green) and the ER was detected with KDEL antibodies (KDEL, red). Merged images are shown on the bottom panel (representative image of n = 17 neurons). (B) Same as above excluding staining with primary KDEL antibodies. (C) Same as above excluding staining with primary GABABR1 antibodies. (D) Representative axon of hippocampal neurons from GABABR1-EGFP mice processed for immunofluorescence under permeabilized conditions. GABABR1-EGFP signal was amplified with EGFP antibodies (GB1-EGFP, green) and the ER was detected with KDEL antibodies (KDEL, red). Merged images are shown on the bottom panel (representative image of n = 10 neurons). (E) Representative axon of hippocampal neurons transfected with MYC-GABABR1a and KDEL-RFP and processed for immunofluorescence under permeabilized conditions. MYC-GABABR1a was detected with MYC antibodies (MYC-GB1a, green), KDEL-RFP was visualized without staining (red). Merged images are shown on the bottom panel (representative image of n = 20 neurons). (F) Representative axon of hippocampal neurons transfected with MYC-GABABR1a and cytochrome b5-EGFP (CytB5-GFP) and processed for immunofluorescence under permeabilized conditions. MYC-GABABR1a was detected with MYC antibodies (MYC-GB1a, green), CytB5-GFP was visualized without staining (red). Merged images are shown on the bottom panel (representative image of n = 20 neurons). (G) Representative axon of hippocampal neurons processed for immunofluorescence under permeabilized conditions. GABABR1a was detected with GABABR1 antibodies (green) and Piccolo was detected with Piccolo antibodies (red). Merged images are shown on the bottom panel (representative image of n = 15 neurons). (H) Representative axon of hippocampal neurons transfected with MYC-GABABR1a and KDEL-RFP and processed for immunofluorescence under permeabilized conditions. MYC-GABABR1a was detected with MYC antibodies (MYC-GB1a, green), KDEL-RFP was visualized without staining (red) and MAP2 was detected with anti-MAP2 antibodies (MAP2, magenta). The axon is identified as a MAP2-negative projection. Merged images are shown on the bottom panel (representative image of n = 15 neurons). Scale bar for A-H represents 20 μm.
Figure 3
Figure 3. GABABR1a and KDEL are mobile in axons.
(A) Representative kymograph constructed from time series of axons of hippocampal neurons transfected with GABABR1a-EGFP (GB1a-GFP). Color lines correspond to selected traces within the corresponding kymograph. Solid green line: anterograde mobility; dashed green line: retrograde mobility. (B) Same as above for KDEL-RFP. Solid red line: anterograde mobility; dashed red line: retrograde mobility. (C) Representative kymographs from time series of axons of hippocampal neurons transfected with GABABR1a-EGFP and KDEL-RFP. Dashed green line: retrograde mobility of GABABR1a-EGFP; dashed red line: retrograde mobility of KDEL-RFP; dashed yellow line: synchronous retrograde mobility of GABABR1a-EGFP and KDEL-RFP. (D) Representative kymographs constructed from axons of hippocampal neurons transfected with Rab11-GFP. Solid black lines: short-range bidirectional mobility of Rab11-GFP (representative kymograph of n = 14 neurons). Images were acquired at 0.20–0.25 frames/s for a total of 120 s. Scale bar for A–D represents 20 μm. (E–G) Average velocity and directionality was quantified from the kymographs for GABABR1a-EGFP, KDEL-RFP and synchronous mobility of GABABR1a-EGFP and KDEL-RFP. Bar graphs represent the frequency distribution of velocities, anterograde transport (gray bars), retrograde transport (white bars). Pie charts represent fractions of anterograde (gray) and retrograde transport (white). Average velocities and direction were obtained from 17–139 moving puncta from a total of 42 neurons from at least three independent culture preparations. (H) Representative kymograph from time series of axons of hippocampal neurons transfected with GABABR1a-EGFP imaged by TIRF microscopy at 2 frames/s. Scale bars represent 10 s and 3 µm. (I) Bar graph represents the frequency distribution of velocities: anterograde (gray bars), retrograde (white bars). Pie chart represents fractions of anterograde (gray) and retrograde transport (white). Average velocities and direction were obtained from 41 moving puncta from at least three independent culture preparations.
Figure 4
Figure 4. GABABR1a cycles between KDEL compartments in axons.
(A) Representative axon of hippocampal neurons transfected with GABABR1a-EGFP and KDEL-RFP, and visualized live. The area originally occupied by the ER (KDEL-RFP) in each time frame was outlined in white. The arrows show a GABABR1a-EGFP puncta that exits and enters different ER compartments within the observation period (45.5 s) (representative time-lapse sequence of n = 10 neurons). Scale bar represents 20 μm. (B) Representative axon of hippocampal neurons transfected with MYC-GABABR1a (MYC-GB1a) and p58-YFP, and processed for immunofluorescence under permeabilized conditions. MYC-GABABR1a was detected with MYC antibodies (green); p58-YFP was visualized without staining (red). Merged images are shown on the bottom panel (representative image of n = 23 neurons). Scale bar represents 20 μm. (C) Kymographs were constructed from time series of axons of hippocampal neurons transfected with GABABR1a-RFP (GB1a-RFP) and p58-YFP. Solid yellow lines: synchronous transport of GABABR1a-RFP and p58-YFP (representative kymograph of n = 22 neurons). Scale bar for C-D represents 20 μm. (D) Kymographs were constructed from time series of axons of hippocampal neurons under control conditions or treated with nocodazole after transfection with GABABR1a-EGFP (GB1a-GFP) or GABABR1a-ASA-EGFP (GB1a-ASA-GFP) and KDEL-RFP. Top right panels: accumulated GABABR1a-EGFP and KDEL-RFP in static puncta (solid yellow lines). Bottom right panels: accumulated GABABR1a-ASA-EGFP and KDEL-RFP in different static puncta (solid green and red lines) (representative kymograph of n = 21 neurons).
Figure 5
Figure 5. Axonal targeting of GABABR1a is kinesin-1 dependent and C-terminal domain independent.
(A) Hippocampal neurons were transfected with MYC-GABABR1a and RFP (left, representative image of n = 12 neurons) or MYC-GABABR1a and Kif5C-RFP-DN, a dominant negative version of kinesin-1 (Kif5C-DN, right, representative image of n = 13 neurons). The neuronal volume filled by RFP or Kif5C-RFP-DN is shown. Boxes in top panels correspond to regions of axons (Ax) and dendrites (unlabelled) magnified below. MYC-GABABR1a (green) and RFP or Kif5C-RFP-DN (red). Merged images are shown on the bottom panel. Scale bar represents 40 μm. (B) Top panels: representative axon of hippocampal neurons transfected with pEYFP-ER (ER-YFP) and RFP or pEYFP-ER and Kif5C-RFP-DN. Markers were visualized without staining. Merged images are shown on the bottom panel (representative image of n = 15 neurons). Bottom panels: representative axon of hippocampal neurons transfected with GABABR2-EGFP (GB2-GFP) and RFP or GABABR2-EGFP and Kif5C-RFP-DN. Markers were visualized without staining. Merged images are shown on the bottom panel (representative image of n = 15 neurons). Scale bar for represents 40 μm. (C) Representative axons of hippocampal neurons transfected with KDEL-RFP and MYC-GABABR1a, or MYC-GABABR1a-AA-ASA, or MYC-GABABR1a-ΔC, and processed for immunofluorescence under permeabilized conditions. MYC-GABABR1a versions were detected with MYC antibodies (MYC-GB1a, MYC-GB1a-AA-ASA, MYC-GB1a-ΔC); KDEL-RFP was visualized without staining (representative images of n = 20, 9 and 10 neurons respectively). Merged images are shown on the bottom panels. Scale bar represents 20 μm. (D) Hippocampal neurons were transfected with MYC-GABABR1a-ΔC and RFP (left, representative image of n = 12 neurons) or MYC-GABABR1a-ΔC and Kif5C-RFP-DN (Kif5C-DN, right, representative image of n = 9 neurons). The neuronal volume filled by RFP or Kif5C-RFP-DN is shown. Boxes in top panels correspond to regions of axons (Ax) and dendrites (unlabelled) magnified below. MYC-GABABR1a-ΔC (green) and RFP or Kif5C-RFP-DN (red). Merged images are shown on the bottom panel. Scale bar represents 40 μm.

References

    1. Horton AC, Ehlers MD (2004) Secretory trafficking in neuronal dendrites. Nat Cell Biol 6: 585–591. - PubMed
    1. Bettler B, Kaupmann K, Mosbacher J, Gassmann M (2004) Molecular structure and physiological functions of GABA(B) receptors. Physiol Rev 84: 835–867. - PubMed
    1. Couve A, Filippov AK, Connolly CN, Bettler B, Brown DA, et al. (1998) Intracellular retention of recombinant GABAB receptors. J Biol Chem 273: 26361–26367. - PubMed
    1. Ramírez OA, Vidal RL, Tello JA, Vargas KJ, Kindler S (2009) Dendritic Assembly of Heteromeric g-Aminobutyric Acid Type B Receptor Subunits in Hippocampal Neurons. J Biol Chem 284: 13077–13085. - PMC - PubMed
    1. Margeta-Mitrovic M, Jan YN, Jan LY (2000) A trafficking checkpoint controls GABA(B) receptor heterodimerization. Neuron 27: 97–106. - PubMed

Publication types