. 2012;7(8):e44173.
doi: 10.1371/journal.pone.0044173. Epub 2012 Aug 28.

Adaptive ridge regression for rare variant detection

Affiliations

Adaptive ridge regression for rare variant detection

Haimao Zhan et al. PLoS One. 2012.

Abstract

It is widely believed that both common and rare variants contribute to the risks of common diseases or complex traits and the cumulative effects of multiple rare variants can explain a significant proportion of trait variances. Advances in high-throughput DNA sequencing technologies allow us to genotype rare causal variants and investigate the effects of such rare variants on complex traits. We developed an adaptive ridge regression method to analyze the collective effects of multiple variants in the same gene or the same functional unit. Our model focuses on continuous trait and incorporates covariate factors to remove potential confounding effects. The proposed method estimates and tests multiple rare variants collectively but does not depend on the assumption of same direction of each rare variant effect. Compared with the Bayesian hierarchical generalized linear model approach, the state-of-the-art method of rare variant detection, the proposed new method is easy to implement, yet it has higher statistical power. Application of the new method is demonstrated using the well-known data from the Dallas Heart Study.


Conflict of interest statement

Competing Interests: The authors have declared that no competing interests exist.

Figures

Figure 1
Figure 1. Significance level for each marker in ANGPTL3, ANGPTL4 and ANGPTL5 generated from the joint analyses.
P value is shown on the –log10 scale. The top panels show the result of the adaptive ridge regression (ARR) analysis and the bottom panels show the results of the Bayesian hierarchical generalized linear model (BhGLM) analysis. The red dots represent variants with p-values smaller than 0.05, i.e., formula image.
Figure 2
Figure 2. Type I error rates of the ARR and BhGLM methods obtained from the simulation studies.
The Type I error rate of the Bayesian hierarchical generalized linear model (BhGLM) method was calculated using a threshold of 3.84 for the Wald test statistic. The Type I error rates of the adaptive ridge regression (ARR) method were calculated using thresholds of 3.84 and 2.71, respectively, corresponding to the formula image and formula image criteria (formula image).
Figure 3
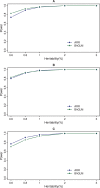
Figure 3. Power comparison between ARR and BhGLM at significance level of 0.05.
The top panel (A) gives the powers of the adaptive ridge regression (ARR) and the Bayesian hierarchical generalized linear model (BhGLM) evaluated at the threshold of 3.84. The panel in the middle (B) shows the powers of ARR and BhGLM evaluated at the threshold 2.71 for ARR and 3.84 for BhGLM. The bottom panel (C) shows the powers of ARR and BhGLM using thresholds of 3.45 and 9.78, respectively, to control the 0.05 Type I error rate.
Figure 4
Figure 4. Changes of p-values of the three genes during the iteration process in the separate analysis.
The p-values of the three genes in separate analysis using adaptive ridge regression (ARR) are plotted against the iteration process. P-values are calculated based on formula image distribution.

Similar articles

Cited by

References

    1. Aulchenko YS, Ripatti S, Lindqvist I, Boomsma D, Heid IM, et al. (2009) Loci influencing lipid levels and coronary heart disease risk in 16 European population cohorts. Nat Genet 41: 47–55. - PMC - PubMed
    1. Barrett JC, Hansoul S, Nicolae DL, Cho JH, Duerr RH, et al. (2008) Genome-wide association defines more than 30 distinct susceptibility loci for Crohn's disease. Nat Genet 40: 955–962. - PMC - PubMed
    1. Kathiresan S, Melander O, Guiducci C, Surti A, Burtt NP, et al. (2008) Six new loci associated with blood low-density lipoprotein cholesterol, high-density lipoprotein cholesterol or triglycerides in humans. Nat Genet 40: 189–197. - PMC - PubMed
    1. Altshuler D, Daly MJ, Lander ES (2008) Genetic mapping in human disease. Science 322: 881–888. - PMC - PubMed
    1. Manolio TA, Collins FS, Cox NJ, Goldstein DB, Hindorff LA, et al. (2009) Finding the missing heritability of complex diseases. Nature 461: 747–753. - PMC - PubMed

Publication types