. 2012;7(8):e44175.
doi: 10.1371/journal.pone.0044175. Epub 2012 Aug 30.

Distinct and competitive regulatory patterns of tumor suppressor genes and oncogenes in ovarian cancer

Affiliations

Distinct and competitive regulatory patterns of tumor suppressor genes and oncogenes in ovarian cancer

Min Zhao et al. PLoS One. 2012.

Abstract

Background: So far, investigators have found numerous tumor suppressor genes (TSGs) and oncogenes (OCGs) that control cell proliferation and apoptosis during cancer development. Furthermore, TSGs and OCGs may act as modulators of transcription factors (TFs) to influence gene regulation. A comprehensive investigation of TSGs, OCGs, TFs, and their joint target genes at the network level may provide a deeper understanding of the post-translational modulation of TSGs and OCGs to TF gene regulation.

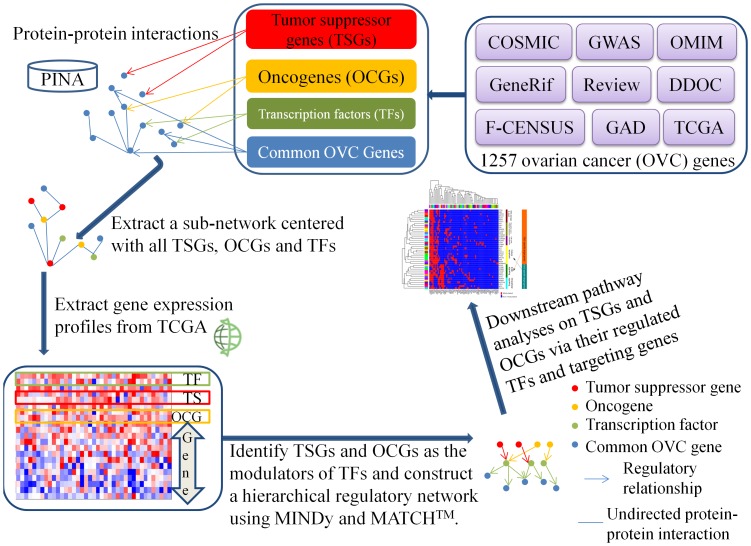
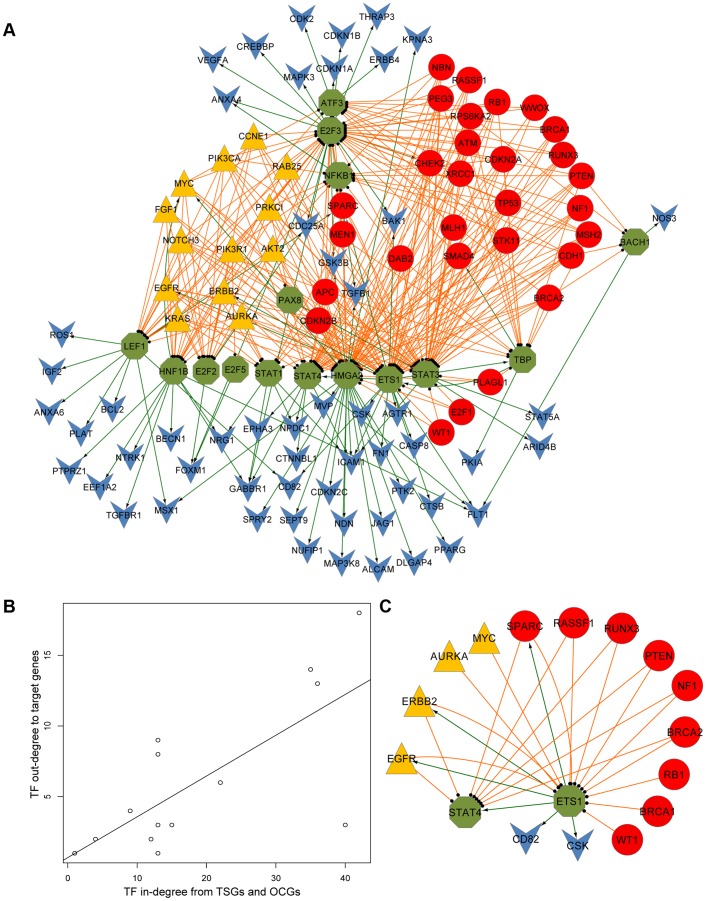
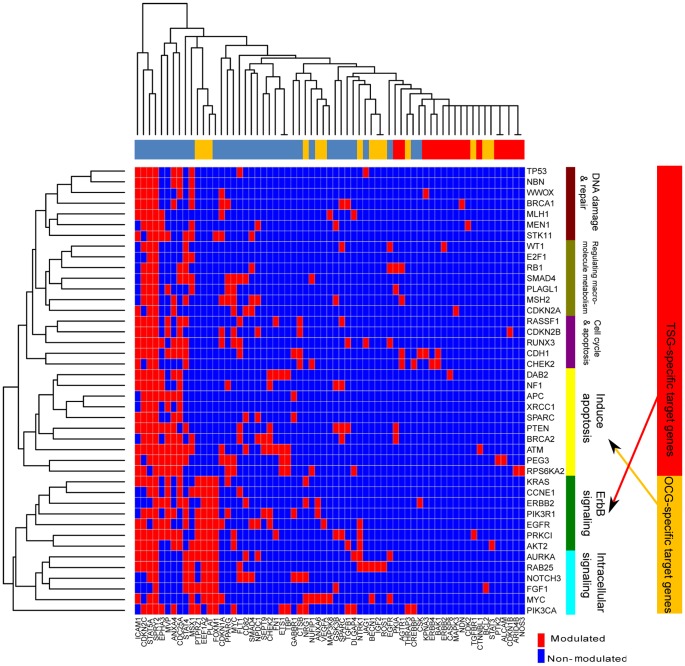
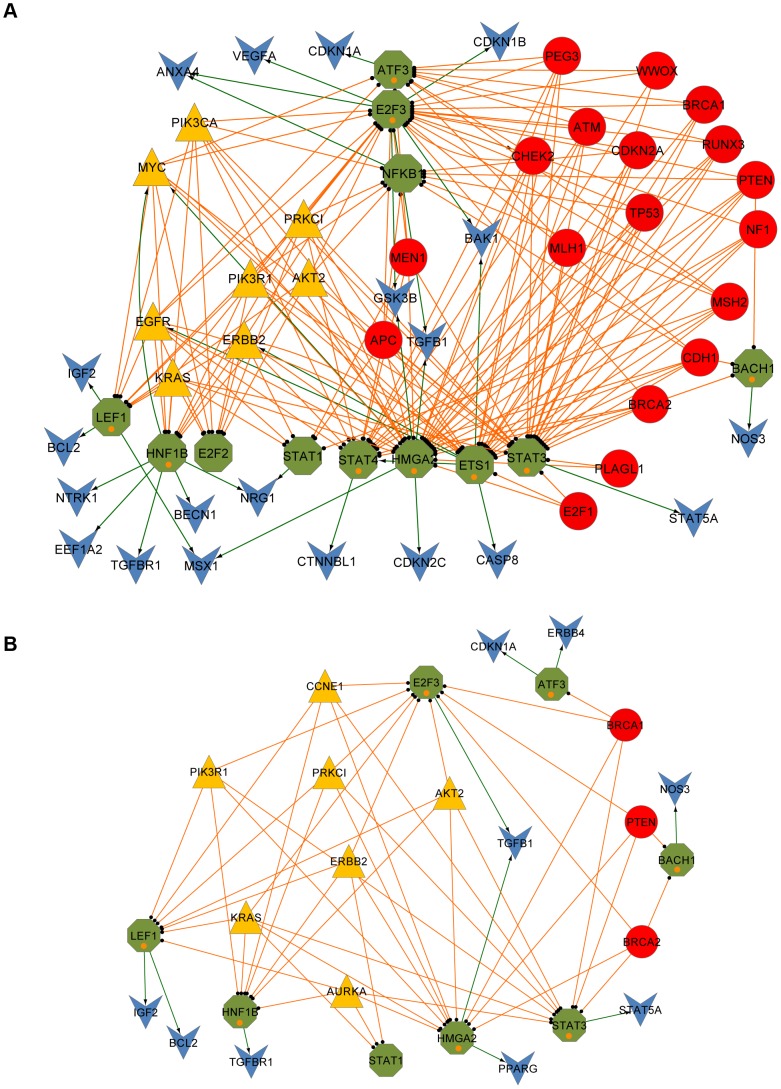
Methodology/principal findings: In this study, we developed a novel computational framework for identifying target genes of TSGs and OCGs using TFs as bridges through the integration of protein-protein interactions and gene expression data. We applied this pipeline to ovarian cancer and constructed a three-layer regulatory network. In the network, the top layer was comprised of modulators (TSGs and OCGs), the middle layer included TFs, and the bottom layer contained target genes. Based on regulatory relationships in the network, we compiled TSG and OCG profiles and performed clustering analyses. Interestingly, we found TSGs and OCGs formed two distinct branches. The genes in the TSG branch were significantly enriched in DNA damage and repair, regulating macromolecule metabolism, cell cycle and apoptosis, while the genes in the OCG branch were significantly enriched in the ErbB signaling pathway. Remarkably, their specific targets showed a reversed functional enrichment in terms of apoptosis and the ErbB signaling pathway: the target genes regulated by OCGs only were enriched in anti-apoptosis and the target genes regulated by TSGs only were enriched in the ErbB signaling pathway.

Conclusions/significance: This study provides the first comprehensive investigation of the interplay of TSGs and OCGs in a regulatory network modulated by TFs. Our application in ovarian cancer revealed distinct regulatory patterns of TSGs and OCGs, suggesting a competitive regulatory mechanism acting upon apoptosis and the ErbB signaling pathway through their specific target genes.


Conflict of interest statement

Competing Interests: The authors have read the journal's policy and have the following conflicts: Co-author Zhongming Zhao is a PLOS ONE Editorial Board member. This does not alter the authors' adherence to all the PLOS ONE policies on sharing data and materials. Other than above, the authors have declared that no competing interests exist.

Figures

Figure 1
Figure 1. Schematic view of tumor suppressor genes (TSGs) and oncogenes (OCGs) regulatory network analysis.
This figure shows the TSG and OCG regulatory network construction and identification of critical downstream pathways modulated by TSGs and OCGs. Our pipeline involves four main steps. 1) Collecting ovarian cancer (OVC)-related genes, tumor suppressors (TSGs), oncogenes (OCGs), and transcription factors (TFs) from public databases and literature. 2) Extracting subnetworks centered on OVC TSGs, OCGs, and TFs from protein-protein interaction (PPI) data. 3) Integrating genome-scale expression data to construct a hierarchical regulatory network with OVC-related TSGs, OCGs, TFs and target genes. 4) Analyzing downstream pathways and subnetworks with regulated genes to investigate the interplay of TSGs and OCGs in specific biological processes. Modulator Inference by Network Dynamics (MINDy) is a software tool used for the identification of post-translational modulators of TFs based on expression profiles. Protein Interaction Network Analysis (PINA) is a platform for protein interaction network construction.
Figure 2
Figure 2. Network view of tumor suppressor genes (TSGs) and oncogenes (OCGs) in ovarian cancer.
(A) Integrated hierarchical network of ovarian cancer (OVC) related tumor suppressor genes (TSGs), oncogenes (OCGs), and transcription factors (TFs). The nodes in red (circle) represent OVC-related TSGs, nodes in yellow (triangle) represent OVC-related OCGs, nodes in green (octagon) represent OVC-related TFs, and nodes in blue (vee) represent target genes. The links in orange represent the regulations from the TSGs or OCGs to their modulating TFs. The green arrow lines represent the regulations from the TFs to their target genes. (B) Plot of in-degree and out-degree of the 15 TFs in the three-layer regulatory network. In-degree is defined as the number of nodes that immediately link to and regulate the node of interest, and out-degree is defined as the number of nodes that immediately link to and are regulated by the node of interest. (C) A subnetwork with three feedback loops centered by ETS1. The color and shape schema of nodes and links are the same as those in (A).
Figure 3
Figure 3. Downstream target gene profiles clustering with tumor suppressor genes (TSGs) and oncogenes (OCGs).
The heat map shows a two-color representation of the regulatory relationship between modulators (TSGs and OCGs) and downstream target genes. A red colored cell in the grid indicates that the row TSG or OCG is inferred to regulate the column target gene. A blue colored cell in the grid indicates that the row TSG or OCG has no influence on the column target gene. The modulators’ dendrogram represents a hierarchical clustering of TSGs and OCGs based on their target gene profiles. The modulators’ dendrogram is divided into two branches with six clusters marked with different colors. The most significant enriched functional annotations are marked along the right of each cluster. Take the first maroon cluster in the TSG branch as an example: the enriched genes are involved in DNA damage and repair. The TSG-specific target genes are marked in red and the OCG-specific target genes are marked with yellow in the top panel. In addition, the TSG-specific target genes are also represented in red and the OCG-specific target genes are represented as a whole with yellow in the right panel. The arrow from TSG-specific target genes represents their regulatory effects on the ErbB signaling pathway, and the arrow from OCG-specific target genes represents their anti-apoptosis effects as apoptosis negative regulators.
Figure 4
Figure 4. Interplay of tumor suppressor genes (TSGs) and oncogenes (OCGs) to regulate apoptosis and response to hormone stimulation.
(A) Apoptosis. (B) Response to hormone stimulation. The red circular nodes are OVC-related TSGs. The yellow triangle shaped nodes are OVC-related OCGs. The green octagonal nodes are OVC-related transcription factors (TFs). The blue vee nodes represent targeted OVC genes. The orange links are from the TSGs or OCGs to their modulating TFs. The green arrow lines are from the TFs to their regulating target genes. The TFs added by the first neighbors of the target genes involved in the two biological processes are marked with orange circles in (A) and (B).

References

    1. Balmain A, Gray J, Ponder B (2003) The genetics and genomics of cancer. Nat Genet 33 Suppl: 238–244 - PubMed
    1. Sherr CJ (2004) Principles of tumor suppression. Cell 116: 235–246. - PubMed
    1. Croce CM (2008) Oncogenes and cancer. N Engl J Med 358: 502–511. - PubMed
    1. Klein G (2002) tumor suppressor genes: specific classes Encyclopedia of Cancer, Second Edition: 491–499.
    1. Schwab M (1989) Genetic principles of tumor suppression. Biochim Biophys Acta 989: 49–64. - PubMed

Publication types

MeSH terms