. 2012;7(8):e44197.
doi: 10.1371/journal.pone.0044197. Epub 2012 Aug 31.

Effective non-viral delivery of siRNA to acute myeloid leukemia cells with lipid-substituted polyethylenimines

Affiliations

Effective non-viral delivery of siRNA to acute myeloid leukemia cells with lipid-substituted polyethylenimines

Breanne Landry et al. PLoS One. 2012.

Abstract

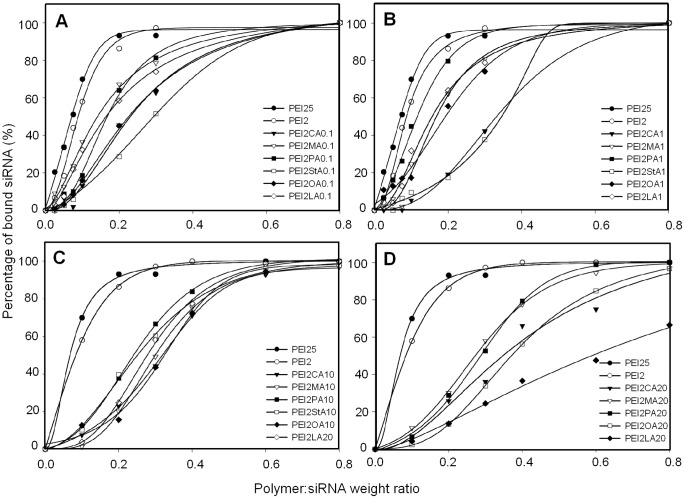
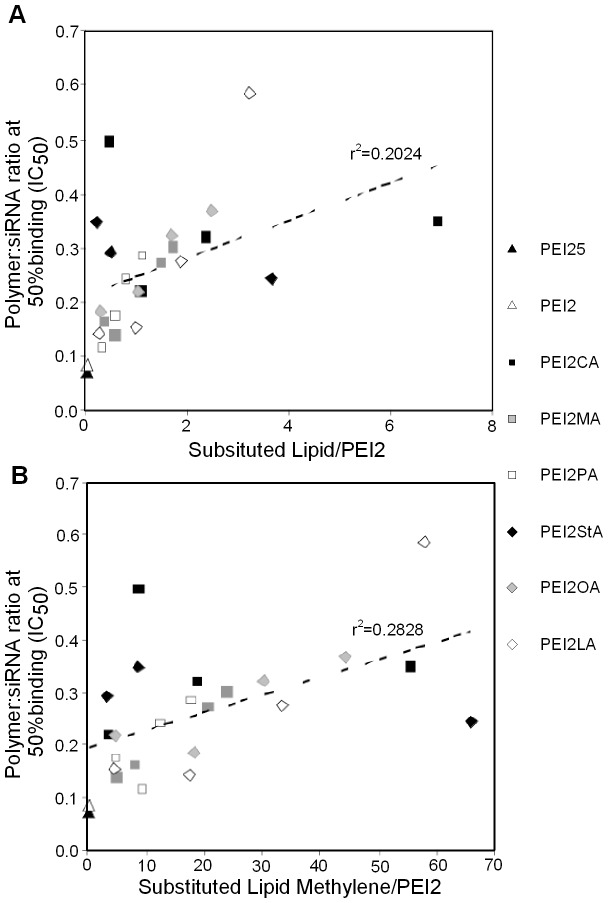
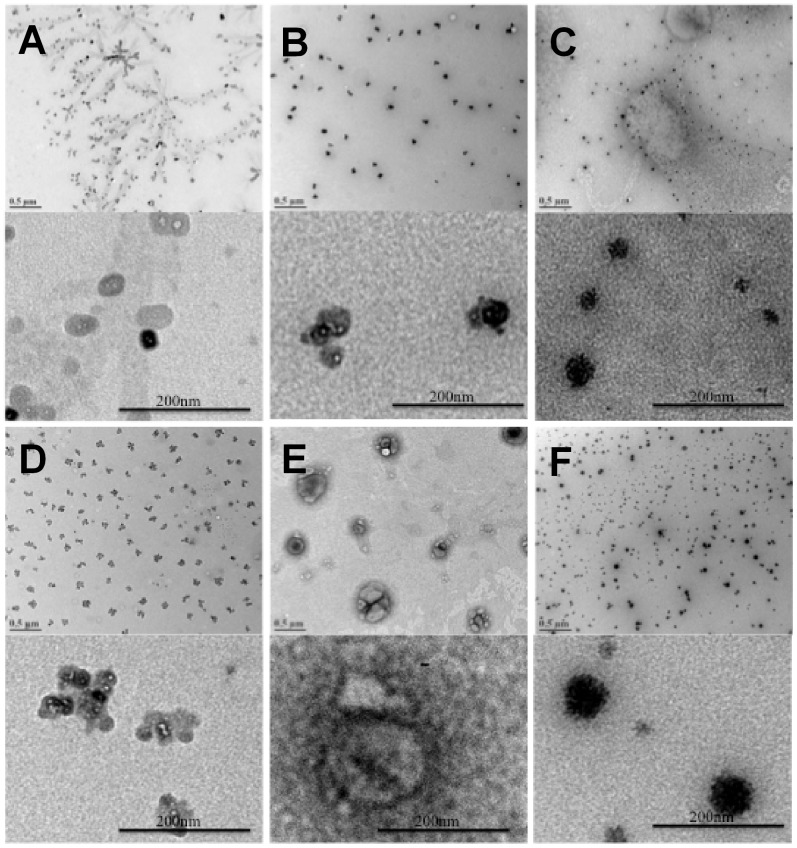
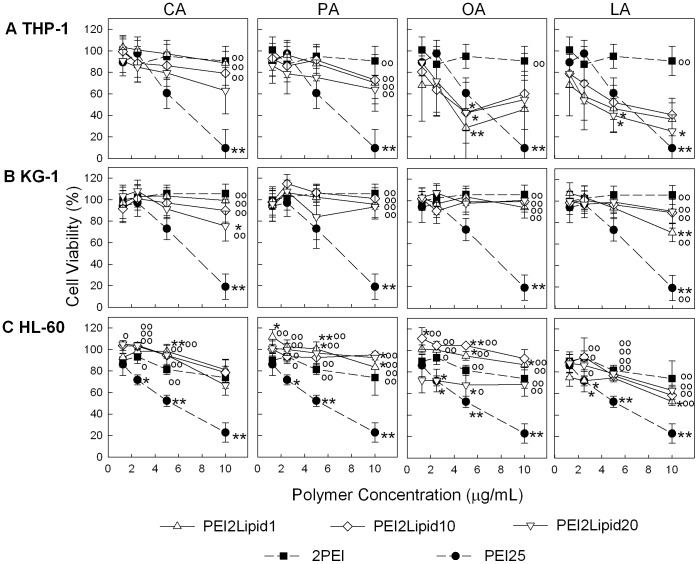
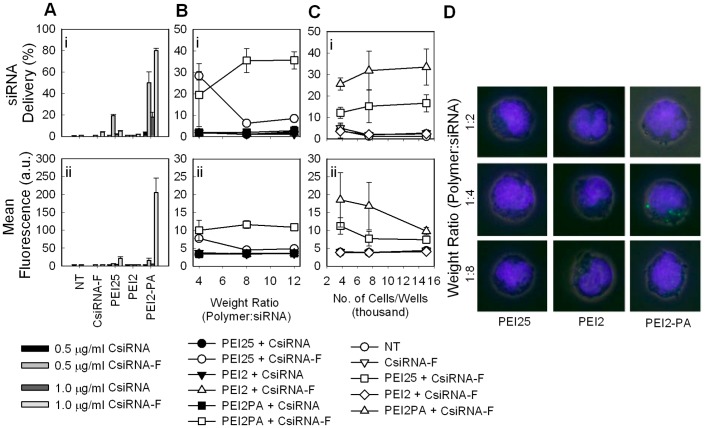
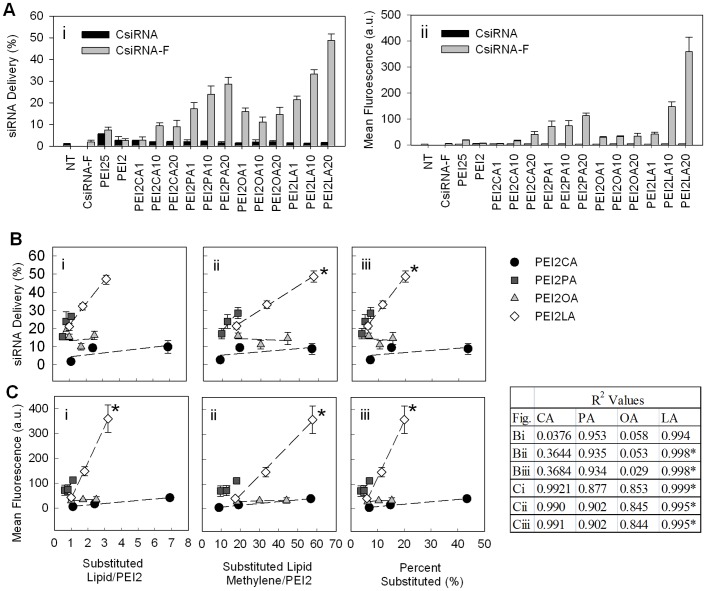
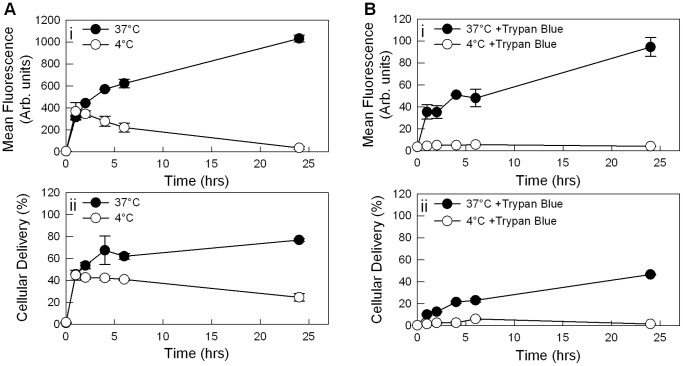
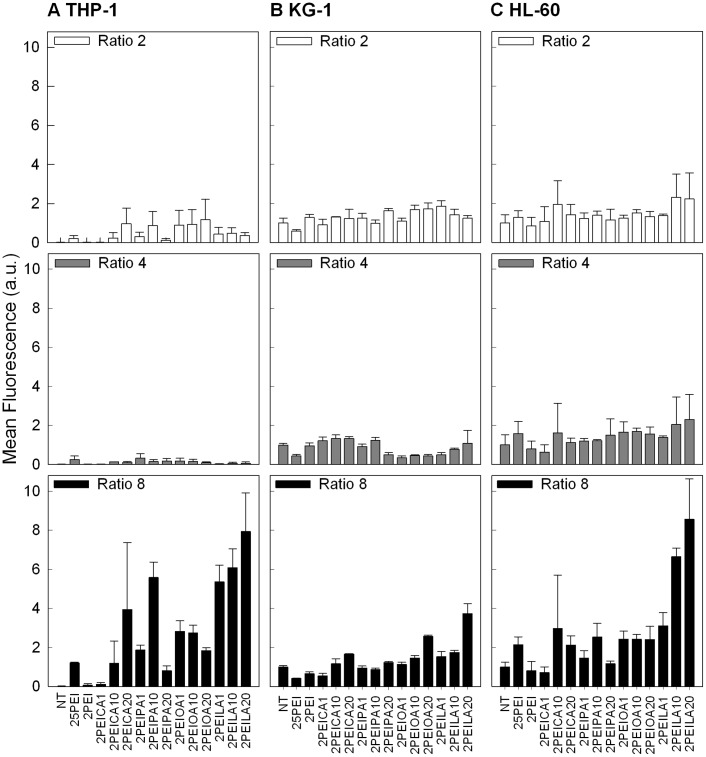
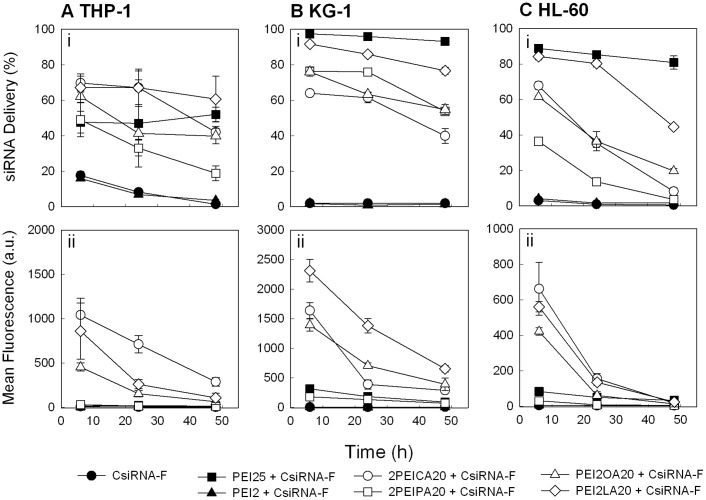
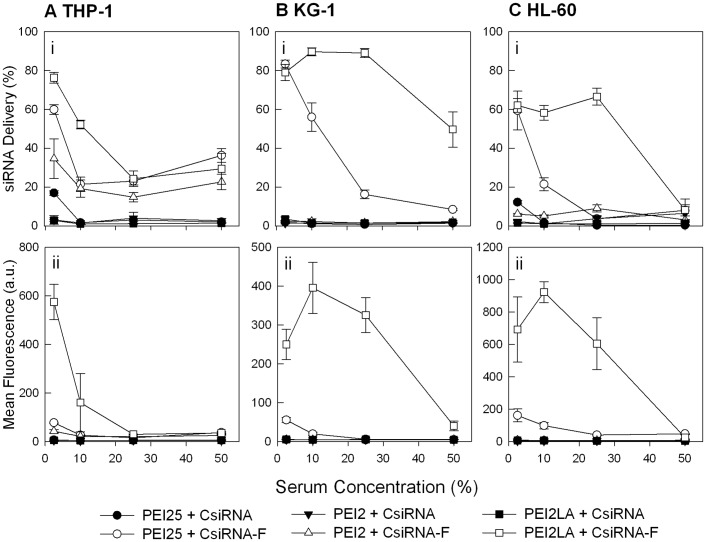
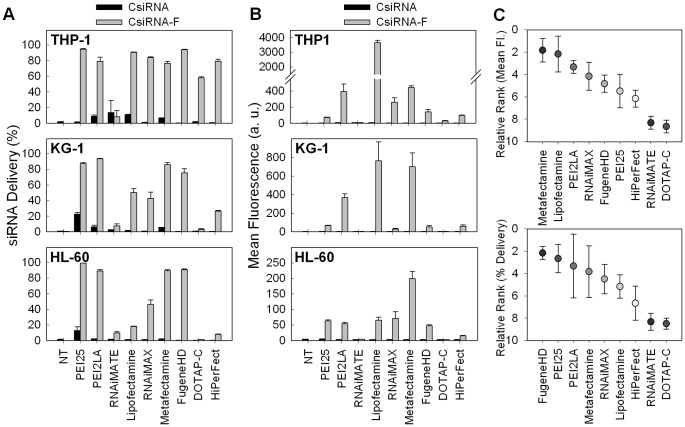
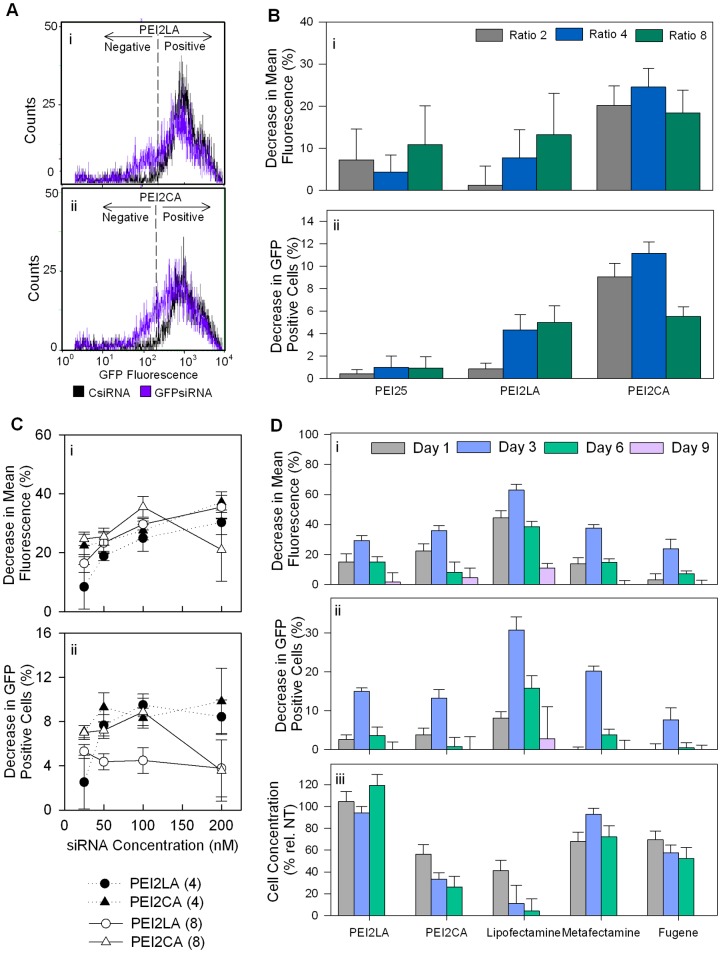
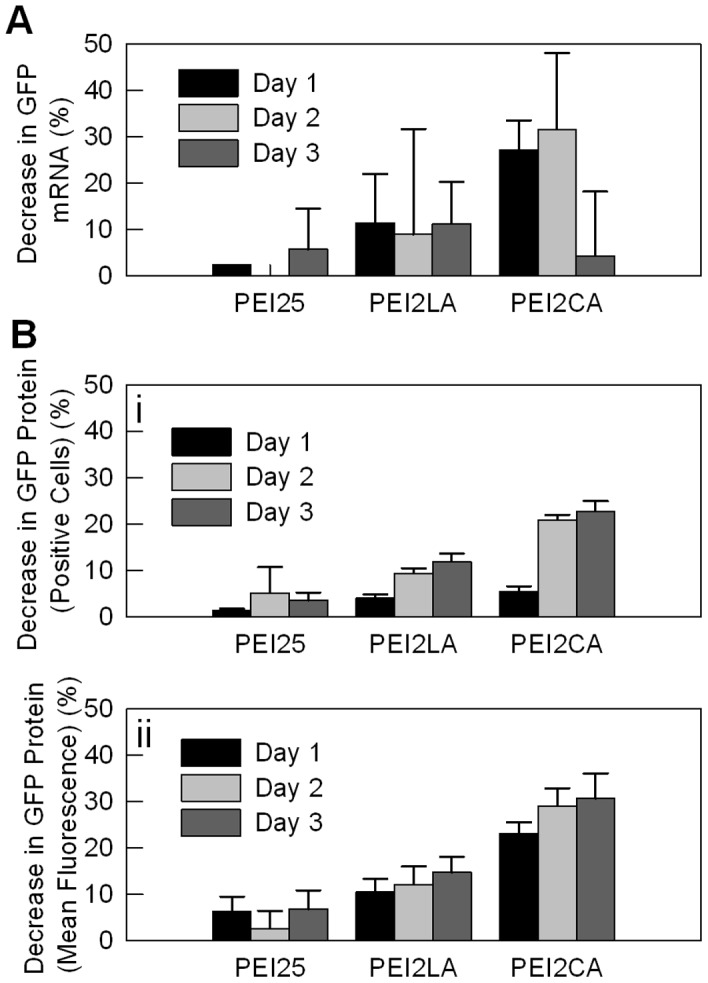
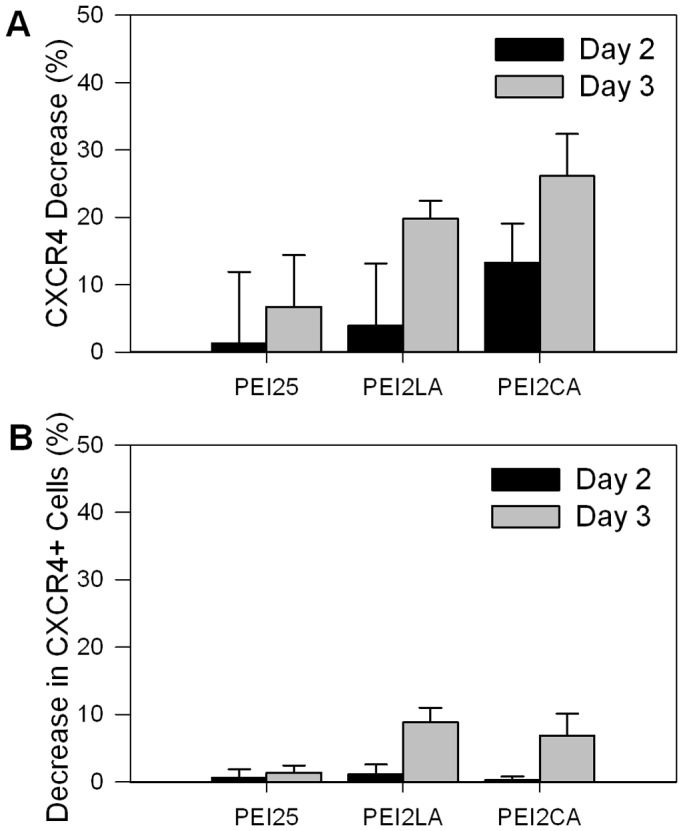
Use of small interfering RNA (siRNA) is a promising approach for AML treatment as the siRNA molecule can be designed to specifically target proteins that contribute to aberrant cell proliferation in this disease. However, a clinical-relevant means of delivering siRNA molecules must be developed, as the cellular delivery of siRNA is problematic. Here, we report amphiphilic carriers combining a cationic polymer (2 kDa polyethyleneimine, PEI2) with lipophilic moieties to facilitate intracellular delivery of siRNA to AML cell lines. Complete binding of siRNA by the designed carriers was achieved at a polymer:siRNA ratio of ≈ 0.5 and led to siRNA/polymer complexes of ≈ 100 nm size. While the native PEI2 did not display cytotoxicity on AML cell lines THP-1, KG-1 and HL-60, lipid-modification on PEI2 slightly increased the cytotoxicity, which was consistent with increased interaction of polymers with cell membranes. Cellular delivery of siRNA was dependent on the nature of lipid substituent and the extent of lipid substitution, and varied among the three AML cell lines used. Linoleic acid-substituted polymers performed best among the prepared polymers and gave a siRNA delivery equivalent to better performing commercial reagents. Using THP-1 cells and a reporter (GFP) and an endogenous (CXCR4) target, effective silencing of the chosen targets was achieved with 25 to 50 nM of siRNA concentrations, and without adversely affecting subsequent cell growth. We conclude that lipid-substituted PEI2 can serve as an effective delivery of siRNA to leukemic cells and could be employed in molecular therapy of leukemia.


Conflict of interest statement

Competing Interests: The authors have declared that no competing interests exist.

Figures

Figure 1
Figure 1. Binding of lipid-substituted polymers to siRNA.
Percentage of siRNA bound as a function of polymer:siRNA weight ratio in EMSA analysis. Polymers obtained from lipid:polymer feed ratios of 0.012, 0.066, 0.1 and 0.2 are shown in A, B, C and D, respectively.
Figure 2
Figure 2. Correlations between polymer binding affinity IC50 and extent of lipid substitutions.
IC50 is shown as a function of number of lipids substituted (A) or number of lipid methylenes substituted (B). As lipid substitution is increased, the binding affinity (given by IC50) decreased. Statistical analysis was determined by Student’s t-test (p<0.05).
Figure 3
Figure 3. Morphology of polymer/siRNA complexes imaged by TEM.
(A) PEI25 complexes, (B) PEI2 complexes, (C) PEI2-CA20 complexes, (D) PEI2-PA20 complexes, (E) PEI2-OA20 complexes, (F) PEI2-LA20 complexes. All complexes were prepared at an 8∶1 polymer:siRNA weight ratio. Scale bar in the high magnification images indicates 200 nm.
Figure 4
Figure 4. Cytotoxicity of complexes on THP-1, KG-1 and HL-60 cells (top, middle and bottom panel, respectively).
Cell viability values are expressed relative to no-treatment control. Viability was measured 24 h after incubation of complexes with cell lines. PEI25 displays a linear relationship with increased cytotoxicity in line with increasing concentration. Effect of lipid-substituted polymers on cell viability was similar to that of unmodified PEI2. * : p<0.05, ** : p<0.01, as compared to PEI2 and o : p<0.05, oo : p<0.01 as compared to PEI25, using one-way ANOVA tests with Dunnett post test.
Figure 5
Figure 5. siRNA delivery to THP-1 cells.
(A) varying complex dose (0.5 and 1.0 µg/mL siRNA). (B) varying polymer:siRNA weight ratio. (C) varying initial cell number (0.35 µg/mL siRNA). The results are summarized as (i) percentage of siRNA-associated cells in cell population, and (ii) mean fluorescence of cells due to complex association. (D) confocal microscope images of individual cells (0.5 µg/mL siRNA). Hoechst stained nucleus in blue and FAM-labelled siRNA-polymer complexes in green. Polymer:siRNA ratios were 2∶1, 4∶1 and 8∶1 from top to bottom panel.
Figure 6
Figure 6. Effect of lipid substitution on siRNA delivery to THP-1 cells.
Polymer:siRNA ratio was 8∶1 and siRNA concentration was 25 nM (0.35 µg/mL). (A) siRNA delivery percentage (percentage of cells with complexes, i) and mean fluorescence (mean fluorescence of cells due to fluorescence labelled siRNA-polymer complexes, ii). (B) Correlations between siRNA delivery percentage and lipid substitution. (C) Correlations between mean fluorescence and lipid substitution. Very strong positive correlations (r2 values) are seen with PA and LA regardless how the lipid substitution is expressed (no of lipid per PEI2, no of lipid methyl carbons per PEI2 or percentage of PEI2 amines substituted) and with both siRNA delivery and mean fluorescence. Strong correlation (r2 value) is seen with CA when considering mean fluorescence. * indicates where the slope is statistically significant.
Figure 7
Figure 7. Effect of temperature (4 and 37°C) and trypan blue treatment on siRNA delivery to THP-1 cells.
PEI2-LA (2.1 LA/PEI2) was used in this study with polymer:siRNA ratio of 8∶1 and final siRNA concentration of 25 nM (0.35 µg/mL). (A) siRNA delivery based on mean FAM fluorescence (i) and FAM-siRNA positive cell population (ii) with untreated cells (B) siRNA delivery based on mean FAM fluorescence (i) and FAM-siRNA positive cell population (ii) with cells treated with trypan blue.
Figure 8
Figure 8. siRNA delivery to THP-1, KG-1 and HL-60 cells at various polymer:siRNA weight ratios.
(A) THP-1 (B) KG-1, and (C) HL-60 cells. Fluorescence intensity refers to the mean fluorescence of the cell population. Non-labeled control siRNAs did not show any significant fluorescence (autofluorescence) and were removed for figure clarity. siRNA concentration was 25 nM (0.35 µg/mL) and polymer:siRNA weight ratios were 2∶1 (top panel), 4∶1 (middle panel) and 8∶1 (bottom panel).
Figure 9
Figure 9. siRNA delivery to THP-1, KG-1 and HL-60 cells at various time points.
(A) THP-1 (B) KG-1, and (C) HL-60 cells. Non-labeled control siRNAs did not show any significant fluorescence (autofluorescence) and were removed for figure clarity. siRNA concentration was 25 nM (35 µg/mL) and polymer:siRNA weight ratio was 8∶1. The results are summarized as percentage of siRNA positive cells (top panel), mean fluorescence per cell (middle panel).
Figure 10
Figure 10. Effect of serum on siRNA/polymer complex delivery to THP-1, KG-1 and HL-60 cells.
(A) THP-1 (B) KG-1, and (C) HL-60 cells. siRNA concentration was 25 nM (35 µg/mL) and polymer:siRNA weight ratio was 8∶1. The results are summarized as percentage of siRNA positive cells (top panel) and mean fluorescence per cell (middle panel).
Figure 11
Figure 11. siRNA delivery to THP-1, KG-1 and HL-60 cells by commercial reagents.
siRNA delivery after 24 hours was expressed as the siRNA-positive cell population (A) or mean fluorescence of cell population (B). (C) Relative ranking of various reagents based on mean fluorescence (top panel) or percentage of siRNA-positive cell population (bottom panel). Results from all three cell types were pooled for the ranking.
Figure 12
Figure 12. Silencing in GFP-expressing THP-1 cells. (A)
The cell counts as measured by flow cytometry (expressed as a percentage of non-treated cells). (B) Silencing was assessed after 3 days of siRNA treatment (50 nM) and expressed as decrease in mean GFP fluorescence or decrease in GFP-positive cells. The polymer:siRNA ratios were 2∶1, 4∶1 and 8∶1. (C) Dose-response curves for GFP silencing between 25 and 200 nM siRNA treatment. The CA and LA substituted polymers were used at the polymer:siRNA ratios of 4∶1 and 8∶1, and silencing was assessed after 3 days of treatment. (D) Silencing by CA- and LA-substituted polymers and three commercial reagents (Lipofectamine™ 2000, Metafectamine and Fugene HD). The extent of silencing was summarized over a course of 9 days and expressed as decrease in mean GFP fluorescence (top panel) or decrease in GFP-positive cells (middle panel). The lipid substitutions of the polymers used were 2.1 LA/PEI (PEI2-LA) and 6.9 CA/PEI (PEI2-CA).
Figure 13
Figure 13. GFP mRNA and protein suppression in THP-1 cells.
(A) Decrease in GFP mRNA levels, and (B) decrease in GFP protein levels (i: based on mean GFP fluorescence and ii: based on GFP-positive cell population). The GFP-positive THP-1 cells were treated with 50 nM GFP siRNA (or control siRNA) delivered with PEI25, PEI2-LA (2.1 LA/PEI) and PEI2-CA (6.9 CA/PEI; 4∶1 =  polymer:siRNA ratio) for 1 to 3 days, after which the cells were harvested for PCR (A) and flow cytometry (B).
Figure 14
Figure 14. CXCR4 Silencing in THP-1 cells.
Changes in CXCR4 levels based on (A) mean CXCR4 fluorescence intensity and (B) CXCR4-positive cell population. Silencing was assessed after 2 and 3 days of CXCR4-specific siRNA or control siRNA treatment (50 nM with polymer:siRNA ratio of 4∶1). The polymers used were PEI25, PEI2-LA (2.1 LA/PEI) and PEI2-CA (6.9 CA/PEI).

Similar articles

Cited by

References

    1. Cancer Facts & Figures (2012) from American Cancer Society web site. Available: http://www.cancer.org/Research/CancerFactsFigures/index. Accessed June 30, 2012.
    1. Sekeres MA (2008) Treatment of older adults with acute myeloid leukemia: state of the art and current perspectives. Haematolog 93: 1769–1772. - PubMed
    1. Kasper GJ, Zwan CM (2007) Pediatric acute myeloid leukemia:towards high quality cure of all patients. Haematolog 92: 1519–1532. - PubMed
    1. Löwenberg B, Downing JR, Burnett A (2000) Acute myeloid leukemia. NEJM 341: 1051–1063. - PubMed
    1. Cioca DP, Aoki Y, Kiyosawa K (2003) RNA interference is a functional pathway with therapeutic potential in human myeloid leukemia cell lines. Cancer Gene Ther 10: 125–133. - PubMed

Publication types

MeSH terms