

Recruitment of Rpd3 to the telomere depends on the protein arginine methyltransferase Hmt1
- PMID: 22953000
- PMCID: PMC3432115
- DOI: 10.1371/journal.pone.0044656
Recruitment of Rpd3 to the telomere depends on the protein arginine methyltransferase Hmt1
Erratum in
-
Correction: Recruitment of Rpd3 to the telomere depends on the protein arginine methyltransferase Hmt1.PLoS One. 2015 Mar 20;10(3):e0120968. doi: 10.1371/journal.pone.0120968. eCollection 2015. PLoS One. 2015. PMID: 25793372 Free PMC article. No abstract available.
Abstract
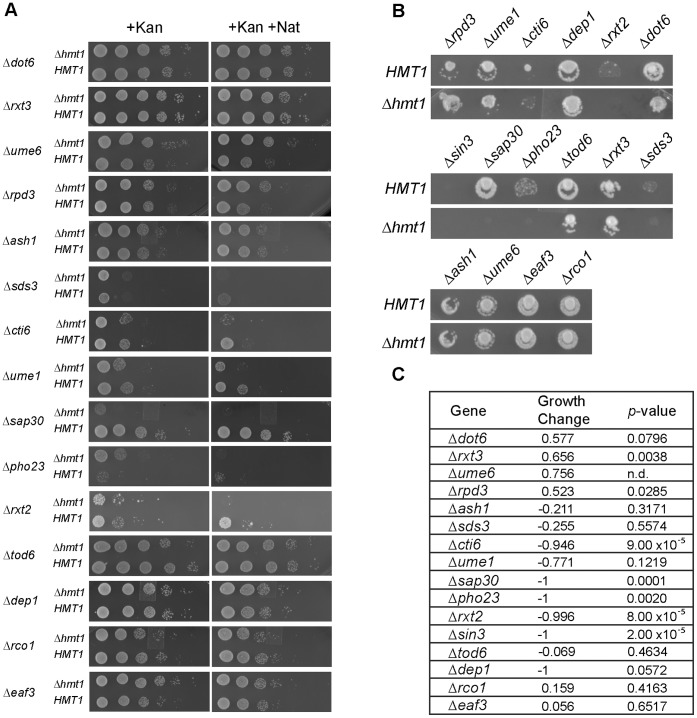
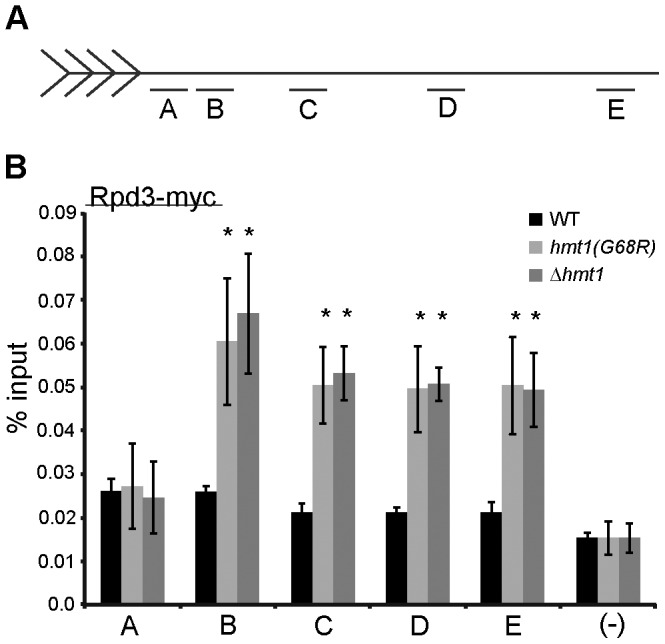
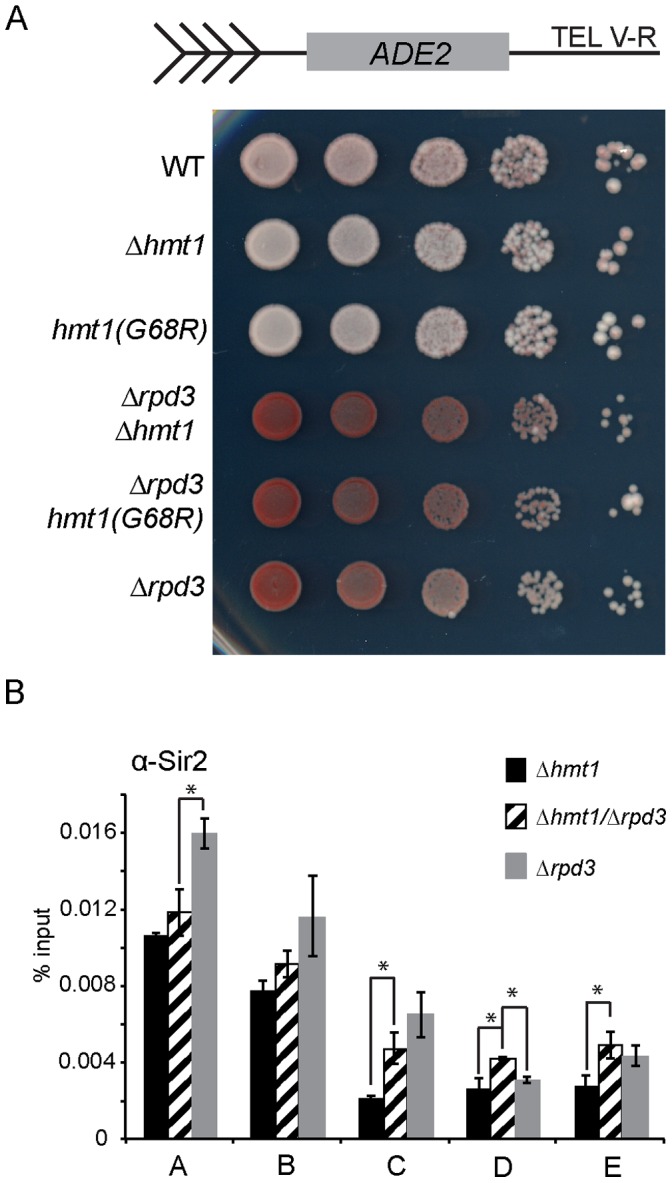
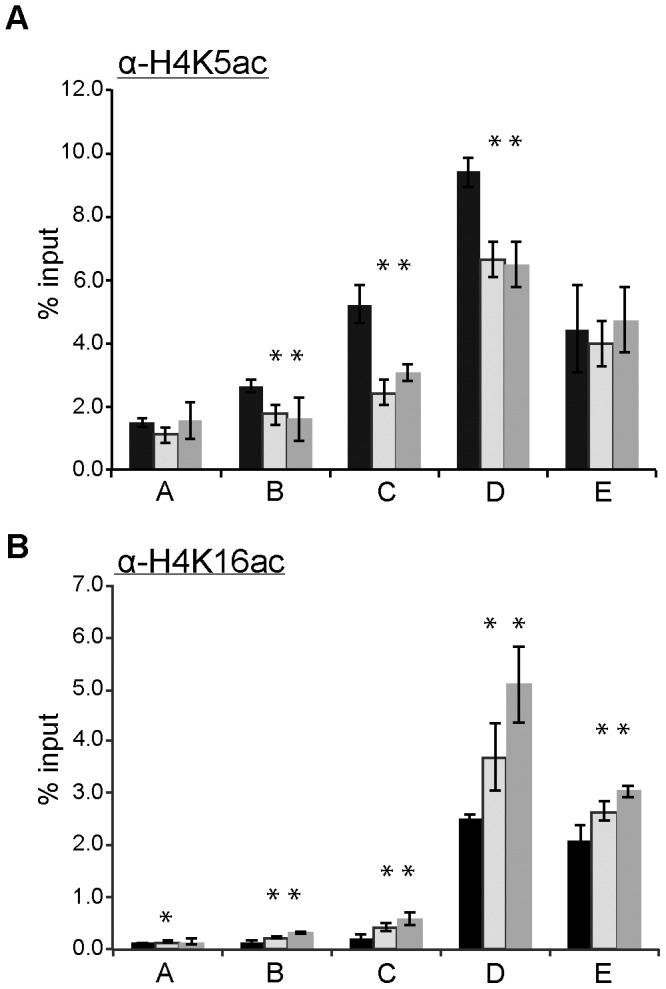
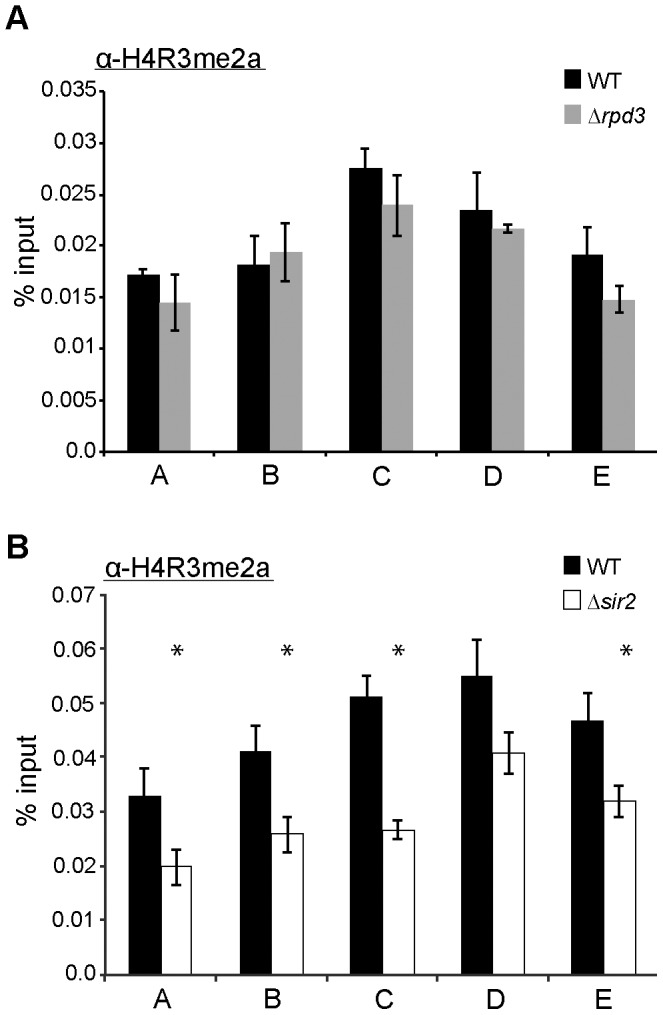
In the yeast Saccharomyces cerevisiae, the establishment and maintenance of silent chromatin at the telomere requires a delicate balance between opposing activities of histone modifying enzymes. Previously, we demonstrated that the protein arginine methyltransferase Hmt1 plays a role in the formation of yeast silent chromatin. To better understand the nature of the Hmt1 interactions that contribute to this phenomenon, we carried out a systematic reverse genetic screen using a null allele of HMT1 and the synthetic genetic array (SGA) methodology. This screen revealed interactions between HMT1 and genes encoding components of the histone deacetylase complex Rpd3L (large). A double mutant carrying both RPD3 and HMT1 deletions display increased telomeric silencing and Sir2 occupancy at the telomeric boundary regions, when comparing to a single mutant carrying Hmt1-deletion only. However, the dual rpd3/hmt1-null mutant behaves like the rpd3-null single mutant with respect to silencing behavior, indicating that RPD3 is epistatic to HMT1. Mutants lacking either Hmt1 or its catalytic activity display an increase in the recruitment of histone deacetylase Rpd3 to the telomeric boundary regions. Moreover, in such loss-of-function mutants the levels of acetylated H4K5, which is a substrate of Rpd3, are altered at the telomeric boundary regions. In contrast, the level of acetylated H4K16, a target of the histone deacetylase Sir2, was increased in these regions. Interestingly, mutants lacking either Rpd3 or Sir2 display various levels of reduction in dimethylated H4R3 at these telomeric boundary regions. Together, these data provide insight into the mechanism whereby Hmt1 promotes the proper establishment and maintenance of silent chromatin at the telomeres.
Conflict of interest statement
Figures

Similar articles
-
Rpd3-dependent boundary formation at telomeres by removal of Sir2 substrate.Proc Natl Acad Sci U S A. 2010 Mar 23;107(12):5522-7. doi: 10.1073/pnas.0909169107. Epub 2010 Jan 19. Proc Natl Acad Sci U S A. 2010. PMID: 20133733 Free PMC article.
-
Histone Deacetylases with Antagonistic Roles in Saccharomyces cerevisiae Heterochromatin Formation.Genetics. 2016 Sep;204(1):177-90. doi: 10.1534/genetics.116.190835. Epub 2016 Aug 3. Genetics. 2016. PMID: 27489001 Free PMC article.
-
Histone deacetylase Rpd3 antagonizes Sir2-dependent silent chromatin propagation.Nucleic Acids Res. 2009 Jun;37(11):3699-713. doi: 10.1093/nar/gkp233. Epub 2009 Apr 16. Nucleic Acids Res. 2009. PMID: 19372273 Free PMC article.
-
Long-range silencing and position effects at telomeres and centromeres: parallels and differences.Cell Mol Life Sci. 2003 Nov;60(11):2303-18. doi: 10.1007/s00018-003-3246-x. Cell Mol Life Sci. 2003. PMID: 14625677 Free PMC article. Review.
-
Recent developments in yeast aging.PLoS Genet. 2007 May 25;3(5):e84. doi: 10.1371/journal.pgen.0030084. PLoS Genet. 2007. PMID: 17530929 Free PMC article. Review.
Cited by
-
Correction: Recruitment of Rpd3 to the telomere depends on the protein arginine methyltransferase Hmt1.PLoS One. 2015 Mar 20;10(3):e0120968. doi: 10.1371/journal.pone.0120968. eCollection 2015. PLoS One. 2015. PMID: 25793372 Free PMC article. No abstract available.
-
Revealing the regulatory impact of nutrient on the production of (R)-2-(4-Hydroxyphenoxy)propanoic acid by Beauveria bassiana biofilms through comparative transcriptomics analyse.Bioprocess Biosyst Eng. 2024 Nov;47(11):1803-1814. doi: 10.1007/s00449-024-03070-9. Epub 2024 Jul 30. Bioprocess Biosyst Eng. 2024. PMID: 39080012
-
Histone Chaperone Paralogs Have Redundant, Cooperative, and Divergent Functions in Yeast.Genetics. 2019 Dec;213(4):1301-1316. doi: 10.1534/genetics.119.302235. Epub 2019 Oct 11. Genetics. 2019. PMID: 31604797 Free PMC article.
-
Genomic insights of protein arginine methyltransferase Hmt1 binding reveals novel regulatory functions.BMC Genomics. 2012 Dec 26;13:728. doi: 10.1186/1471-2164-13-728. BMC Genomics. 2012. PMID: 23268696 Free PMC article.
References
-
- Grewal SI, Moazed D (2003) Heterochromatin and epigenetic control of gene expression. Science 301: 798–802. - PubMed
-
- Rusche LN, Kirchmaier AL, Rine J (2003) The establishment, inheritance, and function of silenced chromatin in Saccharomyces cerevisiae. Annu Rev Biochem 72: 481–516. - PubMed
-
- Berger SL (2007) The complex language of chromatin regulation during transcription. Nature 447: 407–412. - PubMed
-
- Kouzarides T (2007) Chromatin modifications and their function. Cell 128: 693–705. - PubMed
Publication types
MeSH terms
Substances
LinkOut - more resources
Full Text Sources
Molecular Biology Databases
