. 2012:2:630.
doi: 10.1038/srep00630. Epub 2012 Sep 5.

Optimizing functional network representation of multivariate time series

Affiliations

Optimizing functional network representation of multivariate time series

Massimiliano Zanin et al. Sci Rep. 2012.

Abstract

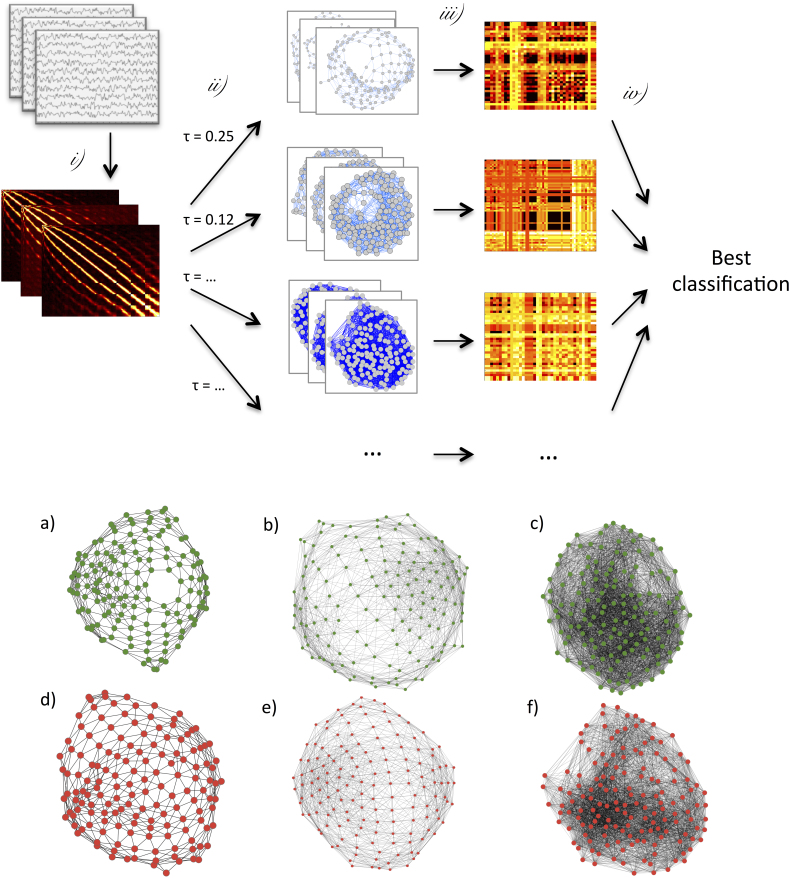
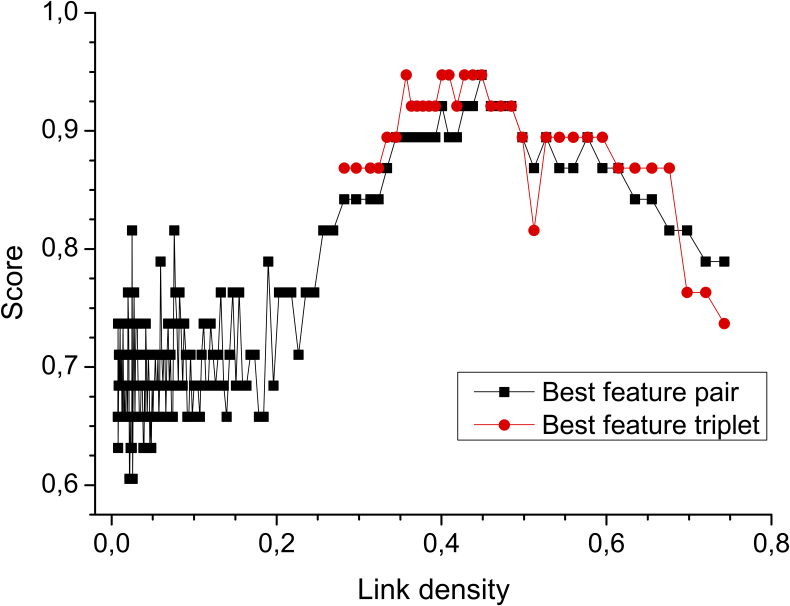
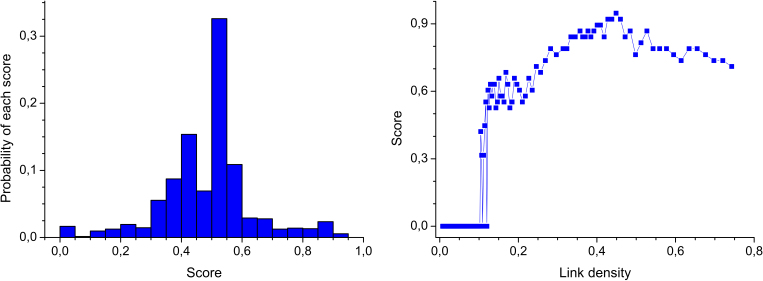
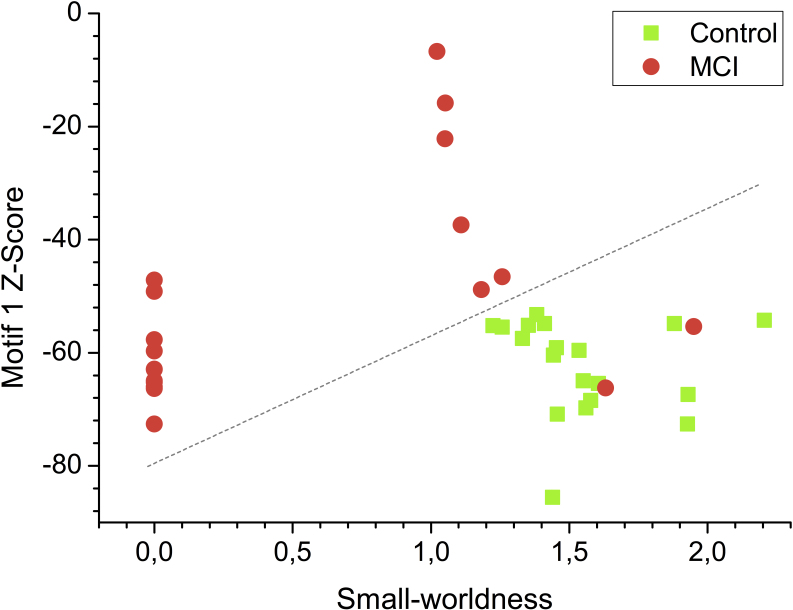
By combining complex network theory and data mining techniques, we provide objective criteria for optimization of the functional network representation of generic multivariate time series. In particular, we propose a method for the principled selection of the threshold value for functional network reconstruction from raw data, and for proper identification of the network's indicators that unveil the most discriminative information on the system for classification purposes. We illustrate our method by analysing networks of functional brain activity of healthy subjects, and patients suffering from Mild Cognitive Impairment, an intermediate stage between the expected cognitive decline of normal aging and the more pronounced decline of dementia. We discuss extensions of the scope of the proposed methodology to network engineering purposes, and to other data mining tasks.


Figures

Figure 1
Figure 1. Schematic representation of the network reconstruction process, and examples of the obtained functional networks.
(Top) Sketch of the four phases of the reconstruction process. i) Creation of a weighted clique from multivariate time series, by means of some applicable metric; ii) Transformation of the weighted clique to a set of un-weighted adjacency matrices (representing functional networks) by means of different thresholds; iii) extraction of a set of features for each network, and calculation of all classification scores; iv) selection of the best threshold to be used in step ii), and of the best combination of features. (Bottom) Examples of six networks extracted from the MCI data set (see Methods for details). Networks in green (in red) correspond to healthy (MCI) subjects. The functional networks are those obtained at three different thresholds: (a,d) τ = 0.19 (corresponding to a link density of 0.05), (b,e) τ = 0.1 (link density 0.2), and (c,f) τ = 0.069 (link density 0.43).
Figure 2
Figure 2. Classification score as a function of the link density.
Black (red) points indicate the best classification score obtained using pairs (triplets) of features. Best classification results appear at high link density, i.e., at rather dense networks, indicating that links associated to low correlations are actually codifying relevant information.
Figure 3
Figure 3. Relevance and stability of the classification results.
(Left Panel) Histogram of the score values obtained with pairs of features for the best threshold value (0.069). (Right Panel) Score obtained with the best feature triplet (i.e., small-worldness, motif 1 ZScore, and entropy of centrality distribution) at different thresholds.
Figure 4
Figure 4. Classification of MCI and healthy patients.
Green (red) points represent the position in the space of features of healthy (MCI) patients. The graph depicts the best classification obtained with the selected pair of features.

References

    1. Boccaletti S., Latora V., Moreno Y., Chavez M. & Hwang D. Complex networks: Structure and dynamics. Phys. Rep. 424, 175–308 (2006).
    1. Amaral L. A. N. & Ottino J. M. Complex networks - Augmenting the framework for the study of complex systems. Eur. Phys. J. B 38, 147–162 (2004).
    1. Castellano C., Fortunato S. & Loreto V. Statistical physics of social dynamics. Rev. Mod. Phys. 81, 591 (2009).
    1. Bullmore E. T. & Sporns O. Complex brain networks: graph theoretical analysis of structural and functional systems. Nat. Rev. Neurosci. 10, 186–198 (2009). - PubMed
    1. Eguíluz V. M., Chialvo D. R., Cecchi G. A., Baliki M. & Apkarian A. V. Scale-free brain functional networks. Phys. Rev. Lett. 94, 018102 (2005). - PubMed

Publication types