

Increased phosphoenolpyruvate carboxykinase gene expression and steatosis during hepatitis C virus subgenome replication: role of nonstructural component 5A and CCAAT/enhancer-binding protein β
- PMID: 22955269
- PMCID: PMC3481331
- DOI: 10.1074/jbc.M112.384743
Increased phosphoenolpyruvate carboxykinase gene expression and steatosis during hepatitis C virus subgenome replication: role of nonstructural component 5A and CCAAT/enhancer-binding protein β
Abstract
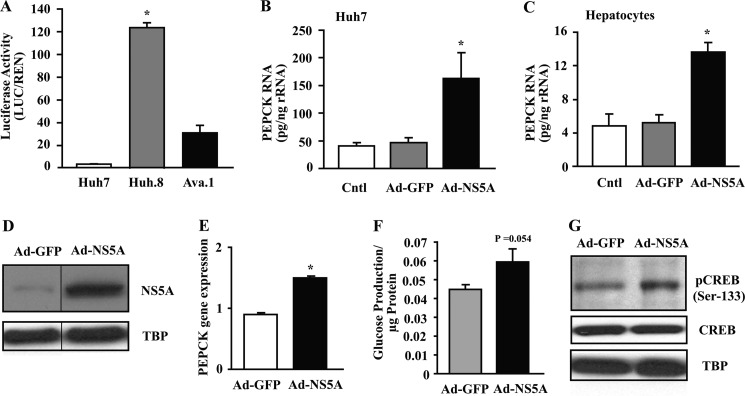
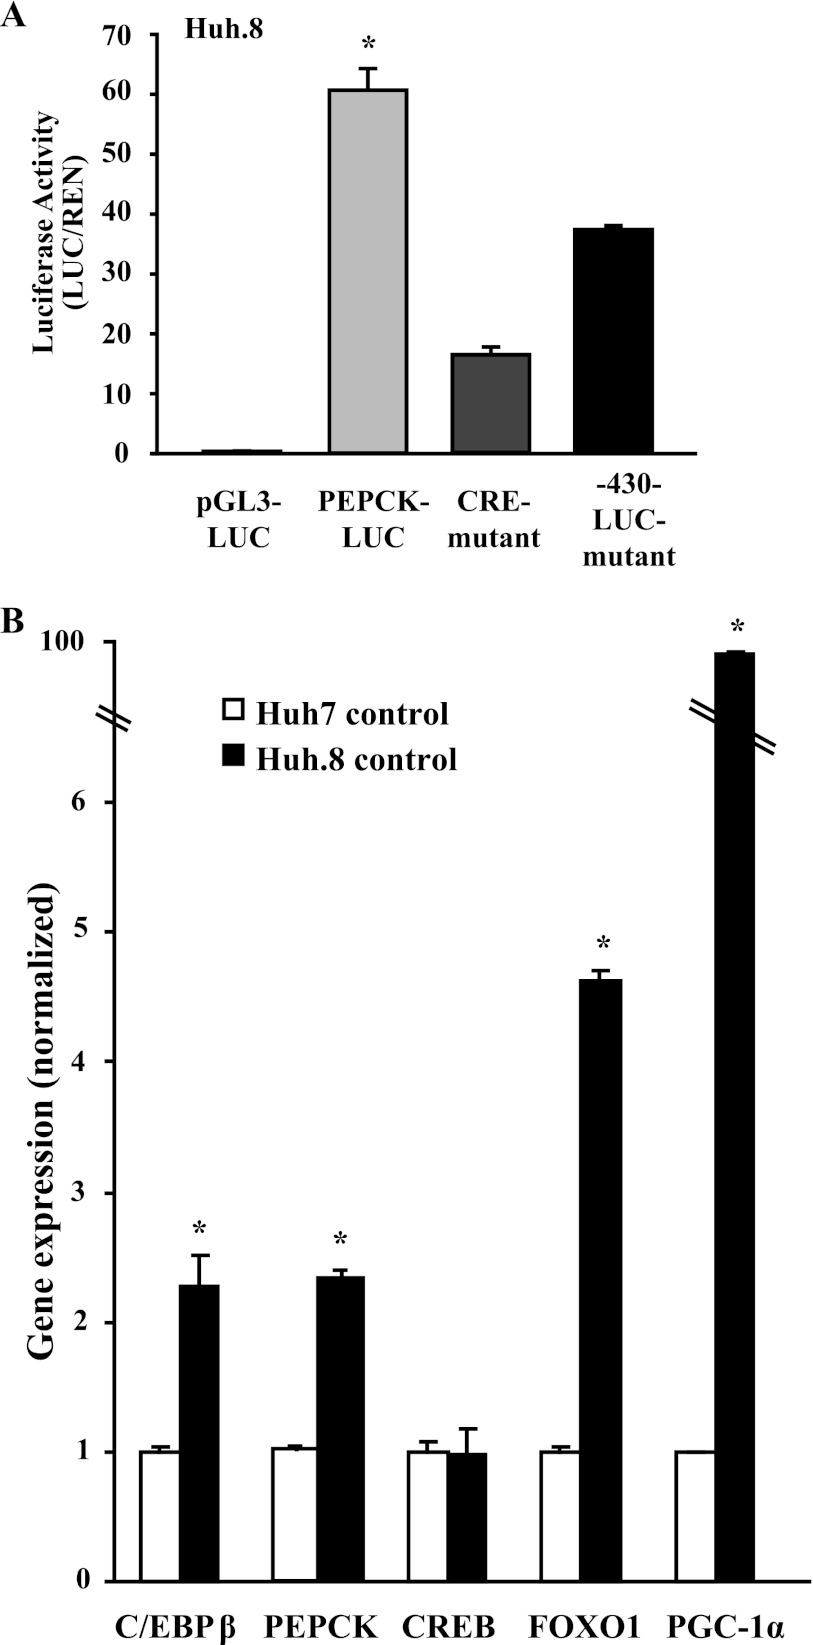
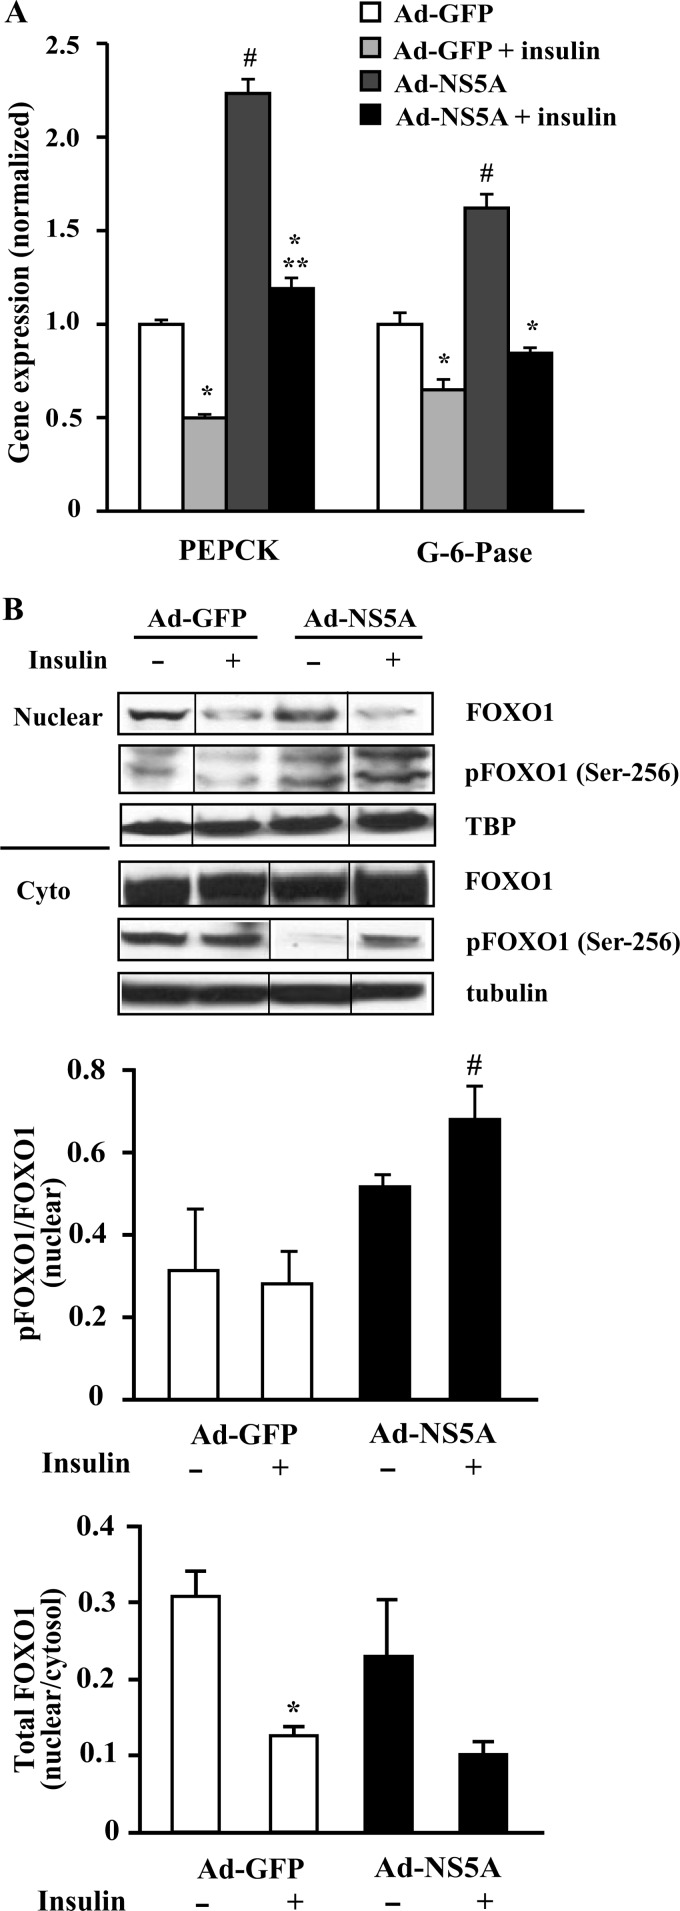
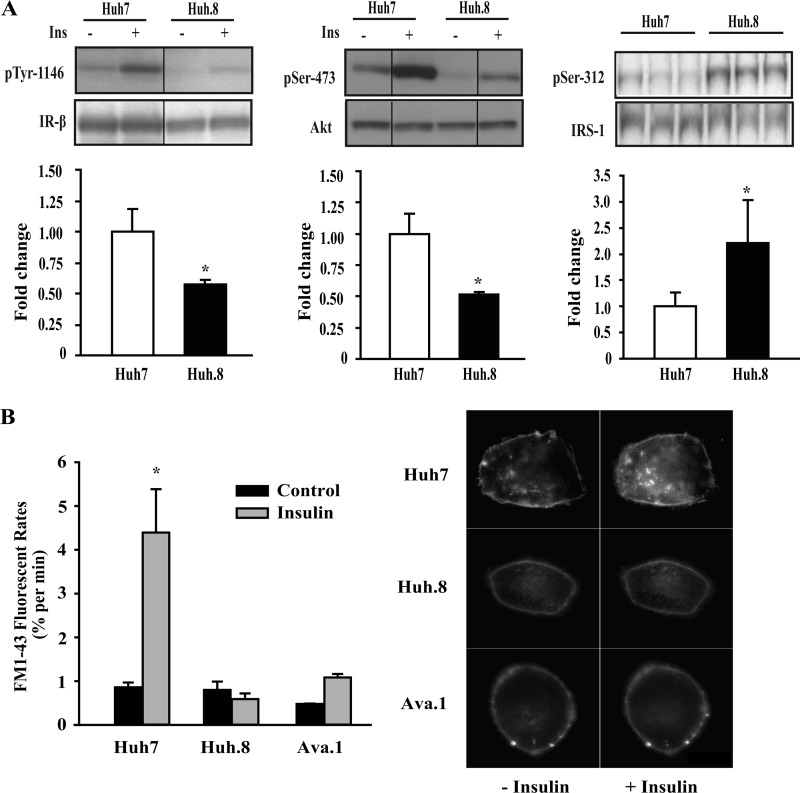
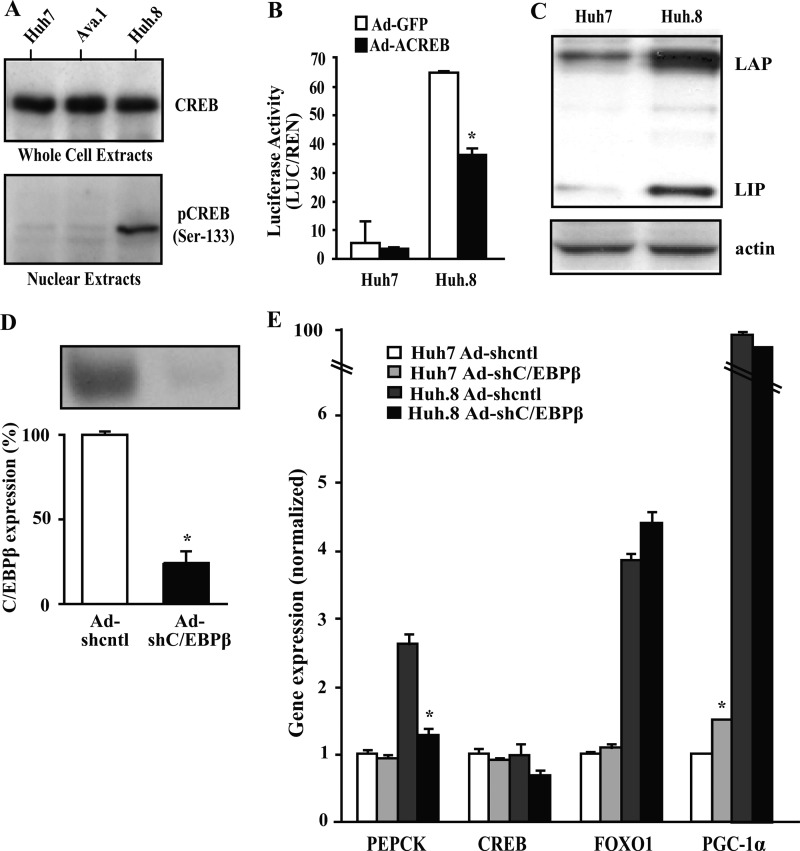
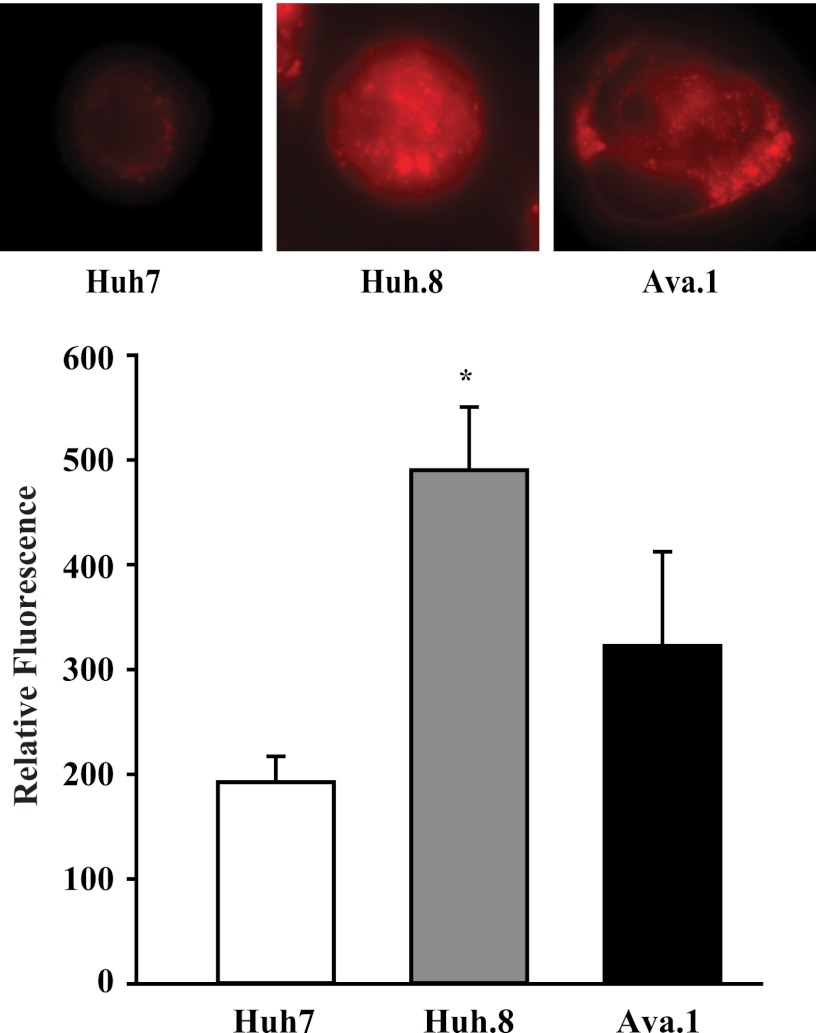
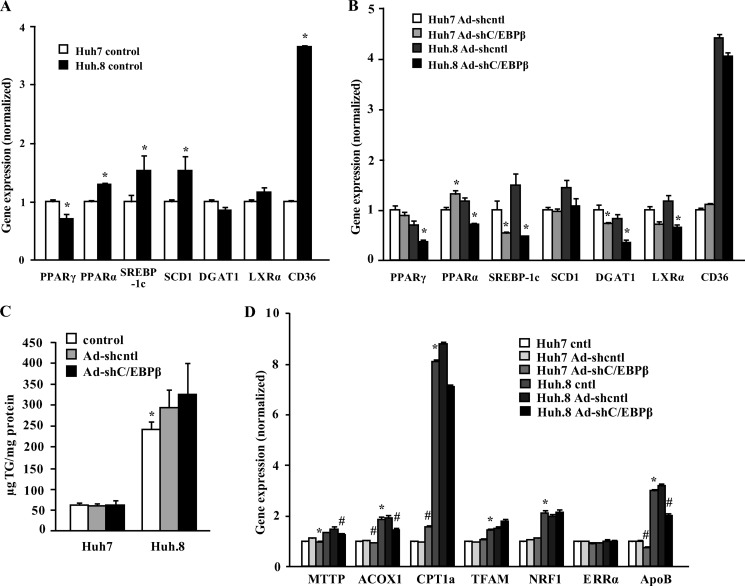
Chronic hepatitis C virus (HCV) infection greatly increases the risk for type 2 diabetes and nonalcoholic steatohepatitis; however, the pathogenic mechanisms remain incompletely understood. Here we report gluconeogenic enzyme phosphoenolpyruvate carboxykinase (PEPCK) transcription and associated transcription factors are dramatically up-regulated in Huh.8 cells, which stably express an HCV subgenome replicon. HCV increased activation of cAMP response element-binding protein (CREB), CCAAT/enhancer-binding protein (C/EBPβ), forkhead box protein O1 (FOXO1), and peroxisome proliferator-activated receptor γ coactivator 1α (PGC-1α) and involved activation of the cAMP response element in the PEPCK promoter. Infection with dominant-negative CREB or C/EBPβ-shRNA significantly reduced or normalized PEPCK expression, with no change in PGC-1α or FOXO1 levels. Notably, expression of HCV nonstructural component NS5A in Huh7 or primary hepatocytes stimulated PEPCK gene expression and glucose output in HepG2 cells, whereas a deletion in NS5A reduced PEPCK expression and lowered cellular lipids but was without effect on insulin resistance, as demonstrated by the inability of insulin to stimulate mobilization of a pool of insulin-responsive vesicles to the plasma membrane. HCV-replicating cells demonstrated increases in cellular lipids with insulin resistance at the level of the insulin receptor, increased insulin receptor substrate 1 (Ser-312), and decreased Akt (Ser-473) activation in response to insulin. C/EBPβ-RNAi normalized lipogenic genes sterol regulatory element-binding protein-1c, peroxisome proliferator-activated receptor γ, and liver X receptor α but was unable to reduce accumulation of triglycerides in Huh.8 cells or reverse the increase in ApoB expression, suggesting a role for increased lipid retention in steatotic hepatocytes. Collectively, these data reveal an important role of NS5A, C/EBPβ, and pCREB in promoting HCV-induced gluconeogenic gene expression and suggest that increased C/EBPβ and NS5A may be essential components leading to increased gluconeogenesis associated with HCV infection.
Figures

Similar articles
-
Hepatitis C virus NS5A protein enhances gluconeogenesis through upregulation of Akt-/JNK-PEPCK signalling pathways.Liver Int. 2014 Oct;34(9):1358-68. doi: 10.1111/liv.12389. Liver Int. 2014. PMID: 25360475
-
Endocannabinoid system activation contributes to glucose metabolism disorders of hepatocytes and promotes hepatitis C virus replication.Int J Infect Dis. 2014 Jun;23:75-81. doi: 10.1016/j.ijid.2013.12.017. Epub 2014 Apr 2. Int J Infect Dis. 2014. PMID: 24704332
-
Endoplasmic reticulum stress links hepatitis C virus RNA replication to wild-type PGC-1α/liver-specific PGC-1α upregulation.J Virol. 2014 Aug;88(15):8361-74. doi: 10.1128/JVI.01202-14. Epub 2014 May 14. J Virol. 2014. PMID: 24829353 Free PMC article.
-
[Hepatitis C virus-induced glucose metabolic disorder].Uirusu. 2015;65(2):263-268. doi: 10.2222/jsv.65.263. Uirusu. 2015. PMID: 27760925 Review. Japanese.
-
The mitochondrial isoform of phosphoenolpyruvate carboxykinase (PEPCK-M) and glucose homeostasis: has it been overlooked?Biochim Biophys Acta. 2014 Apr;1840(4):1313-30. doi: 10.1016/j.bbagen.2013.10.033. Epub 2013 Oct 28. Biochim Biophys Acta. 2014. PMID: 24177027 Free PMC article. Review.
Cited by
-
Hepatitis C virus nonstructural protein 5A perturbs lipid metabolism by modulating AMPK/SREBP-1c signaling.Lipids Health Dis. 2019 Nov 4;18(1):191. doi: 10.1186/s12944-019-1136-y. Lipids Health Dis. 2019. PMID: 31684957 Free PMC article.
-
Molecular Mechanisms Driving Progression of Liver Cirrhosis towards Hepatocellular Carcinoma in Chronic Hepatitis B and C Infections: A Review.Int J Mol Sci. 2019 Mar 18;20(6):1358. doi: 10.3390/ijms20061358. Int J Mol Sci. 2019. PMID: 30889843 Free PMC article. Review.
-
What role for cellular metabolism in the control of hepatitis viruses?Front Immunol. 2022 Nov 17;13:1033314. doi: 10.3389/fimmu.2022.1033314. eCollection 2022. Front Immunol. 2022. PMID: 36466918 Free PMC article. Review.
-
Hepatitis C virus infection induces inflammatory cytokines and chemokines mediated by the cross talk between hepatocytes and stellate cells.J Virol. 2013 Jul;87(14):8169-78. doi: 10.1128/JVI.00974-13. Epub 2013 May 15. J Virol. 2013. PMID: 23678168 Free PMC article.
-
Transcriptome analysis of duck liver and identification of differentially expressed transcripts in response to duck hepatitis A virus genotype C infection.PLoS One. 2013 Jul 29;8(7):e71051. doi: 10.1371/journal.pone.0071051. Print 2013. PLoS One. 2013. PMID: 23923051 Free PMC article.
References
-
- Ray Kim W. (2002) Global epidemiology and burden of hepatitis C. Microbes Infect. 4, 1219–1225 - PubMed
-
- Monto A., Alonzo J., Watson J. J., Grunfeld C., Wright T. L. (2002) Steatosis in chronic hepatitis C. Relative contributions of obesity, diabetes mellitus, and alcohol. Hepatology 36, 729–736 - PubMed
-
- Ortiz V., Berenguer M., Rayón J. M., Carrasco D., Berenguer J. (2002) Contribution of obesity to hepatitis C-related fibrosis progression. Am. J. Gastroenterol. 97, 2408–2414 - PubMed
-
- Thuluvath P. J., John P. R. (2003) Association between hepatitis C, diabetes mellitus, and race. A case-control study. Am. J. Gastroenterol. 98, 438–441 - PubMed
-
- Wang C. S., Wang S. T., Yao W. J., Chang T. T., Chou P. (2003) Community-based study of hepatitis C virus infection and type 2 diabetes. An association affected by age and hepatitis severity status. Am. J. Epidemiol. 158, 1154–1160 - PubMed
Publication types
MeSH terms
Substances
Grants and funding
LinkOut - more resources
Full Text Sources
Research Materials
Miscellaneous
