

Immunoglobulin heavy/light chain ratios improve paraprotein detection and monitoring, identify residual disease and correlate with survival in multiple myeloma patients
- PMID: 22955329
- PMCID: PMC3542627
- DOI: 10.1038/leu.2012.197
Immunoglobulin heavy/light chain ratios improve paraprotein detection and monitoring, identify residual disease and correlate with survival in multiple myeloma patients
Erratum in
- Leukemia. 2013 Apr;27(4):996
Abstract
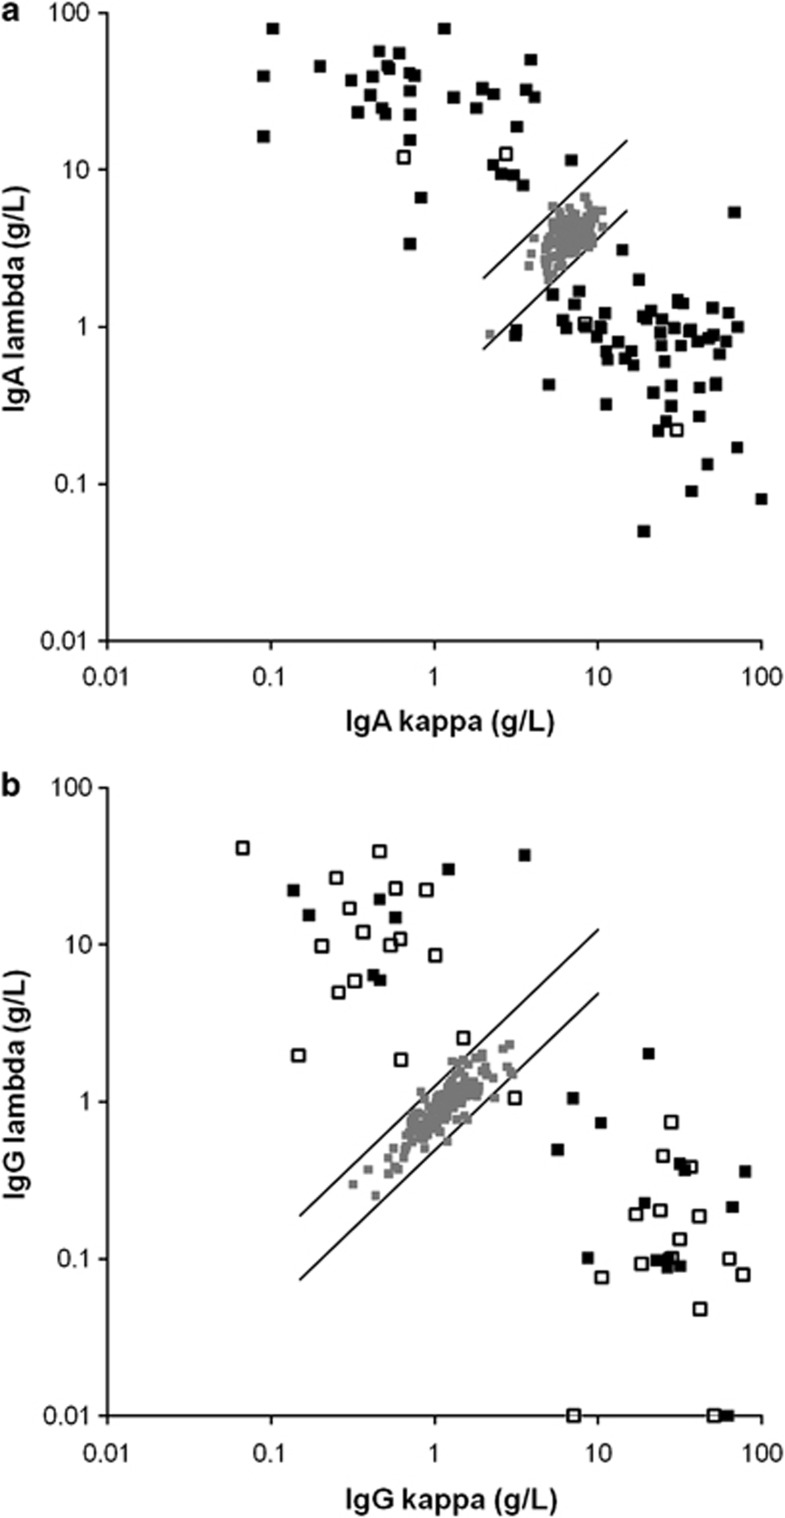
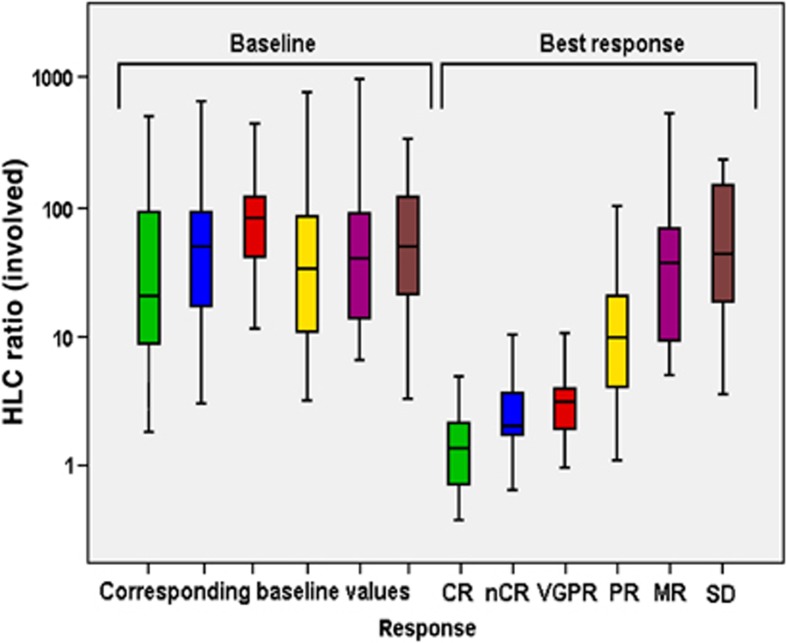
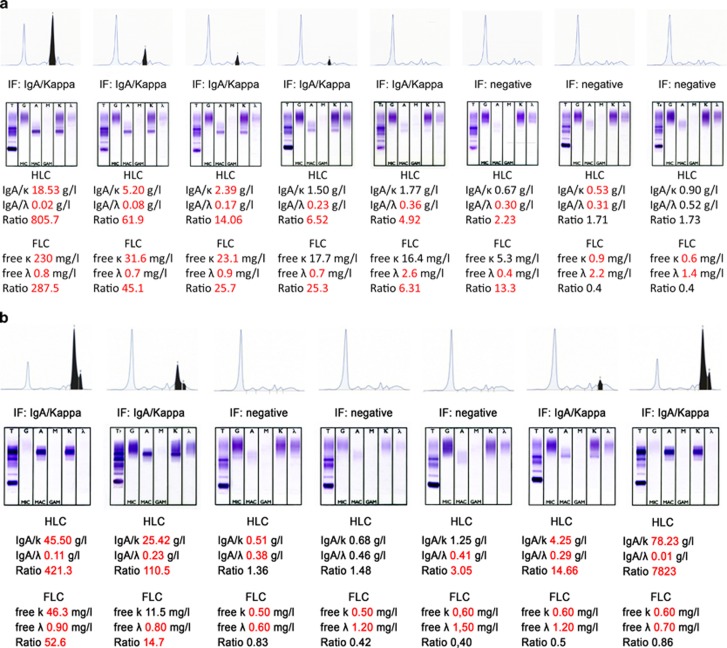
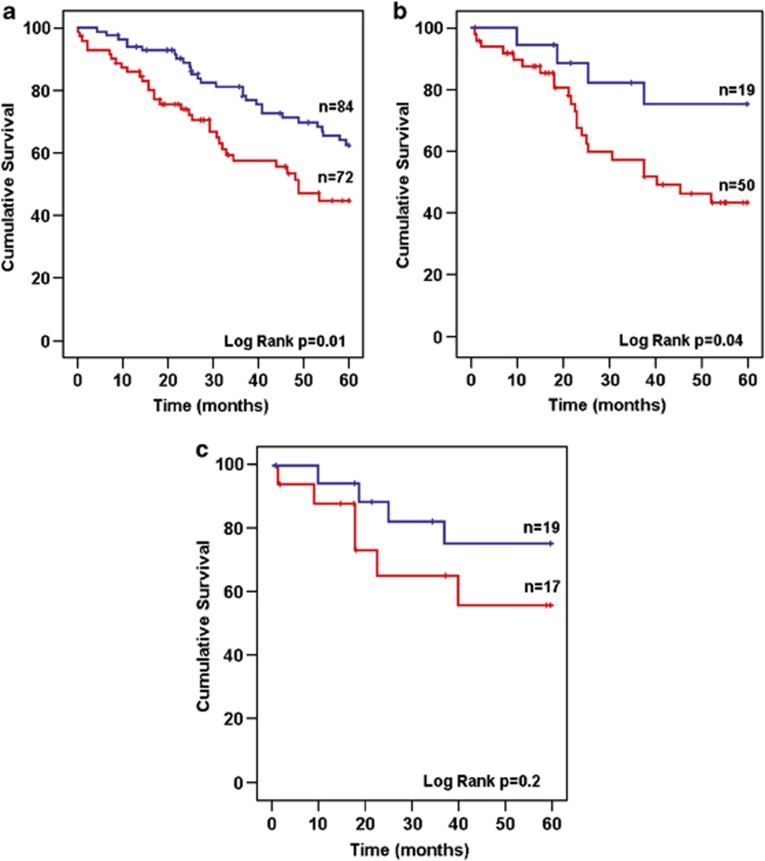
The novel heavy/light chain (HLC) assay was used for the detection and measurement of monoclonal immunoglobulins, response evaluation and prognostication. This test allows identification and quantification of the different light chain types of each immunoglobulin class (for example, IgGκ and IgGλ) and enables calculation of ratios of monoclonal/polyclonal immunoglobulin (HLC ratio). Sequential sera of 156 patients with IgG or IgA myeloma started on first-line therapy and followed for a median of 46.1 months were analyzed. Results were compared with those obtained with conventional techniques (serum protein electrophoresis (SPEP), immunofixation electrophoresis (IFE), nephelometry (NEPH), and the free light chain test (FLC)). Our data show that the HLC assay allowed quantification of monoclonal proteins not accurately measurable by SPEP or NEPH. When both HLC and FLC testing were applied for response assessment, clonal excess was noted in 14/31 patients with complete response (CR). HLC ratio indicated presence of disease in 8/31 patients who achieved CR and, in sequential studies indicated evolving relapse in three patients before IFE became positive. Highly abnormal HLC ratios at presentation were significantly associated with shorter overall survival (40.5 months vs median not reached, P=0.016). Multivariate analysis revealed HLC ratio (P=0.03) and β(2)-microglobulin (P<0.01) as independent risk factors for survival.
Figures
Similar articles
-
Heavy/light chain assay in the monitoring of multiple myeloma.Pathology. 2019 Aug;51(5):507-511. doi: 10.1016/j.pathol.2019.04.002. Epub 2019 Jun 25. Pathology. 2019. PMID: 31253381
-
Heavy/light chain specific immunoglobulin ratios provides no additional information than serum proteins electrophoresis and immunofixation for the diagnosis and the follow-up of intact immunoglobulin multiple myeloma patients.Pathol Biol (Paris). 2015 Sep;63(4-5):215-21. doi: 10.1016/j.patbio.2015.06.001. Epub 2015 Aug 28. Pathol Biol (Paris). 2015. PMID: 26319969 Clinical Trial.
-
Monitoring IgA multiple myeloma: immunoglobulin heavy/light chain assays.Clin Chem. 2015 Feb;61(2):360-7. doi: 10.1373/clinchem.2014.231985. Epub 2014 Dec 1. Clin Chem. 2015. PMID: 25451866
-
Immunoglobulin heavy chain/light chain pairs (HLC, Hevylite™) assays for diagnosing and monitoring monoclonal gammopathies.Adv Clin Exp Med. 2014 Jan-Feb;23(1):127-33. doi: 10.17219/acem/37036. Adv Clin Exp Med. 2014. PMID: 24596015 Review.
-
Benefits of new immunoglobulin-derived biomarkers for the diagnosis and follow-up of patients with dysglobulinemia.Ann Biol Clin (Paris). 2016 Oct 1;74(5):597-605. doi: 10.1684/abc.2016.1180. Ann Biol Clin (Paris). 2016. PMID: 27707674 Review. English.
Cited by
-
RANKL-induced c-Src activation contributes to conventional anti-cancer drug resistance and dasatinib overcomes this resistance in RANK-expressing multiple myeloma cells.Clin Exp Med. 2019 Feb;19(1):133-141. doi: 10.1007/s10238-018-0531-4. Epub 2018 Oct 5. Clin Exp Med. 2019. PMID: 30291461
-
Deep Response in Multiple Myeloma: A Critical Review.Biomed Res Int. 2015;2015:832049. doi: 10.1155/2015/832049. Epub 2015 Dec 10. Biomed Res Int. 2015. PMID: 26783530 Free PMC article. Review.
-
Polyclonal Immunoglobulin Recovery after Autologous Stem Cell Transplantation Is an Independent Prognostic Factor for Survival Outcome in Patients with Multiple Myeloma.Cancers (Basel). 2019 Dec 18;12(1):12. doi: 10.3390/cancers12010012. Cancers (Basel). 2019. PMID: 31861479 Free PMC article.
-
The clinical utility of serum free light chain and heavy/light chain assays in monitoring disease activity in patients with IgG myeloma after achieving a deep response.Clin Case Rep. 2017 Nov 28;6(1):96-102. doi: 10.1002/ccr3.1304. eCollection 2018 Jan. Clin Case Rep. 2017. PMID: 29375846 Free PMC article.
-
A CD138-independent strategy to detect minimal residual disease and circulating tumour cells in multiple myeloma.Br J Haematol. 2016 Apr;173(1):70-81. doi: 10.1111/bjh.13927. Epub 2016 Jan 5. Br J Haematol. 2016. PMID: 26729247 Free PMC article.
References
-
- Harousseau JL, Attal M, Avet-Loiseau H, Margit G, Caillot D, Mohty M, et al. Bortezomib plus dexamethasone is superior to vincristine plus doxorubicin plus dexamethasone as induction treatment prior to autologous stem-cell transplantation in newly diagnosed multiple myeloma: results of the IFM 2005-01 phase III trial. J Clin Oncol. 2010;28:4621–4629. - PubMed
-
- Paiva B, Almeida J, Pérez-Andrés M, Mateo G, López A, Rasillo A, et al. Utility of flow cytometry immunophenotyping in multiple myeloma and other clonal plasma cell-related disorders. Cytometry B Clin Cytom. 2010;78:239–252. - PubMed
-
- Jacobson DR, Zolla-Pazner S. Immunosuppression and infection in multiple myeloma. Semin Oncol. 1986;13:282–290. - PubMed
-
- Dimopoulos M, Kyle R, Fermand JP, Rajkumar SV. San Miguel J, Chanan-Khan A et al. Consensus recommendations for standard investigative workup: report of the International Myeloma Workshop Consensus Panel 3. Blood. 2011;117:4701–4705. - PubMed
-
- Murray DL, Ryu E, Snyder MR, Katzmann JA. Quantitation of serum monoclonal proteins: relationship between agarose gel electropheresis and immunonephelometry. Clin Chem. 2009;55:1523–1529. - PubMed
Publication types
MeSH terms
Substances
LinkOut - more resources
Full Text Sources
Other Literature Sources
Medical
Research Materials
Miscellaneous
