The accessible chromatin landscape of the human genome

Robert E Thurman et al. Nature. .

Abstract

DNase I hypersensitive sites (DHSs) are markers of regulatory DNA and have underpinned the discovery of all classes of cis-regulatory elements including enhancers, promoters, insulators, silencers and locus control regions. Here we present the first extensive map of human DHSs identified through genome-wide profiling in 125 diverse cell and tissue types. We identify ∼2.9 million DHSs that encompass virtually all known experimentally validated cis-regulatory sequences and expose a vast trove of novel elements, most with highly cell-selective regulation. Annotating these elements using ENCODE data reveals novel relationships between chromatin accessibility, transcription, DNA methylation and regulatory factor occupancy patterns. We connect ∼580,000 distal DHSs with their target promoters, revealing systematic pairing of different classes of distal DHSs and specific promoter types. Patterning of chromatin accessibility at many regulatory regions is organized with dozens to hundreds of co-activated elements, and the transcellular DNase I sensitivity pattern at a given region can predict cell-type-specific functional behaviours. The DHS landscape shows signatures of recent functional evolutionary constraint. However, the DHS compartment in pluripotent and immortalized cells exhibits higher mutation rates than that in highly differentiated cells, exposing an unexpected link between chromatin accessibility, proliferative potential and patterns of human variation.


Conflict of interest statement

Competing Interests

The authors declare no competing interests.

Figures
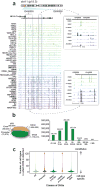
Figure 1
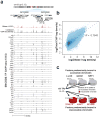
Figure 1. General features of the DHS landscape
a, Density of DNaseI cleavage sites for selected cell types, shown for an example ~350 kb region. Two regions are shown to the right in greater detail. b, Left, distribution of 2,890,742 DHSs with respect to Gencode gene annotations. Promoter DHSs are defined as the first DHS localizing within 1 kb upstream of a Gencode TSS. Right, distribution of intergenic DHSs relative to Gencode TSSs. c, Distributions of the number of cell types, from 1 to 125 (y-axis), in which DHSs in each of four classes (x-axis) are observed. Width of each shape at a given y-value shows the relative frequency of DHSs present in that number of cell types.
Figure 2
Figure 2. Transcription factor drivers of chromatin accessibility
a, DNaseI tag density is shown in red for a 175 kb region of Chr19. Below, normalized ChIP-seq tag density for 45 ENCODE ChIP-seq experiments from K562 cells, with a cumulative sum of the individual tag density tracks shown immediately below the K562 DNaseI data. b, Genome-wide correlation (R = 0.7943) between ChIP-seq and DNaseI tag densities (log10) in K562 cells. c, Left, 94.4% of a combined 1,108,081 ChIP-seq peaks from all TFs assayed in K562 cells fall within accessible chromatin (grey pie areas). Top, three examples of TFs localizing almost exclusively within accessible chromatin. Bottom, three factors from the KRAB-associated complex localizing partially or predominantly within inaccessible chromatin
Figure 3
Figure 3. Identification and directional classification of novel promoters
a, DNaseI (blue) and H3K4me3 (red) tag densities for K562 cells around annotated TSS of ACTR3B. b, Averaged H3K4me3 tag density (red, right y-axis) and log DNaseI tag density (blue, left y-axis) across 10,000 randomly selected Gencode TSSs, oriented 5’→3’. Each blue and red curve is for a different cell-type, showing invariance of the pattern. c, Relation of 113,615 promoter predictions to Gencode annotations, with supporting EST and CAGE evidence (bar at right). d-f, Examples of novel promoters identified in K562; red arrow marks predicted TSS and direction of transcription, with CAGE tag clusters, spliced ESTs and Gencode annotations above. d, Novel TSS confirmed by CAGE and ESTs. e, Novel TSS confirmed by CAGE, no ESTs. Note intronic location. f, Antisense prediction within annotated gene.
Figure 4
Figure 4. Chromatin accessibility and DNA methylation patterns
a, DNaseI sensitivity in 19 cell types with ENCODE Reduced Representation Bisulfite Sequencing data. Inset box: accessibility (y-axis) decreases quantitatively as methylation increases. Other DHSs (right) show low correlation between accessibility and methylation. CpG methylation scale: Green, 0%; yellow, 50%; red, 100%. b, Model of TF-driven methylation patterns in which methylation passively mirrors TF occupancy. c, Relationship between TF transcript levels and overall methylation at cognate recognition sequences of the same TFs. Lymphoid regulators in B-lymphoblastoid line GM06990 (left) and erythroid regulators in the erythroleukemia line K562 (right). Negative correlation indicates that site-specific DNA methylation follows TF vacation of differentially expressed TFs.
Figure 5
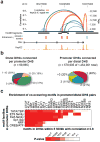
Figure 5. A genome-wide map of distal DHS-to-promoter connectivity
a, Cross-cell-type correlation (red arcs, left y-axis) of distal DHSs and PAH promoter closely parallels chromatin interactions measured by 5C-seq (blue arcs, right y-axis); black bars indicate HindIII fragments used in 5C assays. Known (green) and novel (magenta) enhancers confirmed in transfection assays are shown below. Enhancer at far right is not separable by 5C since it lies within the HindIII fragment containing the promoter. b, Left, proportions of 69,965 promoters correlated (R > 0.7) with 0 to >20 DHSs within 500 kb. Right, proportions of 578,905 non-promoter DHSs (out of 1,454,901) correlated with 1 to >3 promoters within 500 kb. c, Pairing of canonical promoter families with specific motifs in distal DHSs.
Figure 6
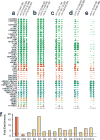
Figure 6. Stereotyped regulation of chromatin accessibility
(a)-(e), Enhancers grouped by similar chromatin stereotypes. HS2 from the beta-globin locus control region is at left. E1-E11 represent progressively weaker matches to the HS2 stereotype. E12-13 derive from matches to a different stereotype based on another K562 enhancer. (f), Experimental validation of enhancers detected by pattern matching. Bars indicate fold-enrichment observed in transient assays in K562 relative to promoter-only control; mean of testing in both orientations is shown. Red bars = data from two potent in vivo enhancers, beta-globin LCR HS2 and HS3; the latter requires chromatinization to function and is not active in transient assays. Gold bars = data from E1-E13 from (a)-(e) above.
Figure 7
Figure 7. Genetic variation in regulatory DNA linked to mutation rate
a, Mean nucleotide diversity (π, y-axis) in DHSs of 97 diverse cell types (x-axis) estimated using whole-genome sequencing data from 53 unrelated individuals. Cell types are ordered left-to-right by increasing mean π. Horizontal blue bar shows 95% confidence intervals on mean π in a background model of four-fold degenerate coding sites. Note the enrichment of immortal cells at right. b, Mean π (left y-axis) for pluripotent (yellow) vs. malignancy-derived (red) vs. normal cells (light green), plotted side-by-side with human-chimp divergence (right y-axis) computed on the same groups. Boxes indicate 25-75%-iles, with medians highlighted. c, Both low- and high-frequency derived alleles show the same effect. Density of SNPs in DHSs with derived allele frequency (DAF) <5% (x-axis) is tightly correlated (R2 = 0.84) with the same measure computed for higher-frequency derived alleles (y-axis). Color-coding is same as in panel (a).

Comment in

References

    1. Felsenfeld G, Boyes J, Chung J, Clark D, Studitsky V. Chromatin structure and gene expression. Proc Natl Acad Sci U S A. 1996;93:9384–8. - PMC - PubMed
    1. Gross DS, Garrard WT. Nuclease hypersensitive sites in chromatin. Annu Rev Biochem. 1988;57:159–97. - PubMed
    1. Gaszner M, Felsenfeld G. Insulators: exploiting transcriptional and epigenetic mechanisms. Nat Rev Genet. 2006;7:703–13. - PubMed
    1. Li Q, Harju S, Peterson KR. Locus control regions: coming of age at a decade plus. Trends Genet. 1999;15:403–8. - PubMed
    1. Heintzman ND, et al. Distinct and predictive chromatin signatures of transcriptional promoters and enhancers in the human genome. Nat Genet. 2007;39:311–318. - PubMed

Publication types

MeSH terms