. 2012 Dec 6;120(24):4675-83.
doi: 10.1182/blood-2012-03-416859. Epub 2012 Sep 6.

IL-7-producing stromal cells are critical for lymph node remodeling

Affiliations

IL-7-producing stromal cells are critical for lymph node remodeling

Lucas Onder et al. Blood. .

Abstract

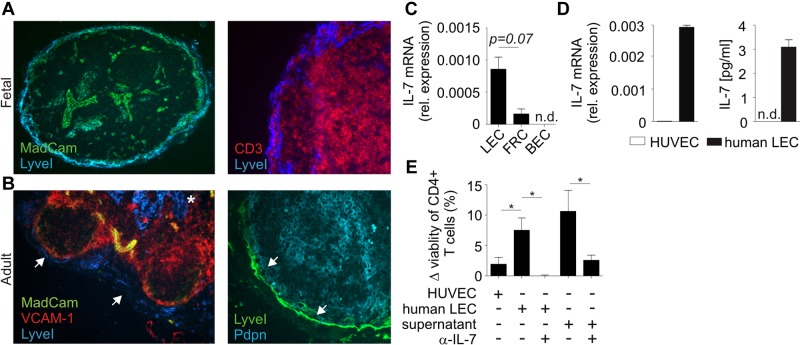
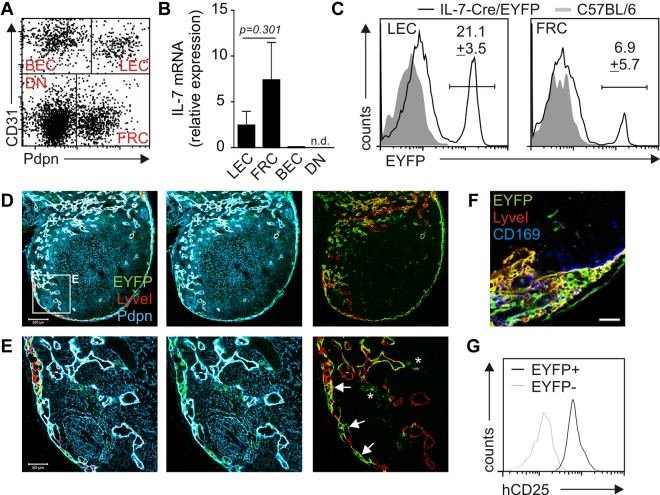
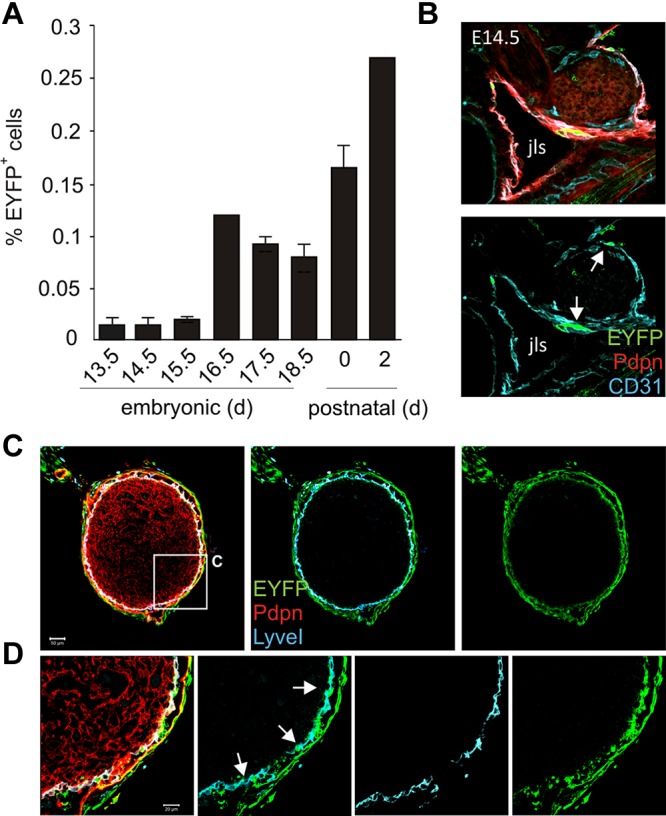
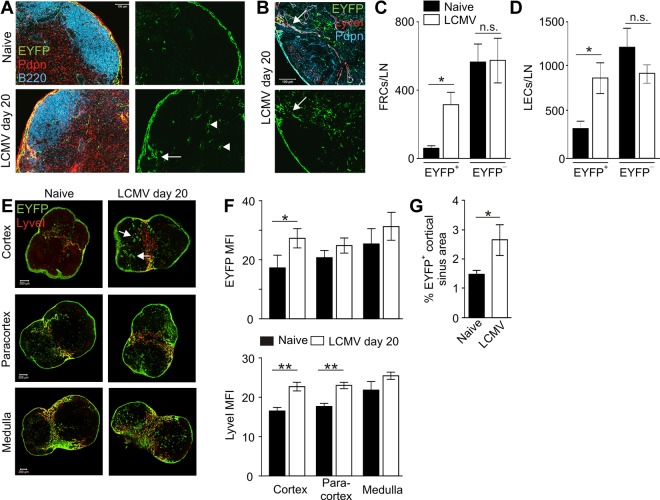
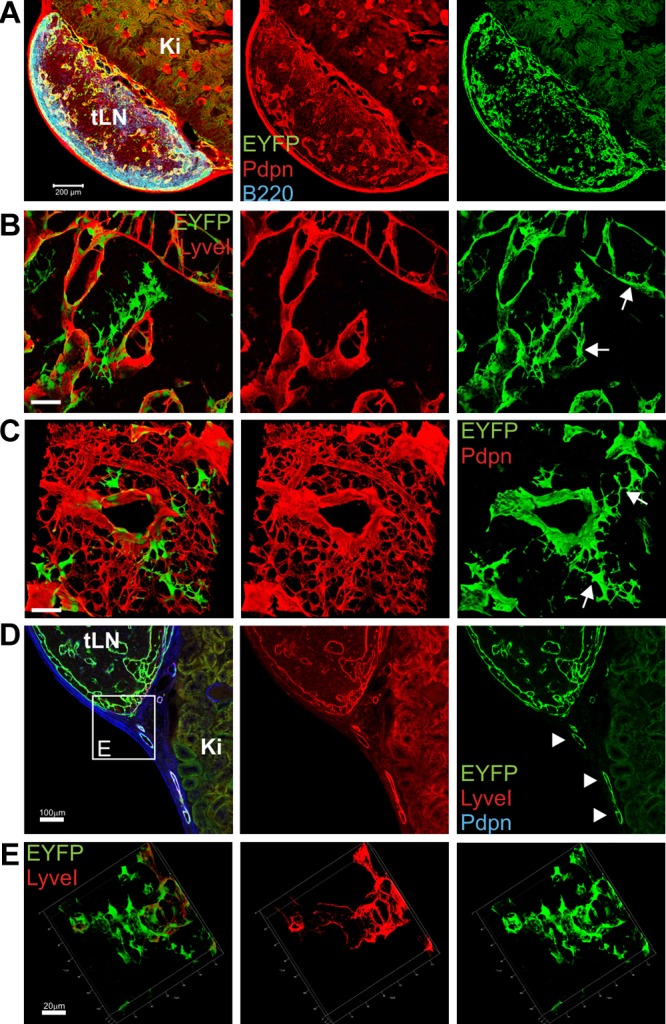
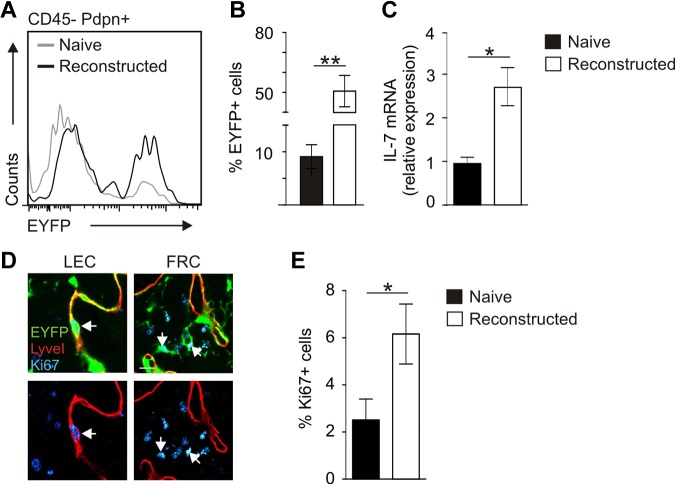
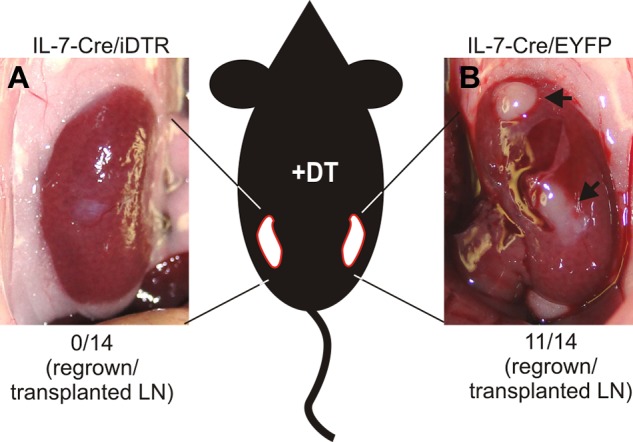
Nonhematopoietic stromal cells of secondary lymphoid organs form important scaffold and fluid transport structures, such as lymph node (LN) trabeculae, lymph vessels, and conduits. Furthermore, through the production of chemokines and cytokines, these cells generate a particular microenvironment that determines lymphocyte positioning and supports lymphocyte homeostasis. IL-7 is an important stromal cell-derived cytokine that has been considered to be derived mainly from T-cell zone fibroblastic reticular cells. We show here that lymphatic endothelial cells (LECs) are a prominent source of IL-7 both in human and murine LNs. Using bacterial artificial chromosome transgenic IL-7-Cre mice, we found that fibroblastic reticular cells and LECs strongly up-regulated IL-7 expression during LN remodeling after viral infection and LN reconstruction after avascular transplantation. Furthermore, IL-7-producing stromal cells contributed to de novo formation of LyveI-positive lymphatic structures connecting reconstructed LNs with the surrounding tissue. Importantly, diphtheria toxin-mediated depletion of IL-7-producing stromal cells completely abolished LN reconstruction. Taken together, this study identifies LN LECs as a major source of IL-7 and shows that IL-7-producing stromal cells are critical for reconstruction and remodeling of the distinct LN microenvironment.


Figures

Figure 1
Figure 1
Assessment of IL-7 expression in human LN LECs. (A) Fetal LN sections were stained with fluorescently labeled antibodies against LyveI, MadCAM-1, and CD3. (B) Adult LN sections were stained with antibodies against LyveI, VCAM-1, MadCAM-1, and Pdpn. LyveI+Pdpn+ LECs (blue in left panel and green in right panel) are indicated in the subcapsular sinus (arrows) and LN medulla (*). (C) CD31+Pdpn+ LECs, CD31Pdpn+ FRCs, and CD31+Pdpn BECs from human fetal mesenteric LNs were sorted by flow cytometry. IL-7 expression levels were determined by quantitative RT-PCR. Values indicate mean ± SEM from triplicates, representative results from 1 of 2 independent sorting experiments. (D) Human LN LECs were cultivated and analyzed for IL-7 mRNA expression by quantitative RT-PCR. Cell culture supernatants were collected after 48 hours and analyzed for IL-7 protein by ELISA (right graph). Measurements were carried out in triplicates (mean ± SEM). (E) MACS-isolated human naive CD4+ T cells (2 × 10⁵) were cocultured with human LECs, HUVECs, or supernatant from human LEC cultures in the presence and absence of neutralizing anti–IL-7 antibody. After 48 hours, T-cell survival was analyzed by flow cytometry and is displayed as difference (Δ) to medium control. Values indicate mean ± SEM from triplicates, representative results from 1 of 2 independent experiments; *P < .05.
Figure 2
Figure 2
IL-7–Cre transgene expression in adult murine LNs. (A) Inguinal LN cell suspensions were depleted of CD45+ cells, and CD45 stromal cells were analyzed by flow cytometry for CD31 and Pdpn expression. Stromal cell subpopulations are designated in the respective quadrant. DN indicates double-negative cells. (B) FACS-sorted LN stromal cells were analyzed for IL-7 expression by quantitative RT-PCR (n = 4 from 2 independent sorts). (C) Histograms displaying EYFP expression within LEC and FRC subpopulations, IL-7–CrexR26-EYFP (solid line), and C57BL/6 (gray shading) LNs. Values indicate mean percentage ± SEM of EYFP+ cells (n = 6 in independent preparations). (D) Confocal laser scanning microscopic analysis of inguinal LNs from IL-7–CrexR26-EYFP mice. Scale bar represents 200 μm. (E) High magnification of boxed area in panel D; indicated are transgene-expressing LECs (arrows) and FRCs (asterisks). Scale bar represents 50 μm. (F) Anti-CD169 staining in the subcapsular sinus region of an IL-7–CrexR26-EYFP inguinal LN. Scale bar represents 20 μm. (G) Flow cytometric analysis of human CD25 expression on EYFP+ (black line) and EYFP (gray line) LN stromal cells from triple transgenic IL-7–hCD25xIL-7CrexR26-EYFP mice.
Figure 3
Figure 3
IL-7–Cre transgene activity during embryonic LN development. (A) IL-7–CrexR26-EYFP mouse embryos at different developmental stages were harvested, and dissected LN anlagen were analyzed for transgene-expressing (EYFP+) stromal cells. (B) E14.5 embryonic sections were stained with antibodies against EYFP, CD31, and Pdpn and analyzed by CLSM. EYFP+CD31+ cells (arrows) were found in the jugular lymph sac (jls) lining endothelium. (C) Neonatal inguinal LNs from IL-7–CrexR26-EYFP mice stained for EYFP (green), LyveI+ lymphatic endothelium (blue), and Pdpn+ parenchymal stroma (red). Scale bar represents 50 μm. (D) Higher magnification of boxed area in panel B. EYFP+LyveI+ LECs are indicated by arrows. Scale bar represents 20 μm.
Figure 4
Figure 4
Expansion of IL-7–expressing stromal cells during virus-induced LN remodeling. IL-7–CrexR26-EYFP mice were infected with 200 pfu LCMV-WE, and transgene activity was determined on day 20 after infection. (A) In situ analysis of naive (upper panels) and infected (lower panel) IL-7–CrexR26-EYFP inguinal LNs (blue represents B220; red, Pdpn; and green, EYFP). Scale bar represents 200 μm. (B) Higher magnification of day 20 IL-7–CrexR26-EYFP inguinal LNs (red represents LYVEI; blue, Pdpn; and green, EYFP). Scale bar represents 100 μm. (C-D) Enumeration of EYFP+ and EYFP FRCs (C) and LECs (D) in LNs from naive and LCMV-infected mice (mean ± SEM; n = 6 mice). (E) Flow cytometric FACS analysis of EYFP+ FRCs (C) and LECs (D) in LNs taken from naive and infected IL-7–CrexR26-EYFP mice. (E) Evaluation of transgene activity in LECs in LNs of naive (left column) and LCMV-infected mice (right column). Cortical, paracortical, and medullary sections were stained for lymphatic endothelium (LyveI, red) and transgene activity (EYFP, green). (F) Quantification of EYFP and LyveI mean fluorescence intensity (MFI) in the different LN regions (mean ± SEM; n = 6 mice). (G) Proportion of EYFP+ areas in cortical LN sections from naive and infected mice. *P < .05; **P < .01; and n.s. indicates not significant.
Figure 5
Figure 5
Transgenic IL-7–expression during LN reconstruction after avascular transplantation. LNs from IL-7–CrexR26-EYFP donor mice were transplanted under the kidney capsule of C57BL/6 mice and harvested 8 weeks after transplantation. (A) Mosaic scan of a regenerated LN (tLN) developing on the kidney (Ki; blue represents B220; red, Pdpn; and green, EYFP). Scale bar represents 200 μm. (B) Three-dimensional reconstruction of subcapsular sinus region (red represents LyveI; and green, EYFP). Scale bar represents 50 μm. Arrows indicate transgene-positive LECs. (C) Three-dimensional reconstruction of T-cell zone region (red represents Pdpn; and green, EYFP). Scale bar represents 50 μm. Arrows indicate transgene-positive FRCs. (D) Lymphatic vessel connecting tLN with surrounding tissue (blue represents Pdpn; red, LyveI; and green, EYFP). Scale bar represents 100 μm. (E) Three-dimensional rendering of boxed region in panel D showing lymph vessel connection to the SCS (red represents LyveI; and green, EYFP). Scale bar represents 20 μm.
Figure 6
Figure 6
Assessment of stromal cell proliferation during posttransplantation LN reconstruction. (A) Stromal cells from pretransplantation (naive, gray line) inguinal LNs and reconstructed LNs (black line) were analyzed for EYFP expression on CD45Pdpn+ stromal cells by flow cytometry. (B) Percentage of EYFP-expressing stromal cells within CD45 cells (mean ± SEM; n = 6 LNs). **P < .01. (C) IL-7 mRNA expression as determined by RT-PCR analysis from CD45 cells (mean ± SEM; n = 3 LNs). *P < .05. (D) Ki67 expression in transplanted IL-7–CrexR26-EYFP LNs. Left panels: Ki67+ LECs (arrow). Right panels: Ki67+ FRCs (blue represents Ki67; red, LyveI; and green, EYFP). Scale bar represents 10 μm. (E) Percentage of Ki67+ transgene-expressing cells in naive and reconstructed LNs. Evaluation of 10 high power fields per LN (mean ± SEM; n = 4 LNs). *P < .05.
Figure 7
Figure 7
Importance of IL-7–expressing stromal cells for LN regeneration. Inguinal LNs of IL-7–CrexR26-iDTR and IL-7–CrexR26-EYFP mice were transplanted under the kidney capsule of C57BL/6 mice. Between weeks 4 and 8 after transplantation, recipients were treated with DT (20 ng/g body weight) twice weekly. (A) LN remnants of IL-7–CrexR26-iDTR LNs. None of the 14 transplanted LNs had regenerated. (B) Fully regenerated IL-7–CrexR26-EYFP LNs from the contralateral kidney. Eleven of 14 transplanted LNs had regenerated.

References

    1. Kang J, Coles M. IL-7: the global builder of the innate lymphoid network and beyond, one niche at a time. Semin Immunol. 2012;24(3):190–197. - PMC - PubMed
    1. Kikuchi K, Lai AY, Hsu CL, Kondo M. IL-7 receptor signaling is necessary for stage transition in adult B cell development through up-regulation of EBF. J Exp Med. 2005;201(8):1197–1203. - PMC - PubMed
    1. Corcoran AE, Riddell A, Krooshoop D, Venkitaraman AR. Impaired immunoglobulin gene rearrangement in mice lacking the IL-7 receptor. Nature. 1998;391(6670):904–907. - PubMed
    1. Bertolino E, Reddy K, Medina KL, et al. Regulation of interleukin 7-dependent immunoglobulin heavy-chain variable gene rearrangements by transcription factor STAT5. Nat Immunol. 2005;6(8):836–843. - PubMed
    1. Kang J, Coles M, Raulet DH. Defective development of gamma/delta T cells in interleukin 7 receptor-deficient mice is due to impaired expression of T cell receptor gamma genes. J Exp Med. 1999;190(7):973–982. - PMC - PubMed

Publication types

MeSH terms