. 2012 Oct 9;126(15):1869-81.
doi: 10.1161/CIRCULATIONAHA.112.118380. Epub 2012 Sep 6.

Cardiomyogenesis in the aging and failing human heart

Affiliations

Cardiomyogenesis in the aging and failing human heart

Jan Kajstura et al. Circulation. .

Retraction in

  • Notice of retraction.
    [No authors listed] [No authors listed] Circulation. 2014 Apr 22;129(16):e466. doi: 10.1161/CIR.0000000000000049. Epub 2014 Apr 8. Circulation. 2014. PMID: 24714642 Free PMC article. No abstract available.

Abstract

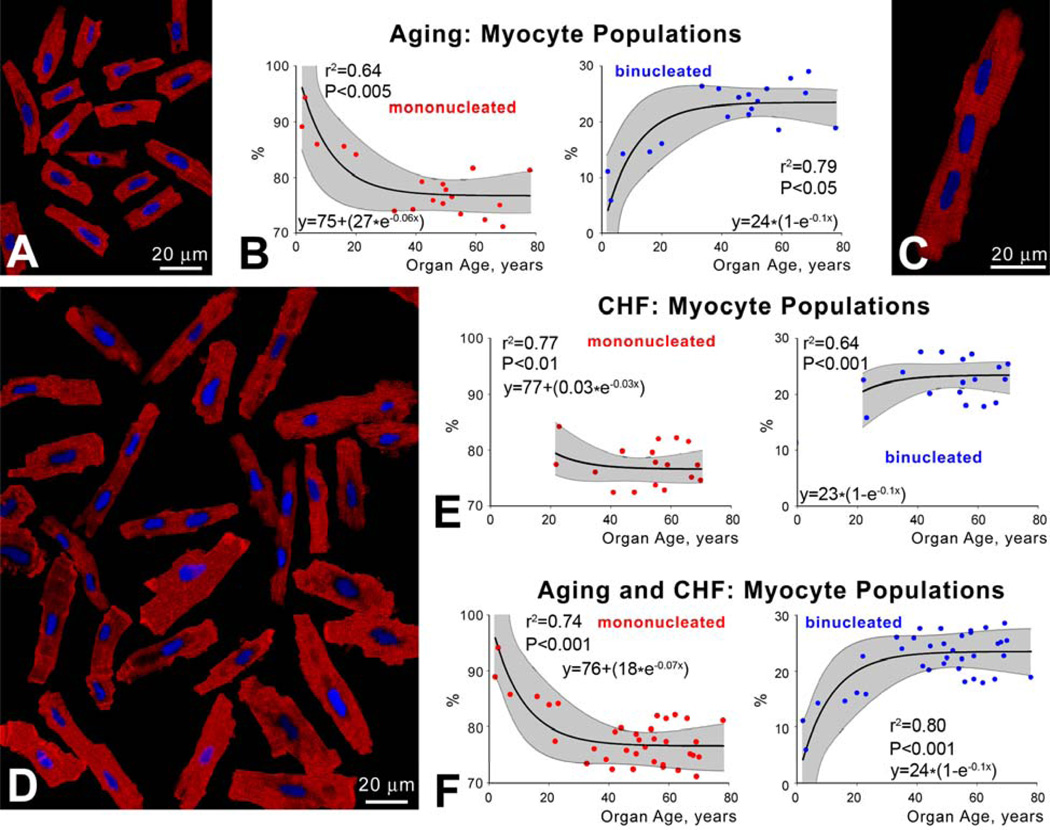
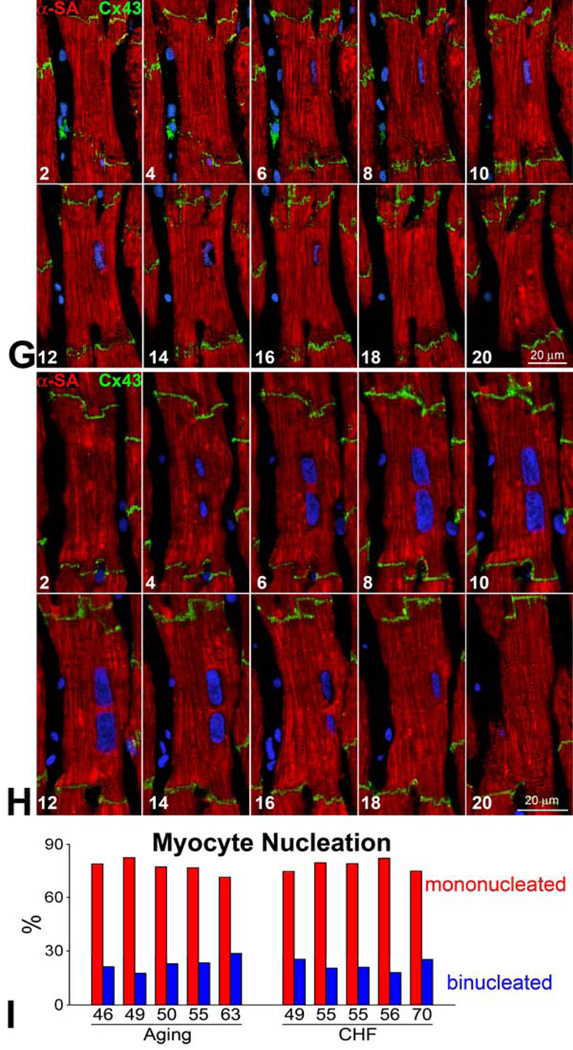
Background: Two opposite views of cardiac growth are currently held; one views the heart as a static organ characterized by a large number of cardiomyocytes that are present at birth and live as long as the organism, and the other views the heart a highly plastic organ in which the myocyte compartment is restored several times during the course of life.

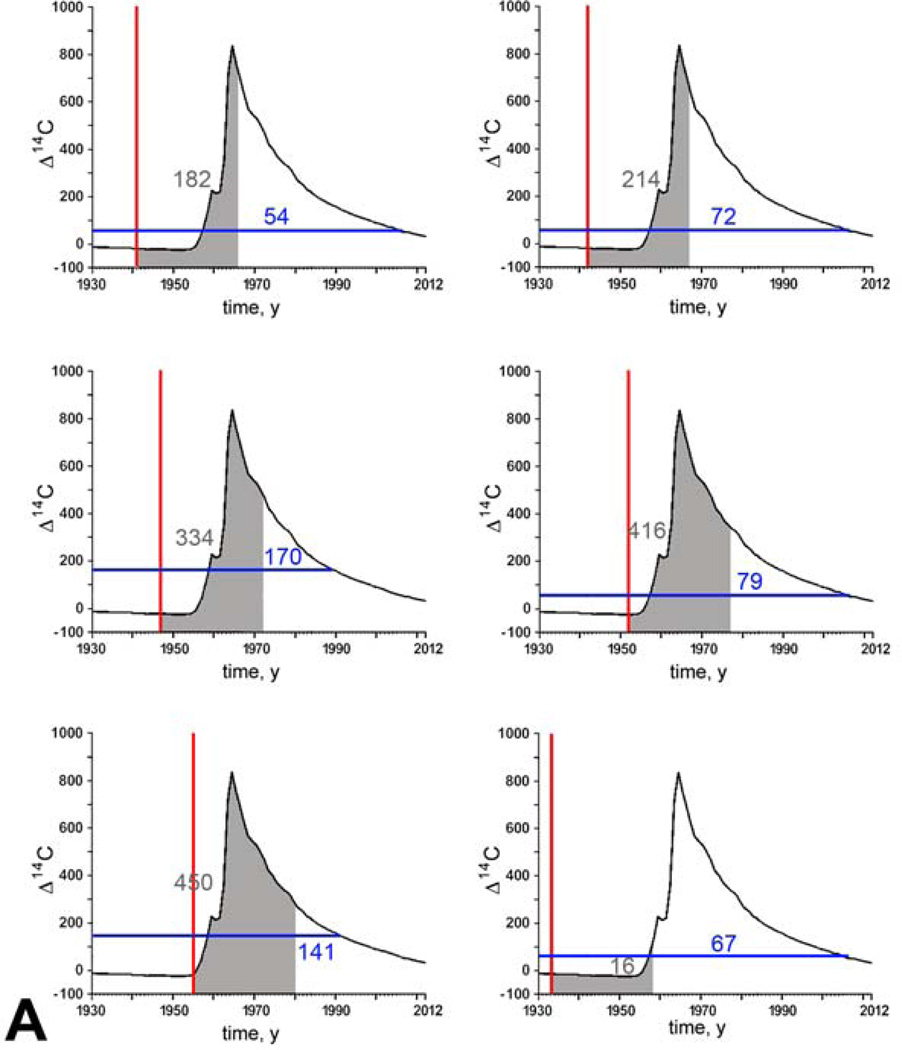
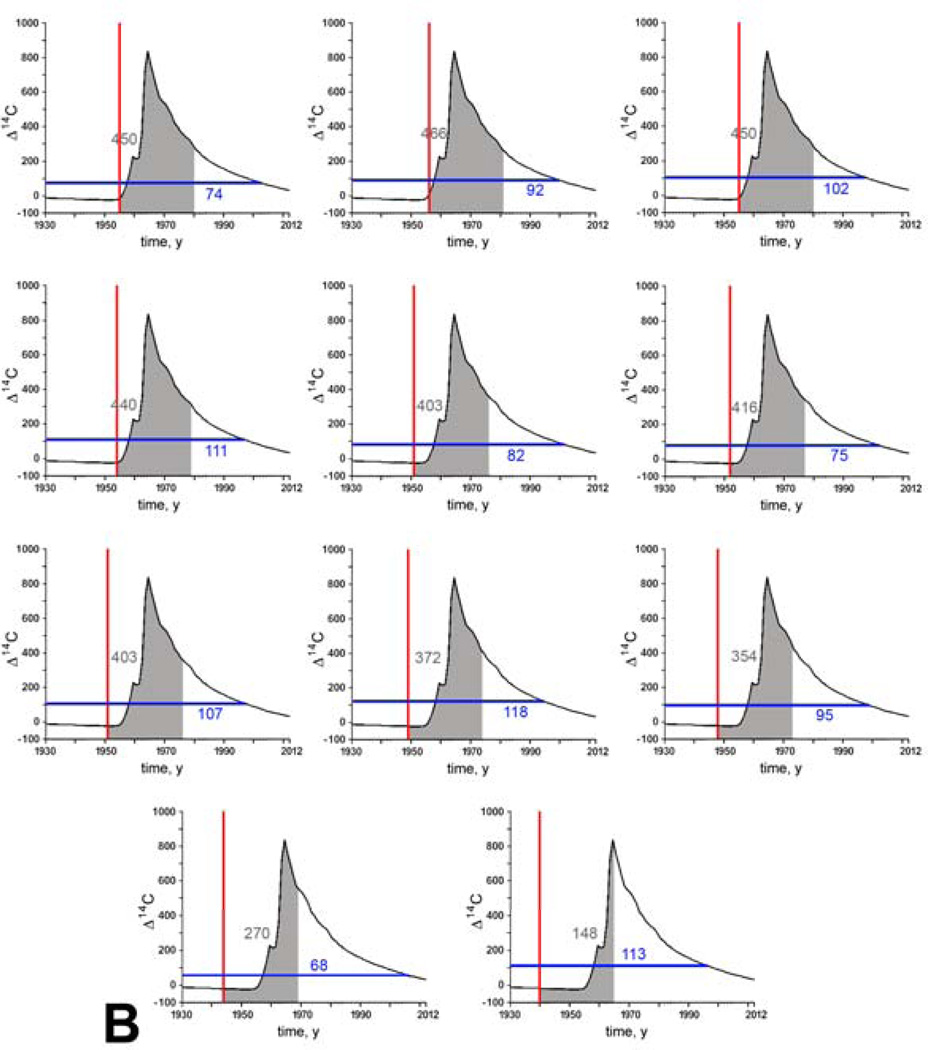
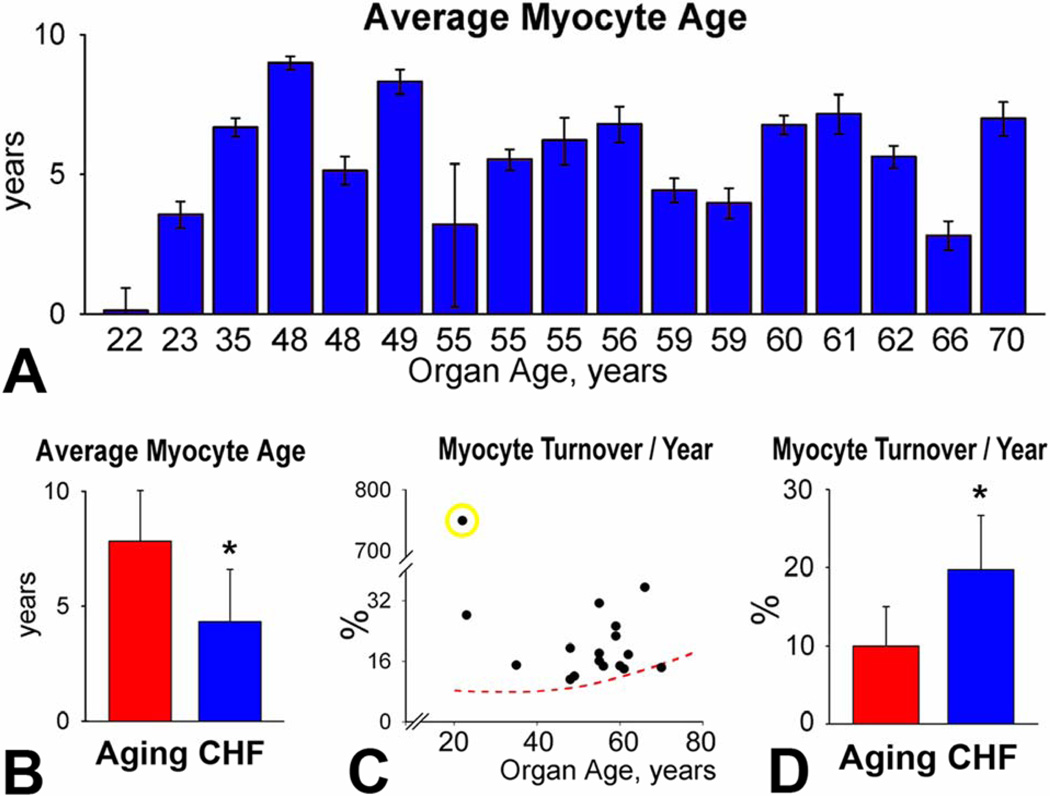
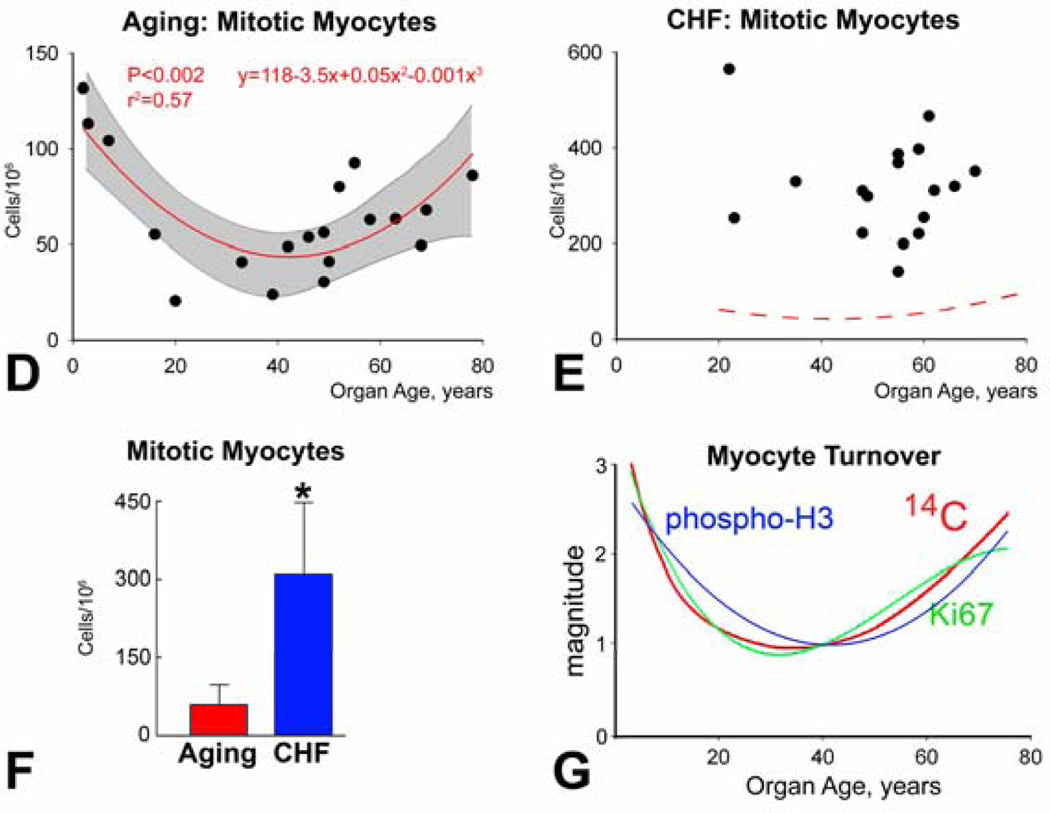
Methods and results: The average age of cardiomyocytes, vascular endothelial cells (ECs), and fibroblasts and their turnover rates were measured by retrospective (14)C birth dating of cells in 19 normal hearts 2 to 78 years of age and in 17 explanted failing hearts 22 to 70 years of age. We report that the human heart is characterized by a significant turnover of ventricular myocytes, ECs, and fibroblasts, physiologically and pathologically. Myocyte, EC, and fibroblast renewal is very high shortly after birth, decreases during postnatal maturation, remains relatively constant in the adult organ, and increases dramatically with age. From 20 to 78 years of age, the adult human heart entirely replaces its myocyte, EC, and fibroblast compartment ≈8, ≈6, and ≈8 times, respectively. Myocyte, EC, and fibroblast regeneration is further enhanced with chronic heart failure.

Conclusions: The human heart is a highly dynamic organ that retains a remarkable degree of plasticity throughout life and in the presence of chronic heart failure. However, the ability to regenerate cardiomyocytes, vascular ECs, and fibroblasts cannot prevent the manifestations of myocardial aging or oppose the negative effects of ischemic and idiopathic dilated cardiomyopathy.


Figures

Figure 1
Figure 1. Cell preparation
A through D, Myocytes (A: α-sarcomeric actin, α-SA, red), ECs (B: von Willebrand factor, vWf, white), and fibroblasts (C: procollagen, procoll, yellow) isolated from the LV myocardium. Nuclei are stained by DAPI (blue). D, Dot plot of ECs (blue dots), and fibroblasts (red dots); their relative values are shown (n=36). E, Quantitative data are shown as mean±SD. Myo, myocytes; ECs, endothelial cells; Fib, fibroblasts.
Figure 2
Figure 2. Myocyte classes and cell ploidy
A, At 7 years of age, myocytes are predominantly mononucleated; α-sarcomeric actin (α-SA, red). Nuclei are stained by DAPI (blue). B, As shown by non-linear exponential fitting, mononucleated myocytes decrease and binucleated myocytes increase up to 25 years of age and remain constant thereafter. The shaded area corresponds to the 95% confidence interval. C, Trinucleated human myocyte. D, Myocytes isolated from an explanted human heart. Mononucleated and binucleated myocytes are present. E and F, Non-linear exponential fitting of mononucleated and binucleated myocytes from failing hearts (E), and both donor and failing hearts (F). G and H, Optical sections of myocytes in myocardial sections 20–25 µm in thickness illustrating a mononucleated (G) and a binucleated myocyte (H). Connexin 43 (Cx43, green) delineates the cell boundary. The number in each image corresponds to the focal plane in µm. I, Quantitative data in each heart. J, Representative FACS analysis of DNA content in cardiomyocyte, EC, and fibroblast nuclei. HeLa cells and skin fibroblasts were used as controls for 2n DNA. With aging (2 years and 68 years) and CHF, diploid myocyte, EC, and fibroblast nuclei constitute the large majority of each cardiac cell class. K, Non-linear exponential fitting of diploid (red line), tetraploid (blue line) and octaploid (black line) myocyte nuclei as a function of age alone, with CHF, and their combination. From 2 to 78 years, polyploidy reached a plateau at ~25 years and did not change further with age. With CHF, a relatively constant value of polyploidy was seen from 22 to 70 years of age.
Figure 3
Figure 3. [14C] in myocytes from patients born before 1956
A and B, The vertical red lines indicate the date of birth of each normal (A) and failing heart (B) and the horizontal blue line corresponds to the intercept with the ascending and descending limb of the 14C curve. The shaded area under the curve defines in each case the average atmospheric [14C] during the first 25 years of life when binucleation and polyploidization of myocytes took place. The grey number reflects the average atmospheric [14C] during the first 25 years of life. The blue number reflects [14C] measured by AMS.
Figure 4
Figure 4. Cell age and turnover rate with organ aging
A, Myocyte age in each LV from 2 to 78 years. Error bars reflect the maximum and minimum levels of the 95% confidence interval. B and C, Myocyte age (B), and annual myocyte turnover (C) as a function of organ age. Data were fitted by cubic polynomial equations. The shaded area corresponds to the 95% confidence interval. D, Myocyte volume and number increase from 2 to 20 years of age. E through J, ECs (E through G) and fibroblasts (H through J) are analyzed in manner identical to cardiomyocytes. K, Renewal of myocytes (Myo), ECs, and fibroblasts (Fib) from 20 to 78 years of age.
Figure 5
Figure 5. Cell age and turnover rate with CHF
A, Myocyte age in each LV from 22 to 70 years. Error bars reflect the maximum and minimum levels of the 95% confidence interval. B, Average myocyte age in the 15 aging hearts, 20 to 78 year-old, and in the 16 hearts with CHF, 23 to 70 year-old. C, Annual myocyte turnover with CHF; the yellow circle indicates the case with a rate of myocyte renewal of 750%. The red dotted line corresponds to the level of myocyte turnover in aging hearts, 20 to 78 year-old. The cubic polynomial curve and other linear and non-linear regressions failed to fit the myocyte data. D, Myocyte turnover in aging and failing hearts. E, EC and fibroblast age in each LV. F, Average EC and fibroblast age in aging and failing hearts. G, Annual EC and fibroblast turnover with CHF. The red dotted line corresponds to the level of EC and fibroblast turnover in aging hearts, 20 to 78 year-old. The cubic polynomial curve and other linear and non-linear regressions failed to fit the EC and fibroblast data. H, EC and fibroblast turnover in aging and failing hearts. *P<0.05 vs. aging.
Figure 6
Figure 6. Replicating myocytes with aging and CHF
A, Cycling myocytes (α-SA, red) with aging (left) and heart failure (right) labeled by Ki67 (yellow; arrows). B, Number of Ki67-positive myocyte nuclei/106 with aging and CHF. C, Ki67 labeling as a function of age. Data were fitted by cubic polynomial equation. The shaded area corresponds to the 95% confidence interval. D, Number of Ki67-labeled myocyte nuclei/106 with CHF. The red dotted line corresponds to the fraction of Ki67-positive myocyte nuclei in aging hearts, 20 to 78 year-old. E, Cycling myocytes (α-SA, red), labeled by Ki67 (yellow, arrows), are present in the isolated cell preparations with aging (left) and heart failure (right). Quantitative results in 10 hearts are also shown. F, Cycling myocytes in aging and CHF. Data are shown as mean±SD. *P<0.05 vs. aging. G, The shape of the Ki67 and [14C] curves is comparable as demonstrated by the analysis of covariance, P < 0.001. The value at 40 years of age was used to normalize both curves.
Figure 7
Figure 7. Myocyte mitotic index with aging and CHF
A, Chromosomes in mitotic myocyte nuclei (arrows) are labeled by phospho-H3 (Insets, green). Myocyte cytoplasm (α-SA, red). B, Dividing myocytes, labeled by phospho-H3 (green), are present in the isolated cell preparations with aging (left) and CHF (right). Quantitative results in 10 hearts are also shown. C, Number of phospho-H3-positive myocyte nuclei/106 with aging and CHF. D, phospho-H3 labeling as a function of age. Data were fitted by cubic polynomial equation. The shaded area corresponds to the 95% confidence interval. E, Number of phospho-H3-labeled myocyte nuclei/106 with CHF. The cubic polynomial curve and other linear and non-linear regressions failed to fit the myocyte data. The red dotted line corresponds to the number of phospho-H3-positive myocyte nuclei/106 in aging hearts, 20 to 78 year-old. F, Myocytes in mitosis with aging and CHF. Mean±SD. *P<0.05 vs. aging. G, The shape of the phospho-H3, Ki67, and [14C] curves is comparable as demonstrated by the analysis of covariance, P<0.001. Values at 40 years of age were used to normalize the three curves.
Figure 8
Figure 8. Myocyte cytokinesis
Expression of aurora B kinase (white) at the chromosomes (arrows) and cleavage furrow (arrowheads) of myocytes undergoing cytokinesis. Individual labeling are shown in online-only Data Supplement Figure 7.

Comment in

  • On the fabric of the human body.
    Raval Z, Losordo DW. Raval Z, et al. Circulation. 2012 Oct 9;126(15):1812-4. doi: 10.1161/CIRCULATIONAHA.112.136127. Epub 2012 Sep 6. Circulation. 2012. PMID: 22955964 No abstract available.

References

    1. Hill JA, Olson EN. Cardiac plasticity. N Engl J Med. 2008;358:1370–1380. - PubMed
    1. Leri A, Kajstura J, Anversa P. Role of cardiac stem cells in cardiac pathophysiology: a paradigm shift in human myocardial biology. Circ Res. 2011;109:941–961. - PMC - PubMed
    1. Bergmann O, Bhardwaj RD, Bernard S, Zdunek S, Barnabé-Heider F, Walsh S, Zupicich J, Alkass K, Buchholz BA, Druid H, Jovinge S, Frisén J. Evidence for cardiomyocyte renewal in humans. Science. 2009;324:98–102. - PMC - PubMed
    1. Kajstura J, Gurusamy N, Ogórek B, Goichberg P, Clavo-Rondon C, Hosoda T, D'Amario D, Bardelli S, Beltrami AP, Cesselli D, Bussani R, del Monte F, Quaini F, Rota M, Beltrami CA, Buchholz BA, Leri A, Anversa P. Myocyte turnover in the aging human heart. Circ Res. 2010;107:1374–1386. - PubMed
    1. Olivetti G, Abbi R, Quaini F, Kajstura J, Cheng W, Nitahara JA, Quaini E, Di Loreto C, Beltrami CA, Krajewski S, Reed JC, Anversa P. Apoptosis in the failing human heart. N Engl J Med. 1997;336:1131–1141. - PubMed

Publication types