. 2012 Sep;22(9):1658-67.
doi: 10.1101/gr.136838.111.

Understanding transcriptional regulation by integrative analysis of transcription factor binding data

Affiliations

Understanding transcriptional regulation by integrative analysis of transcription factor binding data

Chao Cheng et al. Genome Res. 2012 Sep.

Abstract

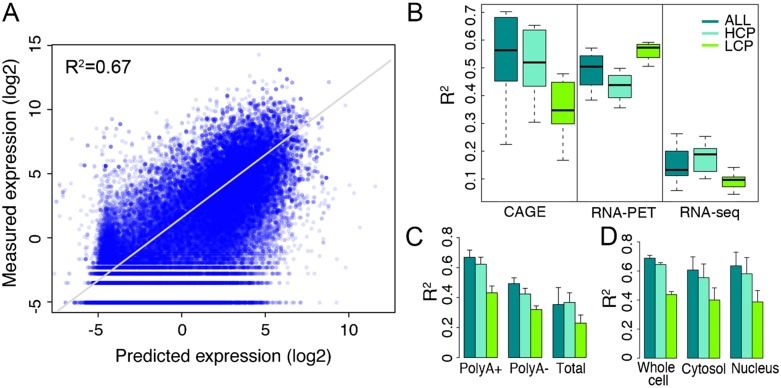
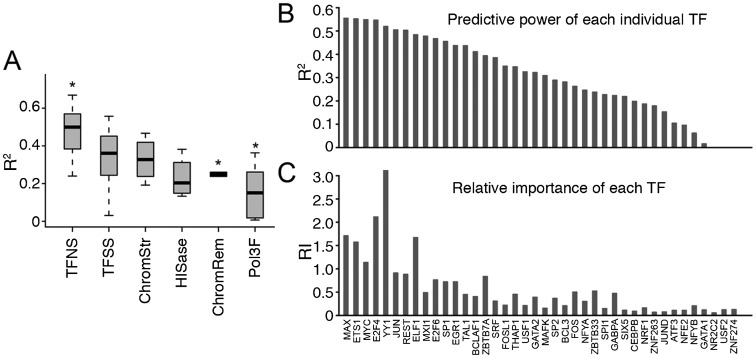
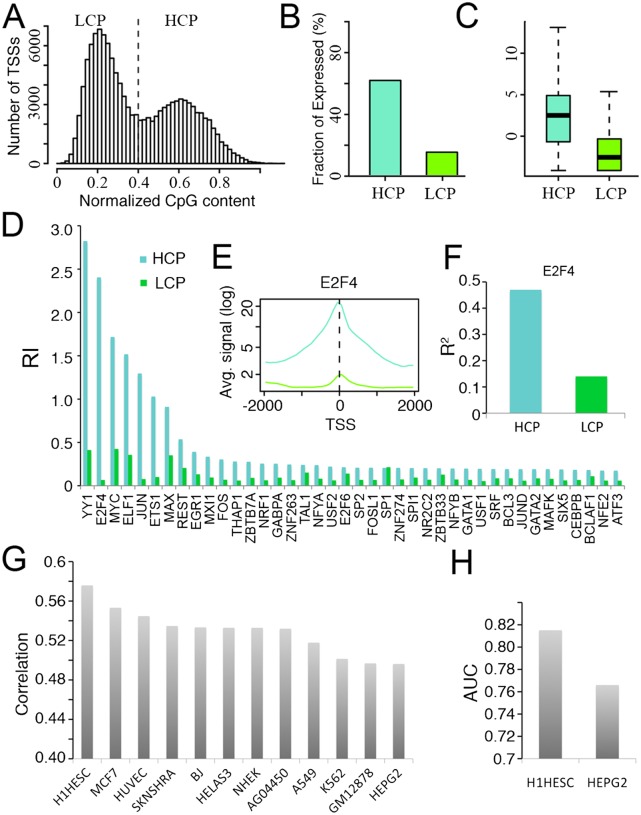
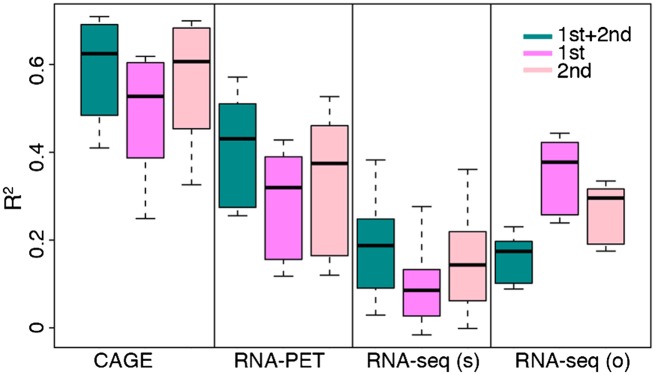
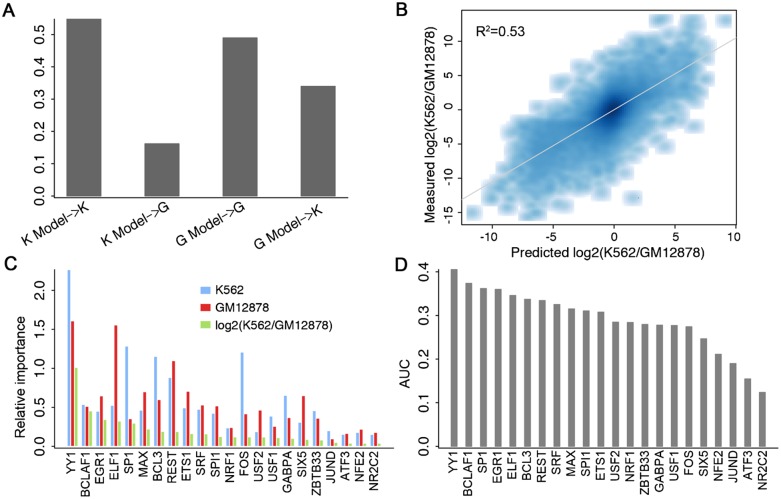
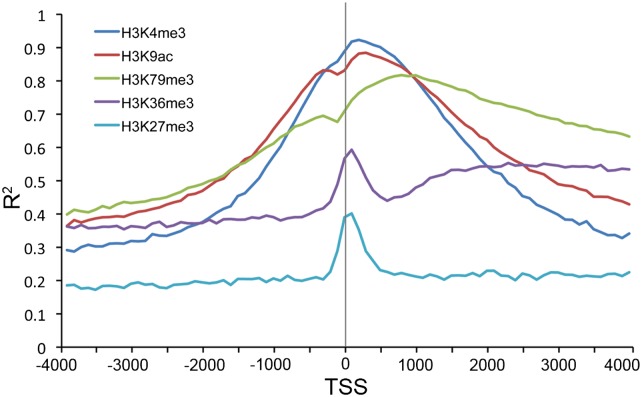
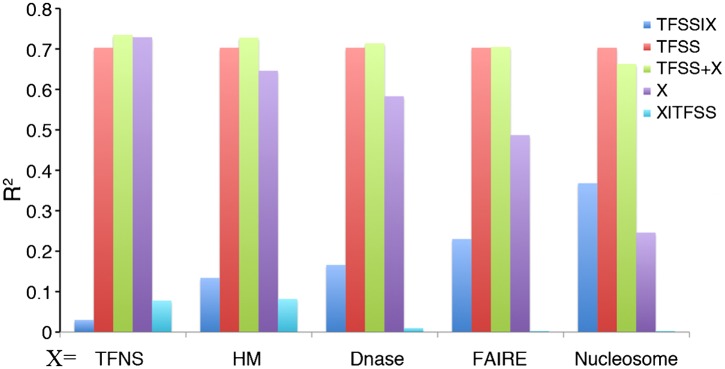
Statistical models have been used to quantify the relationship between gene expression and transcription factor (TF) binding signals. Here we apply the models to the large-scale data generated by the ENCODE project to study transcriptional regulation by TFs. Our results reveal a notable difference in the prediction accuracy of expression levels of transcription start sites (TSSs) captured by different technologies and RNA extraction protocols. In general, the expression levels of TSSs with high CpG content are more predictable than those with low CpG content. For genes with alternative TSSs, the expression levels of downstream TSSs are more predictable than those of the upstream ones. Different TF categories and specific TFs vary substantially in their contributions to predicting expression. Between two cell lines, the differential expression of TSS can be precisely reflected by the difference of TF-binding signals in a quantitative manner, arguing against the conventional on-and-off model of TF binding. Finally, we explore the relationships between TF-binding signals and other chromatin features such as histone modifications and DNase hypersensitivity for determining expression. The models imply that these features regulate transcription in a highly coordinated manner.


Figures

Figure 1.
Figure 1.
Accuracy of the TF model for predicting TSS expression levels. (A) Consistency of predicted values with expression levels measured by CAGE in Poly A+ RNA samples extracted from whole cells. (B) Comparison of predictive accuracies of the TF model for expression data generated by three different technologies: CAGE, RNA–PET, and RNA-seq. (C) Comparison of predictive accuracies of the TF model for expression data from three different RNA extraction protocols: Poly A+, Poly A-, and total RNA. (D) Comparison of predictive accuracies of the TF model for expression data in different cellular components. In B–D, only data sets from K562 are used. The binding signals of 40 TFSSs are used as predictors. HCP and LCP are high and low CpG content promoters, respectively. Separate models are constructed for ALL, HCP, and LCP categories.
Figure 2.
Figure 2.
The capabilities of different TFs to predict TSS expression level. (A) Comparison of the predictive accuracies of individual DNA-binding proteins in six different categories. (*) Indicates that the predictive powers of TFs in a corresponding category are significantly different from those of the other TFs. (B) The predictive accuracy of using each individual TFSS as the single predictor. (C) The relative importance of each TFSS in the Random Forest model. The calculation is based on the CAGE expression data in Poly A+ RNA samples extracted from K562 whole cells. Note that TFSS labels are shared by B and C.
Figure 3.
Figure 3.
The relationship between promoter CpG content and expression level. (A) The distribution of normalized CpG content for all human GENCODE TSSs. (B) The fraction of expressed TSSs in HCPs and LCPs. (C) The distributions of expression levels of expressed HCPs and LCPs. (D) The relative importance of each TF in the HCP- and LCP-specific models. (E) The aggregated binding signals of E2F4 around the TSS of HCPs and LCPs. (F) The predictive accuracies of HCP- and LCP-specific models using E2F4 as the single predictor. (G) The Spearman correlation coefficients between normalized CpG content and expression levels in different cell lines (CAGE data for Poly A+ RNA from whole cells). (H) The accuracies of using normalized CpG content to classify expressed and nonexpressed promoters in H1HESC and HEPG2. In B–F, the CAGE expression data for RNA extracted from K562 whole cells are used.
Figure 4.
Figure 4.
Comparison of accuracies of the TF model for predicting the expression level of the first and second TSS of genes. The binding signals of 40 TFSSs are used as the predictors, and only promoters from genes with at least two TSSs are included in the models. The calculation is based on expression data from K562. RNA-seq (s) and RNA-seq (o) represent RNA-seq data using small-RNA extraction protocol and other protocols, respectively.
Figure 5.
Figure 5.
Cell line specificity of the TF model. (A) Models trained and tested on data from the same cell line result in higher predictive accuracies. K Model and G Model represent models trained with data from K562 and GM12878, respectively. (B) Consistency of predicted log2 fold changes with the experimentally measured differences between K562 and GM12878. Differential binding of 22 TFs are used as the predictors in a predictive model of differential expression. (C) The relative importance of TFs in K562- and GM12878-specific models as well as the predictive model for differential expression. (D) The power of each individual TF for classifying K562- and GM12878-specific promoters (log2 fold change >2). CAGE expression data in Poly A+ RNA extracted from K562 and GM12878 whole cells were used in the calculation.
Figure 6.
Figure 6.
The effectiveness of TF-binding signals for predicting histone-modification patterns around the TSS of promoters. The binding signals of 40 TFSSs are used as the predictors. Both the TF-binding and the histone-modification data are from K562.
Figure 7.
Figure 7.
The relationship of the TFSS-binding data with five types of chromatin features for predicting promoter expression. For each type of chromatin feature, we constructed five models to calculate the fraction of variance of promoter expression levels explained by the TFSS alone (TFSS), by each feature alone (X), by a combination of TFSS and feature X (TFSS+X), as well as the additional variance explained by TFSS after taking feature X into account (TFSS|X) and vice versa (X|TFSS). Feature X represents general transcription factors (TFNS), histone modifications (HM), DNase signal, FAIRE signal, or nucleosome occupancy. CAGE expression data in Poly A+ RNA extracted from K562 whole cells were used in the calculation.
Figure 8.
Figure 8.
Regulatory mechanism of TF binding, histone modification, and other chromatin features on gene expression.

References

    1. Babu MM, Luscombe NM, Aravind L, Gerstein M, Teichmann SA 2004. Structure and evolution of transcriptional regulatory networks. Curr Opin Struct Biol 14: 283–291 - PubMed
    1. Biggin MD 2011. Animal transcription networks as highly connected, quantitative continua. Dev Cell 21: 611–626 - PubMed
    1. Breiman L 2001. Random Forests. Mach Learn 45: 5–32
    1. Campanero MR, Armstrong MI, Flemington EK 2000. CpG methylation as a mechanism for the regulation of E2F activity. Proc Natl Acad Sci 97: 6481–6486 - PMC - PubMed
    1. Cheng C, Gerstein M 2011. Modeling the relative relationship of transcription factor binding and histone modifications to gene expression levels in mouse embryonic stem cells. Nucleic Acids Res 40: 553–568 - PMC - PubMed

Publication types

LinkOut - more resources