. 2012 Sep;22(9):1668-79.
doi: 10.1101/gr.127761.111.

A highly integrated and complex PPARGC1A transcription factor binding network in HepG2 cells

Affiliations

A highly integrated and complex PPARGC1A transcription factor binding network in HepG2 cells

Alexandra E Charos et al. Genome Res. 2012 Sep.

Abstract

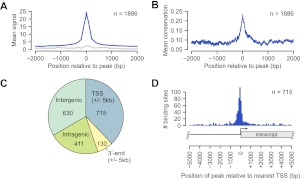
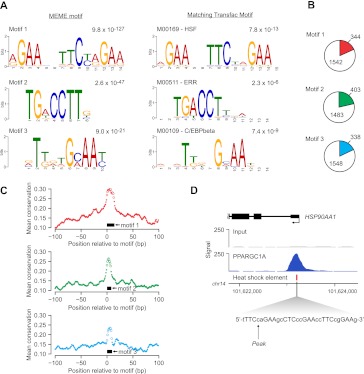
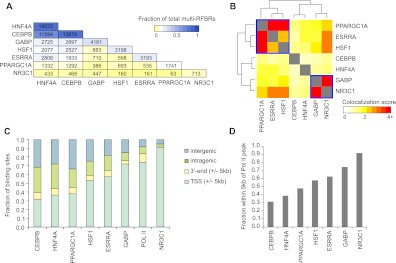
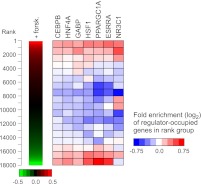
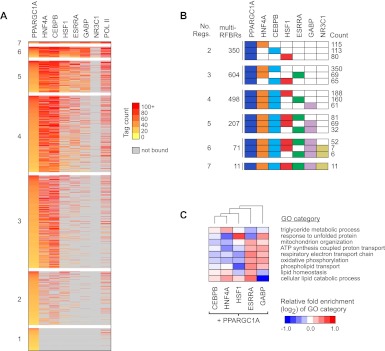
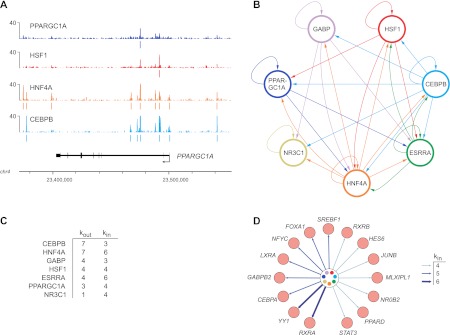
PPARGC1A is a transcriptional coactivator that binds to and coactivates a variety of transcription factors (TFs) to regulate the expression of target genes. PPARGC1A plays a pivotal role in regulating energy metabolism and has been implicated in several human diseases, most notably type II diabetes. Previous studies have focused on the interplay between PPARGC1A and individual TFs, but little is known about how PPARGC1A combines with all of its partners across the genome to regulate transcriptional dynamics. In this study, we describe a core PPARGC1A transcriptional regulatory network operating in HepG2 cells treated with forskolin. We first mapped the genome-wide binding sites of PPARGC1A using chromatin-IP followed by high-throughput sequencing (ChIP-seq) and uncovered overrepresented DNA sequence motifs corresponding to known and novel PPARGC1A network partners. We then profiled six of these site-specific TF partners using ChIP-seq and examined their network connectivity and combinatorial binding patterns with PPARGC1A. Our analysis revealed extensive overlap of targets including a novel link between PPARGC1A and HSF1, a TF regulating the conserved heat shock response pathway that is misregulated in diabetes. Importantly, we found that different combinations of TFs bound to distinct functional sets of genes, thereby helping to reveal the combinatorial regulatory code for metabolic and other cellular processes. In addition, the different TFs often bound near the promoters and coding regions of each other's genes suggesting an intricate network of interdependent regulation. Overall, our study provides an important framework for understanding the systems-level control of metabolic gene expression in humans.


Figures

Figure 1.
Figure 1.
Genome-wide occupancy of PPARGC1A determined by ChIP-seq. (A) Plot of the mean PPARGC1A ChIP enrichment signal (blue) in the region spanning ±2 kb from the signal peak across all 1886 PPARGC1A-occupied regions. (Gray) Mean signals from input DNA in the same regions. (B) Plot of the mean phastCons conservation scores in the region spanning ±2 kb from the signal peak across all PPARGC1A-occupied regions. The phastCons conservation score (ranging from 0 to 1) represents the probability that a base is in a conserved element (Siepel et al. 2005). (C) Pie chart displaying the distribution of PPARGC1A binding sites relative to UCSC Known Genes transcript annotations (Hsu et al. 2006). Each PPARGC1A binding site was mapped to one of four annotation categories in the following order of preference: TSS (peak within 5 kb), 3′-end (peak within 5 kb), intragenic, intergenic. The total number of sites mapping to each category is displayed within the corresponding portion of the pie chart. (D) Distribution of all 715 TSS-associated PPARGC1A binding sites relative to the position of the nearest TSS. As demonstrated in the transcript diagram below the plot, binding positions are plotted with respect to the orientation of the associated transcript; negative positions indicate binding in the upstream region and positive positions indicate binding in the downstream region.
Figure 2.
Figure 2.
Discovery of enriched sequence motifs in PPARGC1A-occupied regions. (A) (Left panel) The top three DNA sequence motifs identified in an unbiased analysis of PPARGC1A-occupied regions using MEME. The MEME E-value, a measure of statistical significance (Bailey and Elkan 1994), is displayed above each motif. (Right panel) The most similar motif in the TRANSFAC database is displayed for each MEME motif (Matys et al. 2006). Comparison with the TRANSFAC database was performed using Tomtom (Gupta et al. 2007). The motif accession number and name from TRANSFAC and P-value from Tomtom are listed above each TRANSFAC motif. Motif logos were generated using the WebLogo tool (http://weblogo.berkeley.edu/). (B) The genomic DNA sequences of all PPARGC1A-occupied regions (±100 bp from each peak) were scanned for matches to each of the three motifs identified by MEME analysis. Colored wedges within each pie chart represent the fraction of all PPARGC1A binding sites that contain at least one match to the indicated DNA sequence motif. The number of regions in which a match is present or absent is indicated. Motif matches were identified using FIMO with a similarity P-value threshold of 0.01 (Bailey et al. 2009). (C) The mean phastCons conservation score (Siepel et al. 2005) across all motif-containing PPARGC1A binding sites is plotted in a 200-bp window centered on the start position of the motif. (Black boxes) Position of the corresponding motif. (Open circles) Points in each plot that correspond to base pairs constituting the motif. (D) PPARGC1A binds in close proximity to HSEs in a subset of occupied regions. A PPARGC1A binding site in the promoter of the HSP90AA1 gene is shown as an example. The genomic position of the HSE in the HSP90AA1 promoter is indicated as a red box beneath the PPARGC1A signal map. The sequence of the HSE, containing six inverted repeats of the consensus sequence nGAAn (Hickey et al. 1989; Mathur et al. 1994), is displayed in the expanded view. (X-axis) Chromosomal positions. Gene structure is shown to scale above the signal plot. (Arrow) Genomic coordinate of the PPARGC1A signal peak.
Figure 3.
Figure 3.
Genome-wide patterns of binding and colocalization of PPARGC1A and its network partners. (A) Pairwise colocalization of transcriptional regulators within multi-RFBRs. Numbers in each cell represent the number of multi-RFBRs that are co-occupied by the corresponding pair of regulators. The first cell in each column indicates the total number of multi-RFBRs bound by each regulator. Cells are colored by the fraction of all 16,712 multi-RFBRs identified in the genome. Factors are ordered by decreasing number of multi-RFBRs bound. (B) Heatmap depicting the clustering of transcriptional regulators based on the similarity of their colocalization patterns. Colors in the heatmap indicate the strength of association between each pair of regulators (odds ratio from a Fisher's exact test; see Methods). Two groups of regulators exhibiting highly similar colocalization patterns based on the results of clustering are outlined in blue boxes. (C) Distribution of transcriptional regulator binding sites relative to UCSC Known Genes transcript annotations (Hsu et al. 2006). Factors are ordered by increasing proportion of TSS-adjacent binding sites. (D) Bar graph depicting the fraction of binding sites within 5 kb of an RNA pol II peak for each regulator.
Figure 4.
Figure 4.
Regulator occupancy corresponds with gene expression changes in forskolin-treated HepG2 cells. (Left panel) Replicate gene expression measurements from Illumina BeadArrays were used to rank 18,000 genes by fold induction after 6 h treatment with forskolin. (Right panel) The distribution of regulator-occupied genes within the ranked list is depicted as a heatmap. The ranked list was divided into 18 rank groups containing 1000 genes each and genes containing 5′-proximal, 3′-proximal, or intragenic binding sites were identified for each factor. Within each rank group, the fraction of genes that are occupied by a given factor was compared with the fraction expected from a random distribution. Colors in the heatmap represent the level of over- or under-representation of regulator-occupied genes. Association of regulator-occupied genes with both the top and bottom of the ranked list was determined to be statistically significant (P < 10−3) for CEBPB, HNF4A, GABP, HSF1, PPARGC1A, and ESRRA using gene set enrichment analysis (Subramanian et al. 2005). NR3C1-occupied genes were significantly associated with the top of the ranked list only (P < 10−3).
Figure 5.
Figure 5.
Recruitment of PPARGC1A to distinct clusters of TF binding sites. (A) Combinatorial binding patterns of PPARGC1A with its network partners displayed as a heatmap. PPARGC1A binding sites were grouped based on the number of bound factors, as indicated to the left of each group. Sites containing two or more factors correspond to PPARGC1A-bound multi-RFBRs. Within each group, binding sites were sorted by decreasing intensity of PPARGC1A binding, based on the number of sequence tags mapping to multi-RFBRs or within 200 bp of the PPARGC1A peak for sites bound by PPARGC1A only. Colors from yellow to red reflect increasing tag count. (Gray) Sites that are not bound by a given TF. TFs are ordered from left to right by decreasing colocalization with PPARGC1A. RNA pol II binding is included for reference in the last column. (B) Predominant regulator combinations at PPARGC1A-bound multi-RFBRs. PPARGC1A-bound multi-RFBRs were grouped based on the number of bound factors as in A. For each group, the total number of multi-RFBRs is listed, along with the top three distinct regulator combinations and the number of times each combination is observed. (Colored boxes) Binding by the respective regulator. (C) Differential enrichment of GO categories among genes occupied by PPARGC1A and each of its network partners. Relative fold enrichment is displayed as a heatmap with columns clustered by similarity. Representative GO categories are shown; the complete set of differentially enriched GO categories is listed in Supplemental Table S9. NR3C1 is excluded due to the small number of targets overlapping with PPARGC1A.
Figure 6.
Figure 6.
Transcriptional regulatory circuitry of PPARGC1A and its network partners. (A) Regulator binding at the PPARGC1A locus. Signal maps are displayed for four factors that occupy PPARGC1A. Significant peaks (q < 0.01) are indicated by colored lines under each signal map. (X-axis) Chromosomal positions. Gene structure is shown to scale below the signal maps. (B) Transcriptional regulatory network diagram displaying interactions among CEBPB, ESRRA, GABP, NR3C1, HNF4A, HSF1, and PPARGC1A. (Arrows) Direct binding of one regulator to the 5′-proximal, 3′-proximal, or intragenic region of the gene encoding another regulator (or the same regulator in the case of autoregulatory loops). (C) Regulatory hierarchy among the seven regulators depicted in B. Factors are ranked first by the number of incoming network connections (“kin”) then by the number of outgoing network connections (“kout”) (Borneman et al. 2006). (D) Expanded transcriptional regulatory network. Additional TFs were added to the core network shown in B, represented here by the circle in the center of the diagram, if they contained four or more incoming network connections. The number of incoming connections is indicated by arrow types according to the legend. Fifteen representative TFs are shown; the complete list of 155 TFs in the expanded network and their bound regulators is available in Supplemental Table S10.

References

    1. Andersson U, Scarpulla RC 2001. Pgc-1-related coactivator, a novel, serum-inducible coactivator of nuclear respiratory factor 1-dependent transcription in mammalian cells. Mol Cell Biol 21: 3738–3749 - PMC - PubMed
    1. Bailey TL, Elkan C 1994. Fitting a mixture model by expectation maximization to discover motifs in biopolymers. Proc Int Conf Intell Syst Mol Biol 2: 28–36 - PubMed
    1. Bailey TL, Boden M, Buske FA, Frith M, Grant CE, Clementi L, Ren J, Li WW, Noble WS 2009. MEME SUITE: Tools for motif discovery and searching. Nucleic Acids Res 37: W202–W208 - PMC - PubMed
    1. Barabasi AL, Oltvai ZN 2004. Network biology: Understanding the cell's functional organization. Nat Rev Genet 5: 101–113 - PubMed
    1. Blais A, Dynlacht BD 2005. Constructing transcriptional regulatory networks. Genes Dev 19: 1499–1511 - PubMed

Publication types

MeSH terms

Substances

LinkOut - more resources