. 2012 Sep;22(9):1711-22.
doi: 10.1101/gr.135129.111.

Predicting cell-type-specific gene expression from regions of open chromatin

Affiliations

Predicting cell-type-specific gene expression from regions of open chromatin

Anirudh Natarajan et al. Genome Res. 2012 Sep.

Abstract

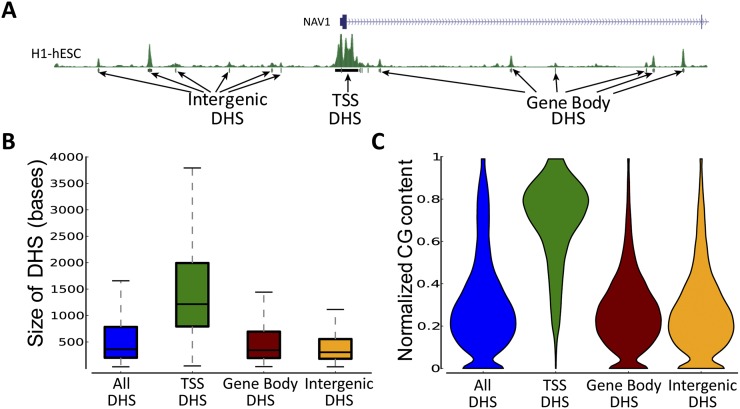
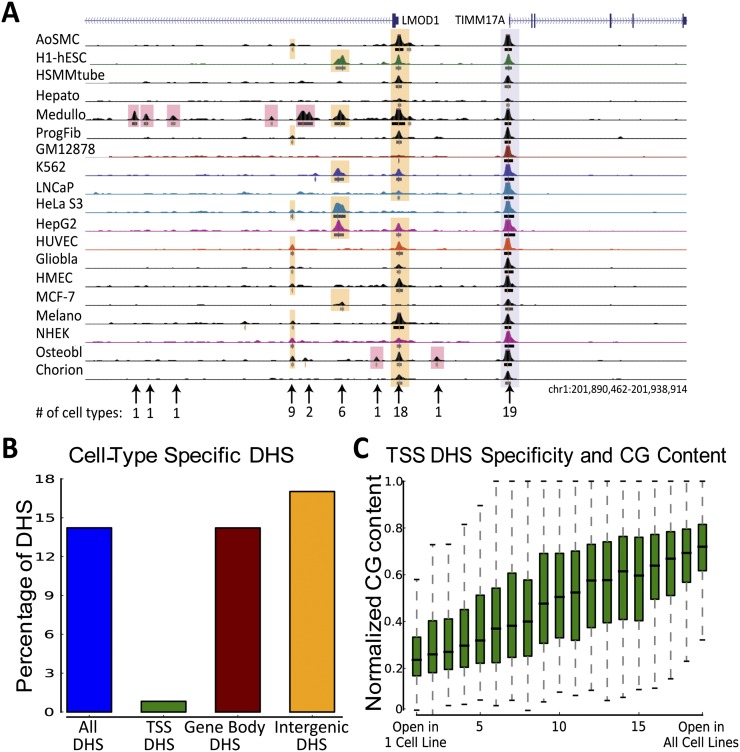
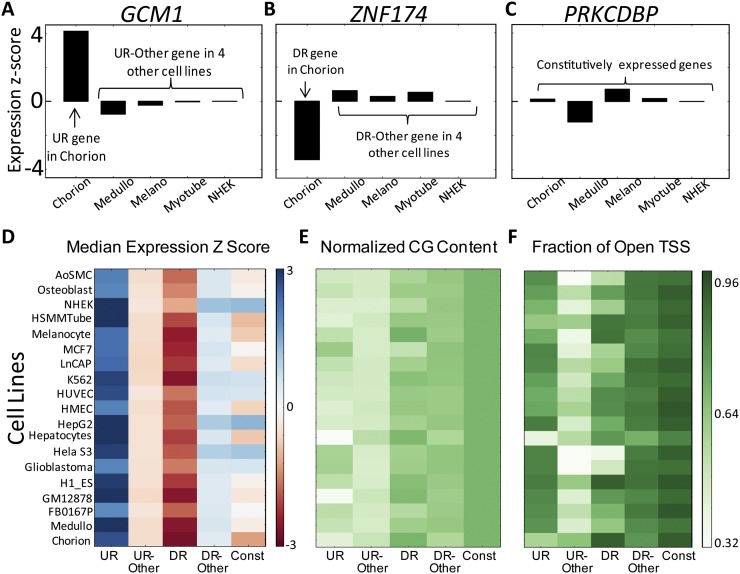
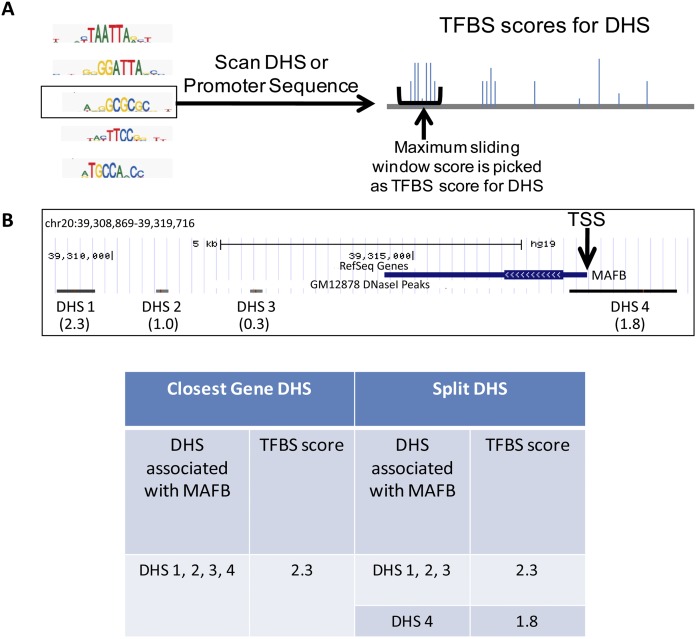
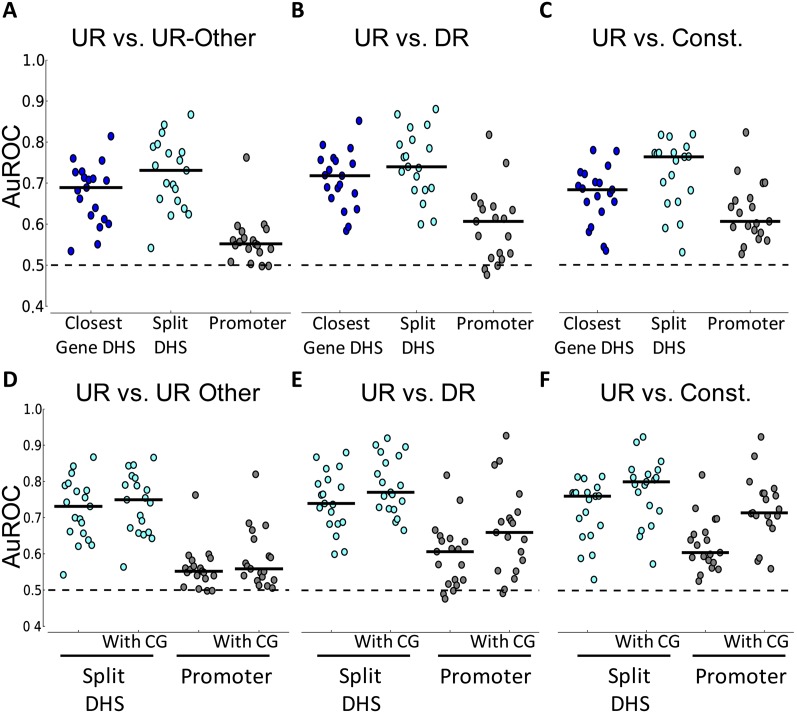
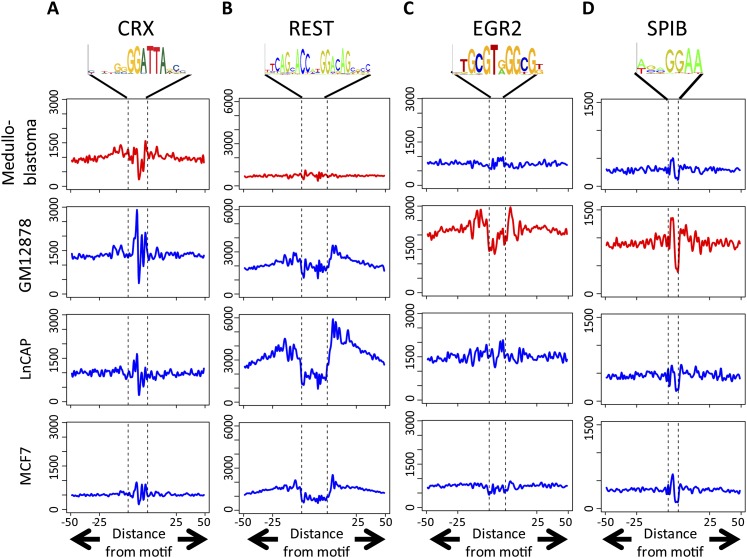
Complex patterns of cell-type-specific gene expression are thought to be achieved by combinatorial binding of transcription factors (TFs) to sequence elements in regulatory regions. Predicting cell-type-specific expression in mammals has been hindered by the oftentimes unknown location of distal regulatory regions. To alleviate this bottleneck, we used DNase-seq data from 19 diverse human cell types to identify proximal and distal regulatory elements at genome-wide scale. Matched expression data allowed us to separate genes into classes of cell-type-specific up-regulated, down-regulated, and constitutively expressed genes. CG dinucleotide content and DNA accessibility in the promoters of these three classes of genes displayed substantial differences, highlighting the importance of including these aspects in modeling gene expression. We associated DNase I hypersensitive sites (DHSs) with genes, and trained classifiers for different expression patterns. TF sequence motif matches in DHSs provided a strong performance improvement in predicting gene expression over the typical baseline approach of using proximal promoter sequences. In particular, we achieved competitive performance when discriminating up-regulated genes from different cell types or genes up- and down-regulated under the same conditions. We identified previously known and new candidate cell-type-specific regulators. The models generated testable predictions of activating or repressive functions of regulators. DNase I footprints for these regulators were indicative of their direct binding to DNA. In summary, we successfully used information of open chromatin obtained by a single assay, DNase-seq, to address the problem of predicting cell-type-specific gene expression in mammalian organisms directly from regulatory sequence.


Figures

Figure 1.
Figure 1.
Properties of DHS based on genomic location. (A) DHSs that are intergenic and those that are overlapping the TSS and gene body were classified as Intergenic, TSS, and Gene Body DHSs, respectively (Chr1: 201,566,484–201,683,121). (B) Sizes of different DHSs for the Chorion cell line. Data from only one cell line were used to avoid multiple counting of ubiquitous DHSs. Other cell lines show similar trends. Outliers are not plotted. (C) Violin plot showing normalized CG content for different DHSs in the Chorion cell line. The subset of DHSs with a normalized CG content of zero is comparatively small (median of 128 bp).
Figure 2.
Figure 2.
Cell-type specificity of hypersensitive regions. (A) Example (Chr1: 201,890,462–201,938,914) showing cell-type–specific DHSs across two cell lines (pink boxes). Note that we called a DHS cell-type–specific if it did not overlap another DHS by more than half in any of the 18 other cell lines. (B) Bar graph showing the proportions of cell-type–specific DHSs across different genomic locations averaged across all cell lines. (C) TSSs were divided by the number of cell lines that they overlapped in a region of open chromatin. For each set of TSSs, normalized CG content in the promoter regions (−900,100) of the TSSs are shown.
Figure 3.
Figure 3.
Cell-type–specific gene expression and definition of gene classes. (A–C) Representative examples of different patterns of gene expression. Note that Z-score values are calculated from expression across all 19 cell lines. (A) A gene where the expression is specifically up-regulated in the first cell line (UR gene). (B) A gene that is specifically down-regulated in the first cell line (DR gene). (C) A gene that has low variability in expression (constitutively expressed gene). (D) Median expression Z-scores for the genes in each set in each cell line. (E) Normalized CG content from the promoter regions of genes. (F) The fraction of TSS in each gene set that were in a region of open chromatin. E and F share the same color map.
Figure 4.
Figure 4.
Transcription factor binding site features. (A) DHS and promoter sequences are scanned with PWMs. TFBS scores are log-likelihood ratios of PWM over the background model. A sliding window is used to identify the score for each DHS or promoter. (B) Example to show association of DHSs with genes. Numbers in the brackets are example TFBS scores for the DHS for a specific DHS. Two methods of association were used. In closest gene DHS, DHSs 1–4 from the GM12878 cell line are associated with the gene MAFB. For the TF in consideration, the maximum of all TFBS scores is 2.3. In Split DHS, we separated DHSs overlapping the TSS and other DHSs. This resulted in two features for each gene for each TF.
Figure 5.
Figure 5.
Classifier performance for various classification tasks. (A–C) Performance of the classifier using all PWMs. Each figure compares the performance of two methods of associating DHSs to genes (Closest Gene DHS and Split DHS) with the proximal promoter. The solid black lines across the dots indicate the median. Across all figures, the promoter sequence classifier does not perform as well as the performance achieved by using Closest Gene DHS and Split DHS and is significant at the 0.05 level (paired t-test). (D–F) Impact of normalized CG dinucleotide content on classifier performance. Results using the Split DHS and promoter sequence are shown. Without CG, columns are the same as in A–C. All figures show average results from five iterations of fourfold cross-validation. The dotted line indicates an AuROC of 0.5, which is the performance of a random classifier.
Figure 6.
Figure 6.
Aggregate plots of DNase-reads around motifs for factors with high regression coefficients. (Red lines) The cell line in which the TF is identified as a regulator. (A) CRX shows a footprint in medulloblastoma but not in the other cell lines shown. (B) REST shows a footprint in other cell lines but not in medulloblastoma, where it is not expressed. (C,D) EGR2 and SPIB show footprints in the GM12878 cell line.

Similar articles

Cited by

References

    1. Aerts S, Van Loo P, Thijs G, Moreau Y, De Moor B 2003. Computational detection of cis-regulatory modules. Bioinformatics (Suppl 2) 19: ii5–ii14 - PubMed
    1. Bailey TL, Boden M, Whitington T, Machanick P 2010. The value of position-specific priors in motif discovery using MEME. BMC Bioinformatics 11: 179 doi: 10.1186/1471-2105-11-179 - PMC - PubMed
    1. Bemmo A, Benovoy D, Kwan T, Gaffney DJ, Jensen RV, Majewski J 2008. Gene expression and isoform variation analysis using Affymetrix Exon Arrays. BMC Genomics 9: 529 doi: 10.1186/1471-2164-9-529 - PMC - PubMed
    1. Blow MJ, McCulley DJ, Li Z, Zhang T, Akiyama JA, Holt A, Plajzer-Frick I, Shoukry M, Wright C, Chen F, et al. 2010. ChIP-seq identification of weakly conserved heart enhancers. Nat Genet 42: 806–810 - PMC - PubMed
    1. Boyle AP, Davis S, Shulha HP, Meltzer P, Margulies EH, Weng Z, Furey TS, Crawford GE 2008a. High-resolution mapping and characterization of open chromatin across the genome. Cell 132: 311–322 - PMC - PubMed

Publication types

Associated data