. 2012 Sep;22(9):1798-812.
doi: 10.1101/gr.139105.112.

Sequence features and chromatin structure around the genomic regions bound by 119 human transcription factors

Affiliations

Sequence features and chromatin structure around the genomic regions bound by 119 human transcription factors

Jie Wang et al. Genome Res. 2012 Sep.

Abstract

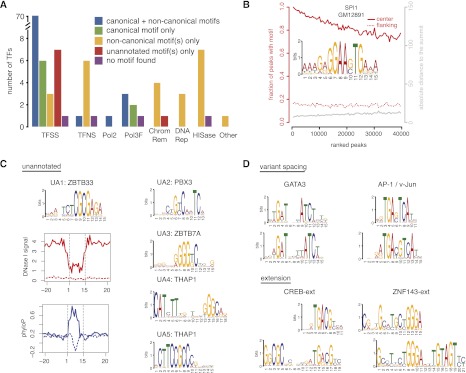
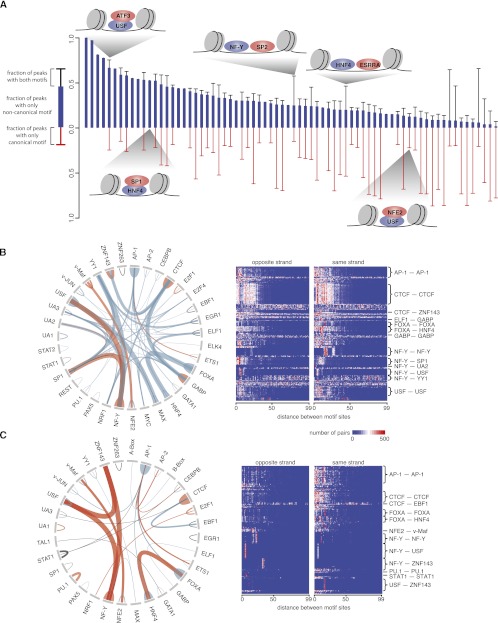
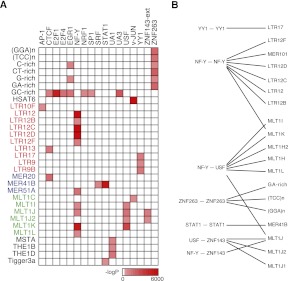
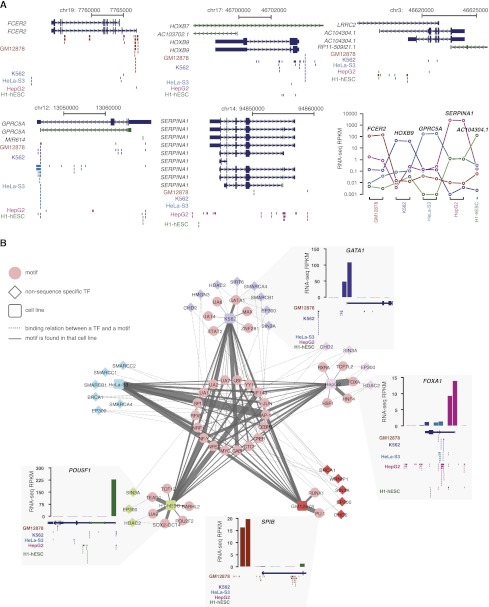
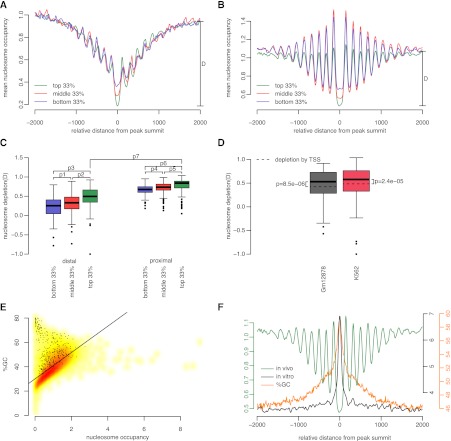
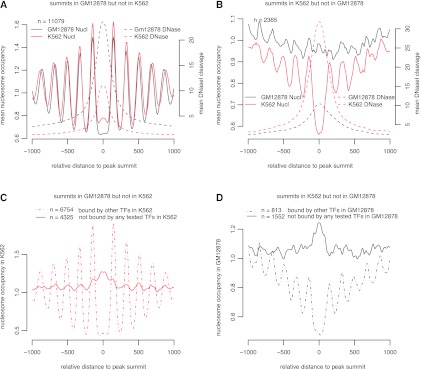
Chromatin immunoprecipitation coupled with high-throughput sequencing (ChIP-seq) has become the dominant technique for mapping transcription factor (TF) binding regions genome-wide. We performed an integrative analysis centered around 457 ChIP-seq data sets on 119 human TFs generated by the ENCODE Consortium. We identified highly enriched sequence motifs in most data sets, revealing new motifs and validating known ones. The motif sites (TF binding sites) are highly conserved evolutionarily and show distinct footprints upon DNase I digestion. We frequently detected secondary motifs in addition to the canonical motifs of the TFs, indicating tethered binding and cobinding between multiple TFs. We observed significant position and orientation preferences between many cobinding TFs. Genes specifically expressed in a cell line are often associated with a greater occurrence of nearby TF binding in that cell line. We observed cell-line-specific secondary motifs that mediate the binding of the histone deacetylase HDAC2 and the enhancer-binding protein EP300. TF binding sites are located in GC-rich, nucleosome-depleted, and DNase I sensitive regions, flanked by well-positioned nucleosomes, and many of these features show cell type specificity. The GC-richness may be beneficial for regulating TF binding because, when unoccupied by a TF, these regions are occupied by nucleosomes in vivo. We present the results of our analysis in a TF-centric web repository Factorbook (http://factorbook.org) and will continually update this repository as more ENCODE data are generated.


Figures

Figure 1.
Figure 1.
De novo discovery of sequence motifs. (A) Statistics of motif discovery among 119 TFs, classified into 87 Pol II-associated sequence-specific TFs (TFSS), eight general Pol II-associated, non-sequence-specific TFs (TFNS), Pol II (Pol2), six Pol III components and Pol III-associated TFs (Pol3F), five ATP-dependent chromatin complexes (ChromRem), three TFs involved in DNA repair (DNARep), eight histone modification complexes (HISase), and one cyclin kinase associated with transcription (Other). The TATA box binding protein (TBP) is included in the TFNS category and its canonical motif is TATA, corresponding to the blue bar. (B) Example result for SPI1 in GM12891 cells illustrating the percentage of peaks with the motif (left, y-axis in red) and distribution of absolute distances of the closer edge of motif sites relative to the peak summit (right, y-axis in gray), plotted against ranks of peaks (ranked by ChIP-seq signal). (C) Five previously unannotated motifs that are likely to be canonical motifs of four sequence-specific TFs. Also shown are DNase I footprint and sequence conservation profiles around the sites of UA1 (likely the canonical motif of ZBTB33). Motif sites in ChIP-seq peaks (solid lines) were compared with motif sites outside peaks (dashed lines). DNase I and ChIP-seq data were both from K562 cells. Sequence conservation was computed using phyloP (Pollard et al. 2010). (D) Motifs with variant spacing and extensions.
Figure 2.
Figure 2.
Interactions between TFs. (A) Different modes of interaction between TFs are shown. Each bar indicates the canonical TF and one noncanonical TF whose motifs were identified in the same ChIP-seq data set, and the red, blue, and black segments of the bar indicate percentage of peaks in the ChIP-seq data set that contain only canonical motif sites, only noncanonical motif sites, or both. Cartoons depict examples of different models for TF-TF interactions. (B) Circos plot (Krzywinski et al. 2009) on the left depicts pairs of motifs (connected by an arch) with significant distance preferences between their sites. The thickness of a connection is proportional to the normalized frequency of the pair. A connection is depicted as blue, black, or red when the motif pair is discovered in different data sets, the same data set, or both, respectively. The heat map on the right shows the distributions of distances between motif pairs. Each row is a motif pair in a particular ChIP-seq data set, and each column represents an edge-to-edge distance (from 0 bp to 99 bp). (C) Similar to B except showing motif pairs discovered in repetitive regions.
Figure 3.
Figure 3.
Binding sites of certain TFs or TF pairs are enriched in repeats. (A) Enrichment of TF binding sites in repetitive elements. The redness of each grid point is proportional to the negative logarithm of enrichment P-value. Repetitive elements are color-coded by family. (B) Enrichment of motif pairs that strongly prefer a narrow distance range in various repetitive elements (Fig. 2C).
Figure 4.
Figure 4.
Cell-type–specific binding of sequence-specific and non-sequence-specific TFs. (A) Abundant TF binding sites are observed near cell-line–specific transcripts. Binding sites are shown as vertical bars and colored by cell line (dark blue for K562, red for HepG2, brown for GM12878, green for H1-hESC, and cyan for HeLa-S3). (Bottom, right) Expression levels (in RPKM) for example cell-line–specific transcripts across the five cell lines with the most ChIP-seq data. (B) Secondary motifs identified in the ChIP-seq data sets of sequence-specific TFs and their enrichment in the ChIP-seq peaks of non-sequence-specific TFs. The five cell lines are indicated with color-coded squares, noncanonical motifs of sequence-specific TFs are shown in pink circles and a solid line connecting each motif to the respective cell line. The thickness of the solid line is proportional to the normalized frequency in which a noncanonical motif is discovered in a particular cell line. Non-sequence-specific TFs are shown in diamonds whose colors match the color of the cell line if there is a ChIP-seq data set of the TF in that cell line. Dashed lines connect non-sequence-specific TFs and noncanonical motifs, indicating that a noncanonical motif of a sequence-specific TF is enriched in the ChIP-seq peaks of the non-sequence-specific TF. (Four insets) Expression profiles of sequence-specific TFs whose canonical motifs are found to be specific to a cell type and the TF binding sites around the genes that encode these TFs in the appropriate cell line. The expression levels in each cell line are assigned a similar color as the cell line. For four cell lines, two biological replicates were available for RNA-seq data; hence, there are two bars for each of these cell lines. Only one biological replicate was available for H1-hESC.
Figure 5.
Figure 5.
Chromatin structure and GC content around TF binding regions. (A,B) Nucleosome occupancy profiles anchored on the summits of TSS-proximal (A) and TSS-distal (B) peaks of YY1 grouped by ChIP-seq signal strength: top (green), middle (red), and bottom (blue) third peaks in terms of ChIP-seq signal. Nucleosome depletion for the top third peaks is shown as D in each panel. (C) Distribution of nucleosome depletion “D” across all tested TFs, with peaks stratified according to TSS proximity (proximal or distal) and ChIP-seq signal strength (top, middle, or bottom third). P-values for pairwise comparisons based on paired Wilcoxon rank-sum tests are: P1 = 8.2 × 10⁻¹⁷, P2 = 7.6 × 10⁻²¹, P3 = 3.8 × 10⁻²³, P4 = 8.8 × 10⁻¹⁰, P5 = 1.1 × 10⁻⁹, P6 = 1.1 × 10⁻¹¹, and P7 = 6.6 × 10⁻²². (D) TF binding is correlated with significantly more nucleosome depletion than TSS. Wilcoxon rank-sum test P-values are shown separately for GM12878 and K562 cells. For the box plots in C and D, only those subcategories with 200 or more peaks are included, and whiskers represent the 1.5 inter-quartile range. (E) Nucleosome occupancy genome-wide is correlated with GC%. The smoothed density scatter plot contains 40,000 data points; each data point is a randomly chosen 250-bp region of the human genome. (Black dots) Those regions that overlap with ChIP-seq peaks. (Black line) Least square fit. Pearson correlation coefficient = 0.62; P-value < 2.2 × 10⁻¹⁶. (F) Comparison of in vivo (green) and in vitro (black) nucleosome occupancy profiles around peak summits of YY1. GC% profile around the same summits is plotted in orange. Note elevated GC% at summit coincides with high in vitro nucleosome occupancy and low in vivo nucleosome occupancy.
Figure 6.
Figure 6.
Chromatin structure around YY1 ChIP-seq peaks occupied differentially between GM12878 and K562. (A) Nucleosome occupancy profiles (solid lines) and DNase I cleavage profiles (dashed lines) anchored on the summits of YY1 peaks in GM12878 but not in K562. Note the average nucleosome occupancy at these peaks (x = 0) is lower in GM12878 than in K562, while the average DNase I cleavage at these peaks is higher in GM12878 than in K562. (B) Same as A, but around the summits of YY1 peaks in K562 but not in GM12878. (C) Nucleosome occupancy profiles in K562 anchored on the summits of the ChIP-seq peaks occupied by YY1 in GM12878 but not in K562. These 11,079 peaks were divided into two groups: 6754 peaks were bound by one or more TFs in K562 (dashed line), and 4325 peaks were not bound by any TF for which we had ChIP-seq data in K562 (solid line). Note high nucleosome occupancy at the summits of the unoccupied peaks (x = 0) and the lack of positioned nucleosomes flanking the unbound peaks, in sharp contrast to the lack of nucleosome occupancy at the peak summits and well-positioned nucleosomes flanking the peaks bound by other TFs. (D) Same as C, but around the summits of the ChIP-seq peaks occupied by YY1 in K562 but not in GM12878.

References

    1. Badis G, Berger MF, Philippakis AA, Talukder S, Gehrke AR, Jaeger SA, Chan ET, Metzler G, Vedenko A, Chen X, et al. 2009. Diversity and complexity in DNA recognition by transcription factors. Science 324: 1720–1723 - PMC - PubMed
    1. Berger SL 2007. The complex language of chromatin regulation during transcription. Nature 447: 407–412 - PubMed
    1. Biggin MD 2011. Animal transcription networks as highly connected, quantitative continua. Dev Cell 21: 611–626 - PubMed
    1. Bilodeau S, Kagey MH, Frampton GM, Rahl PB, Young RA 2009. SetDB1 contributes to repression of genes encoding developmental regulators and maintenance of ES cell state. Genes Dev 23: 2484–2489 - PMC - PubMed
    1. Bourque G, Leong B, Vega VB, Chen X, Lee YL, Srinivasan KG, Chew J-L, Ruan Y, Wei C-L, Ng H-H, et al. 2008. Evolution of the mammalian transcription factor binding repertoire via transposable elements. Genome Res 18: 1752–1762 - PMC - PubMed

Publication types

LinkOut - more resources