Evidence that glucose is the major transferred metabolite in dinoflagellate-cnidarian symbiosis
- PMID: 22956249
- PMCID: PMC3597287
- DOI: 10.1242/jeb.070946
Evidence that glucose is the major transferred metabolite in dinoflagellate-cnidarian symbiosis
Abstract
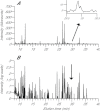
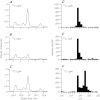
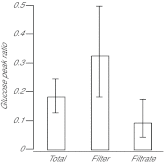
Reef-building corals and many other cnidarians are symbiotic with dinoflagellates of the genus Symbiodinium. It has long been known that the endosymbiotic algae transfer much of their photosynthetically fixed carbon to the host and that this can provide much of the host's total energy. However, it has remained unclear which metabolite(s) are directly translocated from the algae into the host tissue. We reexamined this question in the small sea anemone Aiptasia using labeling of intact animals in the light with (13)C-bicarbonate, rapid homogenization and separation of animal and algal fractions, and analysis of metabolite labeling by gas chromatography-mass spectrometry. We found labeled glucose in the animal fraction within 2 min of exposure to (13)C-bicarbonate, whereas no significant labeling of other compounds was observed within the first 10 min. Although considerable previous evidence has suggested that glycerol might be a major translocated metabolite, we saw no significant labeling of glycerol within the first hour, and incubation of intact animals with (13)C-labeled glycerol did not result in a rapid production of (13)C-glucose. In contrast, when Symbiodinium cells freshly isolated from host tissue were exposed to light and (13)C-bicarbonate in the presence of host homogenate, labeled glycerol, but not glucose, was detected in the medium. We also observed early production of labeled glucose, but not glycerol, in three coral species. Taken together, the results suggest that glucose is the major translocated metabolite in dinoflagellate-cnidarian symbiosis and that the release of glycerol from isolated algae may be part of a stress response.
Figures


Similar articles
-
Influence of Symbiont Species on the Glycerol and Glucose Pools in a Model Cnidarian-Dinoflagellate Symbiosis.Biol Bull. 2020 Oct;239(2):143-151. doi: 10.1086/710349. Epub 2020 Sep 29. Biol Bull. 2020. PMID: 33151753
-
Evidence for miRNA-mediated modulation of the host transcriptome in cnidarian-dinoflagellate symbiosis.Mol Ecol. 2018 Jan;27(2):403-418. doi: 10.1111/mec.14452. Epub 2017 Dec 23. Mol Ecol. 2018. PMID: 29218749
-
Development and Symbiosis Establishment in the Cnidarian Endosymbiosis Model Aiptasia sp.Sci Rep. 2016 Jan 25;6:19867. doi: 10.1038/srep19867. Sci Rep. 2016. PMID: 26804034 Free PMC article.
-
Cell biology of cnidarian-dinoflagellate symbiosis.Microbiol Mol Biol Rev. 2012 Jun;76(2):229-61. doi: 10.1128/MMBR.05014-11. Microbiol Mol Biol Rev. 2012. PMID: 22688813 Free PMC article. Review.
-
Cellular mechanisms of Cnidarian bleaching: stress causes the collapse of symbiosis.J Exp Biol. 2008 Oct;211(Pt 19):3059-66. doi: 10.1242/jeb.009597. J Exp Biol. 2008. PMID: 18805804 Review.
Cited by
-
Comparative analysis of bacterial communities associated with healthy and diseased corals in the Indonesian sea.PeerJ. 2019 Dec 19;7:e8137. doi: 10.7717/peerj.8137. eCollection 2019. PeerJ. 2019. PMID: 31875145 Free PMC article.
-
Coral endosymbionts (Symbiodiniaceae) emit species-specific volatilomes that shift when exposed to thermal stress.Sci Rep. 2019 Nov 22;9(1):17395. doi: 10.1038/s41598-019-53552-0. Sci Rep. 2019. PMID: 31758008 Free PMC article.
-
Immunolocalization of Metabolite Transporter Proteins in a Model Cnidarian-Dinoflagellate Symbiosis.Appl Environ Microbiol. 2022 Jun 28;88(12):e0041222. doi: 10.1128/aem.00412-22. Epub 2022 Jun 9. Appl Environ Microbiol. 2022. PMID: 35678605 Free PMC article.
-
Increased incompatibility of heterologous algal symbionts under thermal stress in the cnidarian-dinoflagellate model Aiptasia.Commun Biol. 2022 Jul 28;5(1):760. doi: 10.1038/s42003-022-03724-y. Commun Biol. 2022. PMID: 35902758 Free PMC article.
-
Production possibility frontiers in phototroph:heterotroph symbioses: trade-offs in allocating fixed carbon pools and the challenges these alternatives present for understanding the acquisition of intracellular habitats.Front Microbiol. 2014 Jul 17;5:357. doi: 10.3389/fmicb.2014.00357. eCollection 2014. Front Microbiol. 2014. PMID: 25101064 Free PMC article.
References
-
- Annesley T. M. (2003). Ion suppression in mass spectrometry. Clin. Chem. 49, 1041-1044 - PubMed
-
- Arning E. T., Birgel D., Schulz-Vogt H. N., Holmkvist L., JØrgensen B. B., Larson A., Peckmann J. (2008). Lipid biomarker patterns of phosphogenic sediments from upwelling regions. Geomicrobiol. J. 25, 69-82
-
- Blumenberg M., Seifert R., Petersen S., Michaelis W. (2007). Biosignatures present in a hydrothermal massive sulfide from the Mid-Atlantic Ridge. Geobiology 5, 435-450
-
- Christensen B., Thykaer J., Nielsen J. (2000). Metabolic characterization of high- and low-yielding strains of Penicillium chrysogenum. Appl. Microbiol. Biotechnol. 54, 212-217 - PubMed
Publication types
MeSH terms
Substances
Grants and funding
LinkOut - more resources
Full Text Sources

