. 2012 Nov 15;125(Pt 22):5479-88.
doi: 10.1242/jcs.110072. Epub 2012 Sep 6.

Intracellular chloride channel protein CLIC1 regulates macrophage function through modulation of phagosomal acidification

Affiliations

Intracellular chloride channel protein CLIC1 regulates macrophage function through modulation of phagosomal acidification

Lele Jiang et al. J Cell Sci. .

Abstract

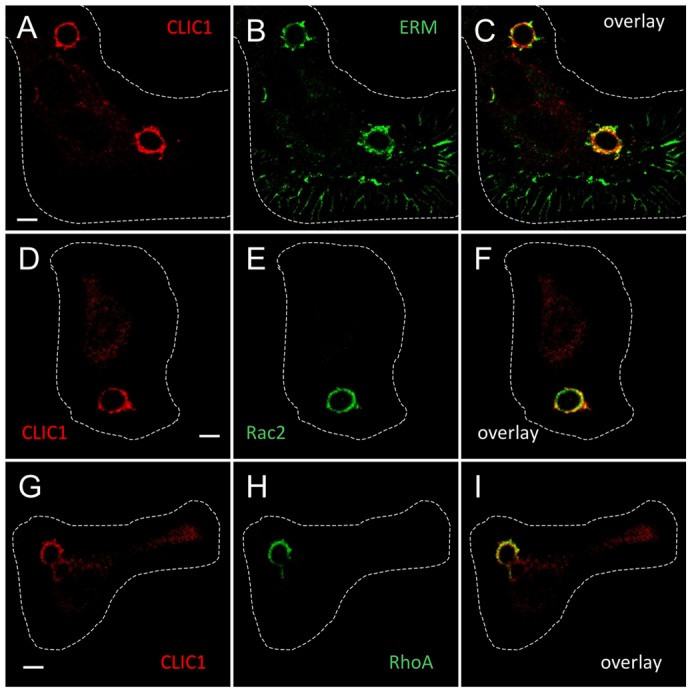
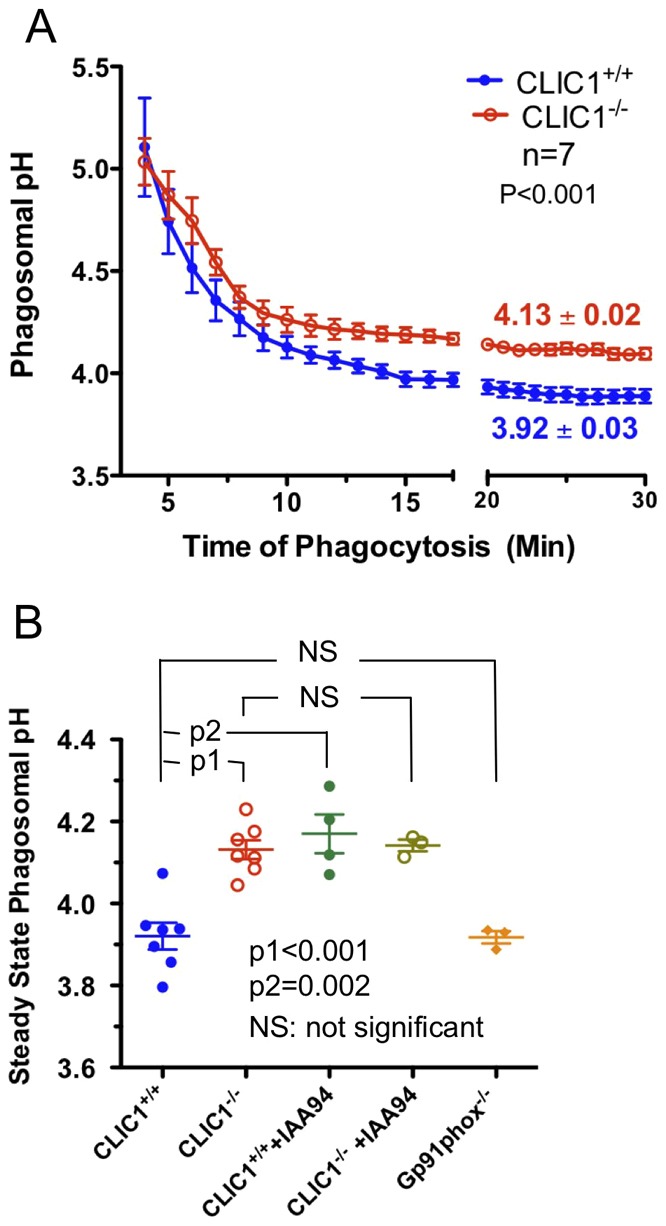
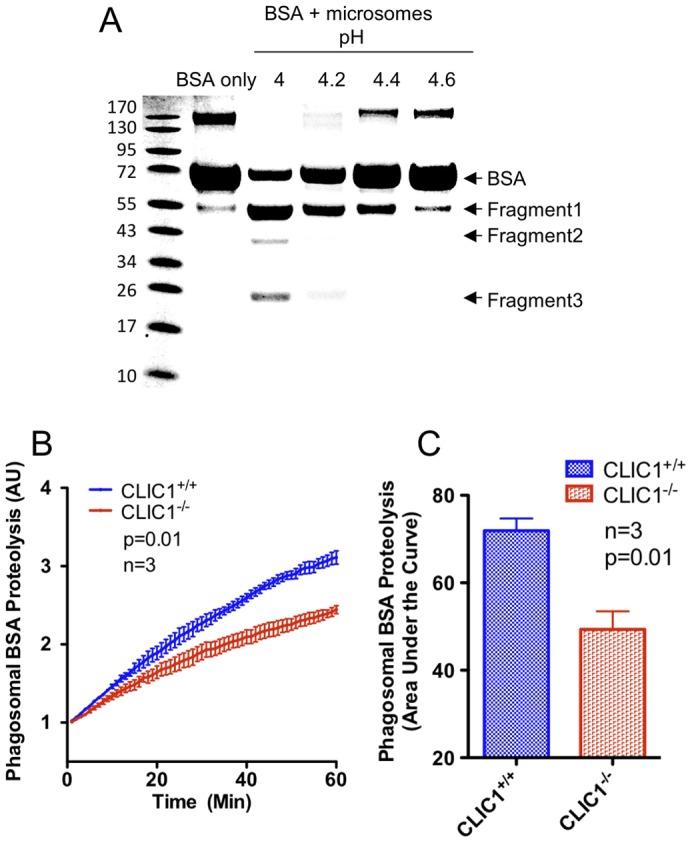
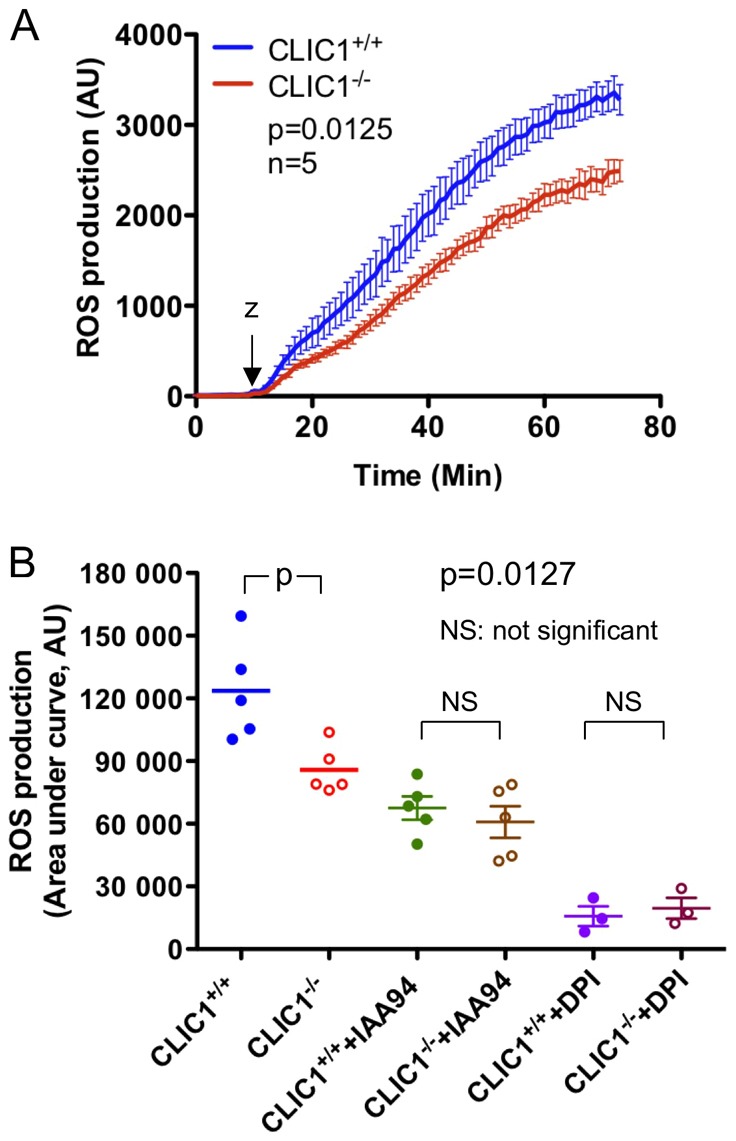
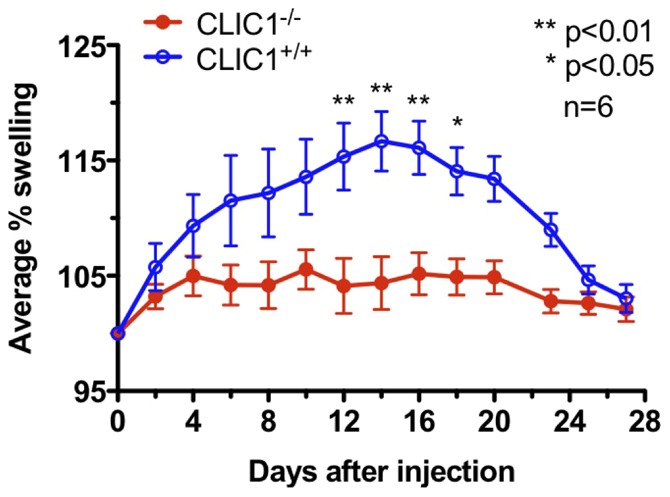
Intracellular chloride channel protein 1 (CLIC1) is a 241 amino acid protein of the glutathione S transferase fold family with redox- and pH-dependent membrane association and chloride ion channel activity. Whilst CLIC proteins are evolutionarily conserved in Metazoa, indicating an important role, little is known about their biology. CLIC1 was first cloned on the basis of increased expression in activated macrophages. We therefore examined its subcellular localisation in murine peritoneal macrophages by immunofluorescence confocal microscopy. In resting cells, CLIC1 is observed in punctate cytoplasmic structures that do not colocalise with markers for endosomes or secretory vesicles. However, when these macrophages phagocytose serum-opsonised zymosan, CLIC1 translocates onto the phagosomal membrane. Macrophages from CLIC1(-/-) mice display a defect in phagosome acidification as determined by imaging live cells phagocytosing zymosan tagged with the pH-sensitive fluorophore Oregon Green. This altered phagosomal acidification was not accompanied by a detectable impairment in phagosomal-lysosomal fusion. However, consistent with a defect in acidification, CLIC1(-/-) macrophages also displayed impaired phagosomal proteolytic capacity and reduced reactive oxygen species production. Further, CLIC1(-/-) mice were protected from development of serum transfer induced K/BxN arthritis. These data all point to an important role for CLIC1 in regulating macrophage function through its ion channel activity and suggest it is a suitable target for the development of anti-inflammatory drugs.


Figures

Fig. 1.
Fig. 1.
Subcellular localisation of CLIC1 in resting macrophage. Immunofluorescence confocal microscopic images show a resting peritoneal macrophage from CLIC1+/+ mice (A–D) stained with the CLIC1 antibody (A,C,D, red) which does not colocalise with EEA1 positive early endosomes (B,C,D, green). The nuclei have been stained (blue) using TO-Pro 3 (A–C). (EH) The CLIC1 punctate structure (E,G,H, red) does not colocalise with transferrin positive endosomes (F,G,H, green). Scale bar: 5 µm.
Fig. 2.
Fig. 2.
CLIC1 is localised to the phagosome membrane. Confocal fluorescence microscopy of peritoneal macrophages 5 min after phagocytosis of serum-opsonised zymosan particles. Cells were stained with antibody to CLIC1 (A,C,D,F, red), and the membrane markers EEA1 (B,C, green) or LAMP1 (E,F, green). Scale bar: 5 µm.
Fig. 3.
Fig. 3.
Spatial correlation of phagosome localised CLIC1 with ERM, Rac2, and RhoA. Confocal fluorescent microscopy of peritoneal macrophages, 5 min after phagocytosis of serum-opsonised zymosan particles, were stained for CLIC1 (A,C,D,F,G,I, red) and either ERM (B,C, green), Rac2 (E,F, green) or RhoA (H,I, green). Scale bar: 5 µm.
Fig. 4.
Fig. 4.
Spatial correlation of CLIC1 with NOX2 components. Confocal fluorescent microscopy of peritoneal macrophages 5 min after phagocytosis of serum-opsonised zymosan particles were stained for CLIC1 (A,C,D,F, red) and either gp91phox (B,C, green) or p67phox (E,F, green). CLIC1 and both gp91phox and p67phox appear on the phagosomal membrane although CLIC1 and gp91phox have different distribution patterns (arrows, A–C). Scale bar: 5 µm.
Fig. 5.
Fig. 5.
Phagosomal acidification. Intraphagosomal pH of peritoneal macrophages that had undergone synchronised phagocytosis of serum-opsonised zymosan particles covalently coupled with the pH-sensitive fluorescence probe Oregon Green, were monitored by live cell imaging on an inverted Zeiss Axiovert 200 M microscope with excitation at 490 nm and emission at 525 nm. Zymosan containing macrophage phagosomes from 7 pairs of CLIC1+/+ and CLIC1−/− mice were followed in real time and the pH calculated at 60 second intervals (A). The steady state pH, calculated as the average pH between 20 and 30 minutes after synchronised phagocytosis, is displayed for CLIC1+/+ and CLIC1−/− macrophage phagosomes, with or without the CLIC ion channel blocker IAA94 (B). Steady state phagosomal pH from peritoneal macrophages from gp91phox−/− mice is also displayed (B).
Fig. 6.
Fig. 6.
Phagosomal-lysosomal fusion. Absence of CLIC1 channel does not affect phagosomal-lysosomal fusion in macrophages. Phagosomal-lysosomal fusion was measured by recording FRET efficiency between a particle-bound donor fluorophore Alexa Fluor 488 (excitation 485 nm; emmision 520 nm) and a fluid-phase lysosomal acceptor fluorophore Alexa Fluor 594 hydrazide (excitation 485 nm; emmision 620 nm) relative to the donor fluorescence. Relative fluorescent units (RFU) indicate the concentration of lysosomal constituents within the phagosome at any given point in time. Error bars denote SEM. No statistically significant differences were found between samples using Student's t-test. The data are representative of six independent experiments. (A) Representative real-time trace. (B) Average rate of the FRET efficiency acquisition over six independent experiments. Rates were determined by calculation of the slope of the linear portion of the real-time traces (as described by y = mx+c, where y is relative fluorescence, m is the slope and x is time).
Fig. 7.
Fig. 7.
CLIC1−/− macrophages display a reduced proteolysis. BSA (100 µg) was incubated with isolated microsomes (20 µl) from BV2 cells for 30 min at 37°C in a buffer with pH calibrated to either 4, 4.2, 4.4 or 4.6, respectively. The BSA degradation pattern was demonstrated by SDS-PAGE and Coomassie Blue staining of the whole gel (A). Phagosomal proteolysis of BSA was monitored in real time by live cell imaging of individual phagosomes from peritoneal macrophages that had undergone synchronised phagocytosis of 3 µm silica beads covalently coupled with DQ-bodipy BSA and Alexa Fluor-594 on an inverted Zeiss Axiovert 200 M microscope. Fluorescence signals were acquired from both the DQ-bodipy BSA (excitation 490 nm, emission 525 nm) and Alexa Fluor 594 (excitation 570 nm, emission 620 nm) and used for ratiometric calculation of proteolysis, which appears as an increase in fluorescence (B). The total BSA proteolysis measured as the area under the curve is significantly lower in CLIC1−/− macrophages than that of CLIC1+/+ (C).
Fig. 8.
Fig. 8.
Reactive oxygen species production. ROS production from peritoneal macrophages from five pairs of CLIC1+/+ and CLIC1−/− mice initiated by phagocytosis of serum-opsonised zymosan particles, measured by horse radish peroxidase enhanced luminol chemiluminescence, was monitored in real time on a FLUOstar OPTIMA microplate reader. At the conclusion of the experiment, cell number determination was performed on each well of the 96 well plate to normalise the chemiluminescence signal (A). The total ROS production measured as the area under the curve is significantly lower in CLIC1−/− macrophages than that of CLIC1+/+ (B). The chloride channel blocker IAA94 eliminated any significant difference in ROS production between CLIC1+/+ and CLIC1−/− macrophages treated as in A. The NADPH oxidase inhibitor DPI, abolished the ROS production from CLIC1+/+ and CLIC1−/− macrophages (B).
Fig. 9.
Fig. 9.
CLIC1−/− mice are protected from K/BxN serum transfer arthritis. CLIC1−/− and sex matched CLIC1+/+ mice aged 8-12 weeks, were injected intraperitoneally with a single dose of 300 µl K/BxN serum. The development of arthritis was assessed using a swelling index generated from the thickness of footpads and ankles measured over 28 days using a calliper before the injection (baseline) and then once every other day. The swelling index is calculated as: (thickness/baseline)×100.

References

    1. Barriere H., Bagdany M., Bossard F., Okiyoneda T., Wojewodka G., Gruenert D., Radzioch D., Lukacs G. L. (2009). Revisiting the role of cystic fibrosis transmembrane conductance regulator and counterion permeability in the pH regulation of endocytic organelles. Mol. Biol. Cell 20, 3125–3141 10.1091/mbc.E09-01-0061 - DOI - PMC - PubMed
    1. Berry K. L., Bülow H. E., Hall D. H., Hobert O. A. (2003). A C. elegans CLIC-like protein required for intracellular tube formation and maintenance. Science 302, 2134–2137 10.1126/science.1087667 - DOI - PubMed
    1. Bradford E. M., Miller M. L., Prasad V., Nieman M. L., Gawenis L. R., Berryman M., Lorenz J. N., Tso P., Shull G. E. (2010) CLIC5 mutant mice are resistant to diet-induced obesity and exhibit gastric hemorrhaging and increased susceptibility to torpor. Am. J. Physiol. 298, R1531–1542 10.1152/ajpregu.00849.2009 - DOI - PMC - PubMed
    1. Chalothorn D., Zhang H., Smith J. E., Edwards J. C., Faber J. E. (2009). Chloride intracellular channel-4 is a determinant of native collateral formation in skeletal muscle and brain. Circ. Res. 105, 89–98 10.1161/CIRCRESAHA.109.197145 - DOI - PMC - PubMed
    1. Cox B., Emili A. (2006). Tissue subcellular fractionation and protein extraction for use in mass-spectrometry-based proteomics. Nat. Protoc. 1, 1872–1878 10.1038/nprot.2006.273 - DOI - PubMed

Publication types

MeSH terms