

doi: 10.1074/mcp.R112.019695.
Epub 2012 Sep 6.
File formats commonly used in mass spectrometry proteomics
Affiliations
- PMID: 22956731
- PMCID: PMC3518119
- DOI: 10.1074/mcp.R112.019695
Item in Clipboard
File formats commonly used in mass spectrometry proteomics
Mol Cell Proteomics.
2012 Dec.
Abstract
The application of mass spectrometry (MS) to the analysis of proteomes has enabled the high-throughput identification and abundance measurement of hundreds to thousands of proteins per experiment. However, the formidable informatics challenge associated with analyzing MS data has required a wide variety of data file formats to encode the complex data types associated with MS workflows. These formats encompass the encoding of input instruction for instruments, output products of the instruments, and several levels of information and results used by and produced by the informatics analysis tools. A brief overview of the most common file formats in use today is presented here, along with a discussion of related topics.
Figures
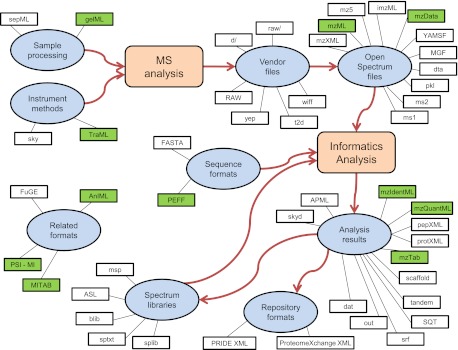
Overview graph of the mass spectrometry proteomics formats discussed here. The overall workflow of MS proteomics is depicted by the large shapes and the arrows connecting them. Ovals represent the major data types within the workflow. The small rectangles represent the individual file formats associated by an edge to their general data type. Shaded formats are officially approved or soon-to-be-approved standards. Different formats associated with the same data type are not necessarily redundant or equivalent.
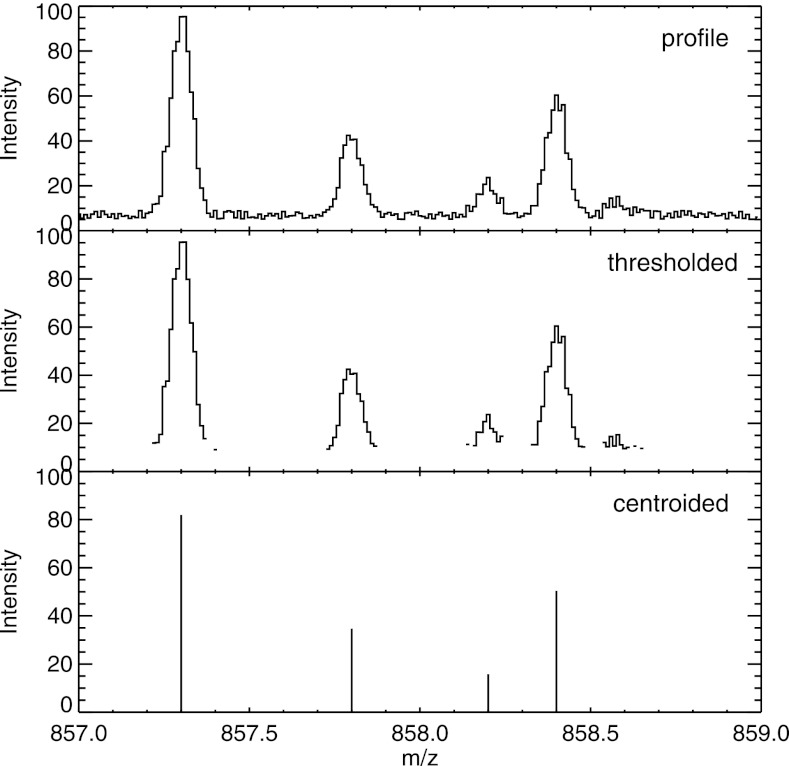
Example of a set of peaks depicted in “profile” mode as it is collected and commonly written by an instrument; “thresholded” mode, in which values below a certain threshold (or sometimes just zeros) are not written out to save space; and “centroided” mode, wherein only the detected peaks are written. Formats such as mzML can encode any one of these types per spectrum.
References
-
- Beck M., Claassen M., Aebersold R. (2011) Comprehensive proteomics. Curr. Opin. Biotechnol. 22, 3–8 - PubMed
-
- McCormack A. L., Schieltz D. M., Goode B., Yang S., Barnes G., Drubin D., Yates J. R., 3rd (1997) Direct analysis and identification of proteins in mixtures by LC/MS/MS and database searching at the low-femtomole level. Anal. Chem. 69, 767–776 - PubMed
-
- Deutsch E. W., Lam H., Aebersold R. (2008) Data analysis and bioinformatics tools for tandem mass spectrometry in proteomics. Physiol. Genomics 33, 18–25 - PubMed
-
- Nature Methods (2008) Thou shalt share your data. Nat. Methods 5, 209
-
- Orchard S., Montechi-Palazzi L., Deutsch E. W., Binz P. A., Jones A. R., Paton N., Pizarro A., Creasy D. M., Wojcik J., Hermjakob H. (2007) Five years of progress in the Standardization of Proteomics Data 4(th) Annual Spring Workshop of the HUPO-Proteomics Standards Initiative, April 23–25, 2007, Ecole Nationale Superieure (ENS), Lyon, France. Proteomics 7, 3436–3440 - PubMed
Publication types
MeSH terms
Substances
Grants and funding
LinkOut - more resources
Full Text Sources
Other Literature Sources
