. 2012 Nov;23(21):4175-87.
doi: 10.1091/mbc.E12-05-0411. Epub 2012 Sep 5.

A zebrafish model of PMM2-CDG reveals altered neurogenesis and a substrate-accumulation mechanism for N-linked glycosylation deficiency

Affiliations

A zebrafish model of PMM2-CDG reveals altered neurogenesis and a substrate-accumulation mechanism for N-linked glycosylation deficiency

Abigail Cline et al. Mol Biol Cell. 2012 Nov.

Abstract

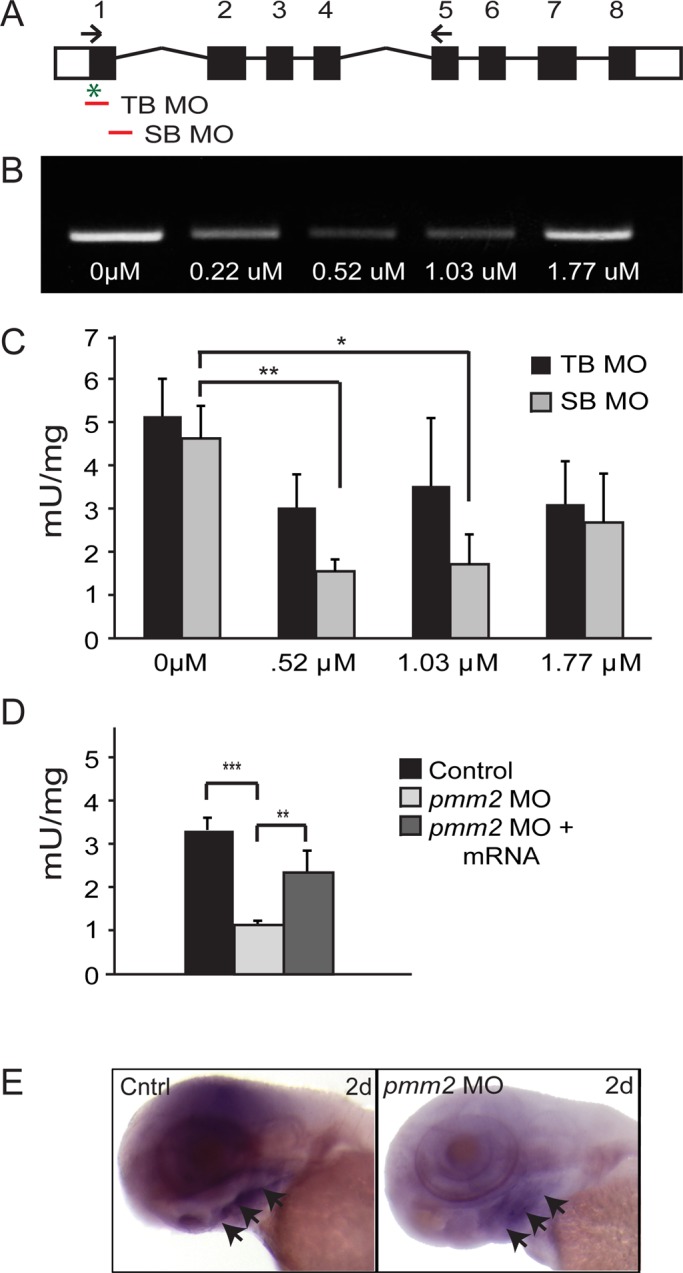
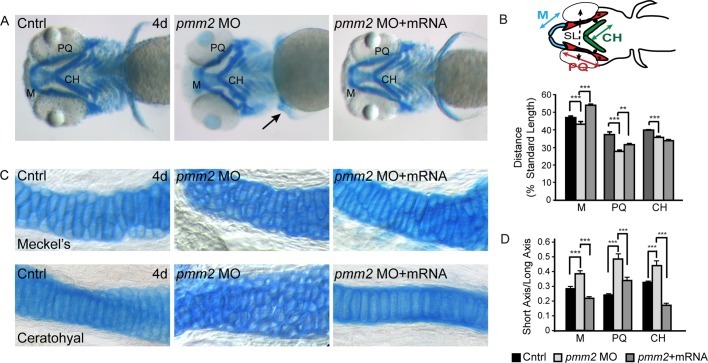
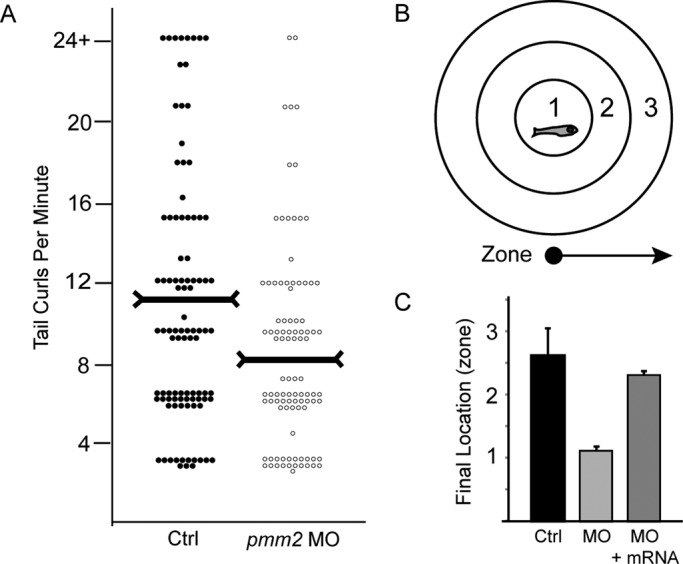
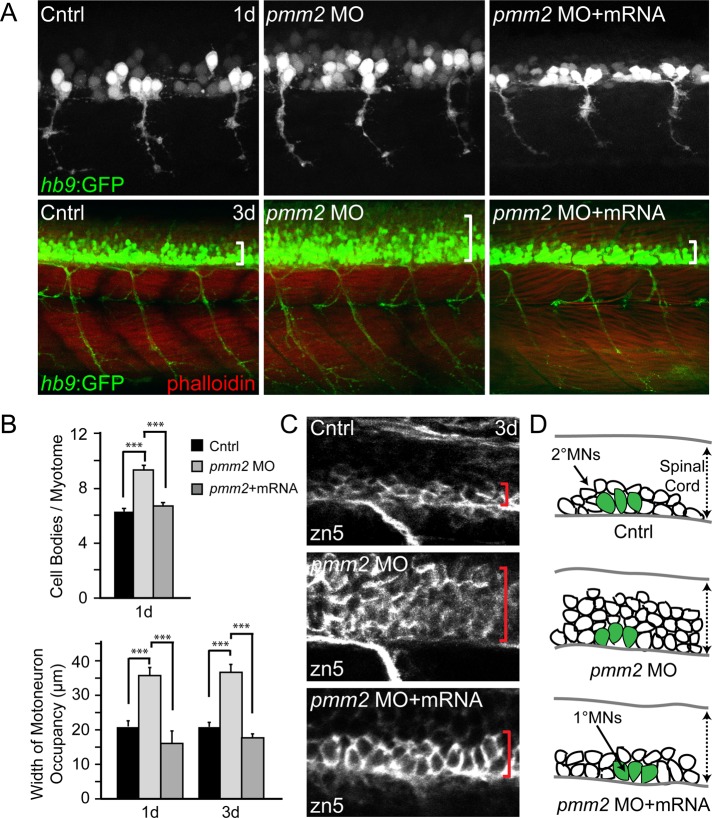
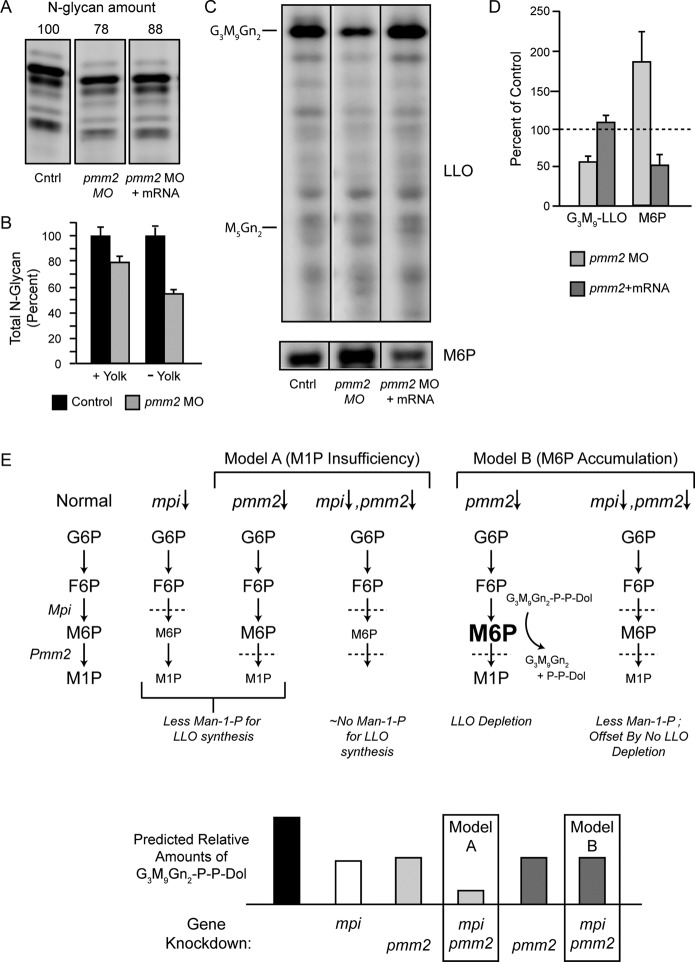
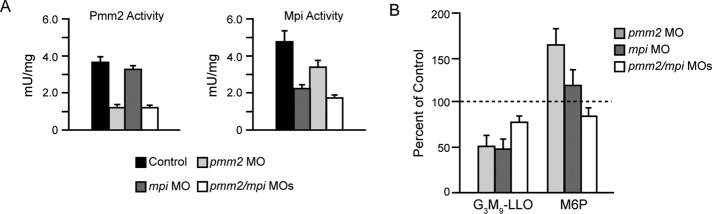
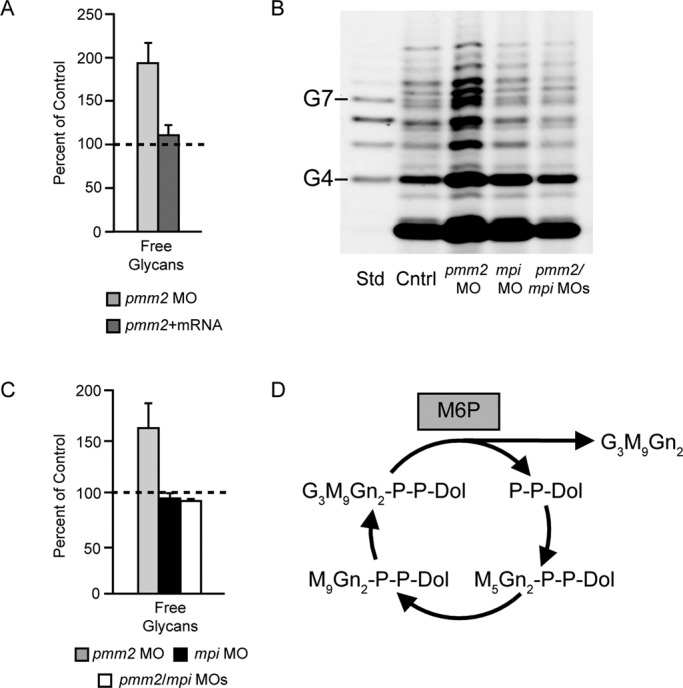
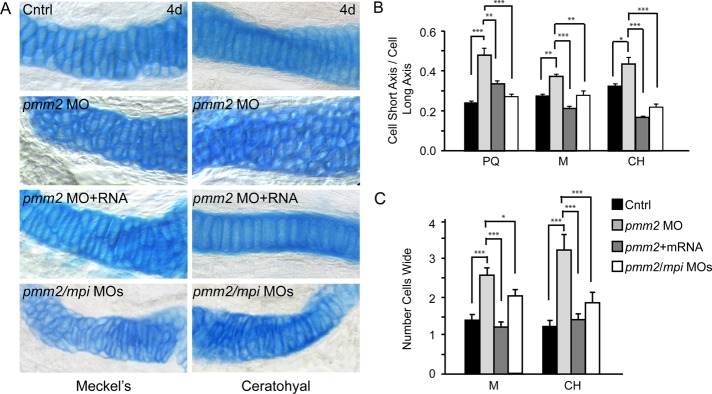
Congenital disorder of glycosylation (PMM2-CDG) results from mutations in pmm2, which encodes the phosphomannomutase (Pmm) that converts mannose-6-phosphate (M6P) to mannose-1-phosphate (M1P). Patients have wide-spectrum clinical abnormalities associated with impaired protein N-glycosylation. Although it has been widely proposed that Pmm2 deficiency depletes M1P, a precursor of GDP-mannose, and consequently suppresses lipid-linked oligosaccharide (LLO) levels needed for N-glycosylation, these deficiencies have not been demonstrated in patients or any animal model. Here we report a morpholino-based PMM2-CDG model in zebrafish. Morphant embryos had developmental abnormalities consistent with PMM2-CDG patients, including craniofacial defects and impaired motility associated with altered motor neurogenesis within the spinal cord. Significantly, global N-linked glycosylation and LLO levels were reduced in pmm2 morphants. Although M1P and GDP-mannose were below reliable detection/quantification limits, Pmm2 depletion unexpectedly caused accumulation of M6P, shown earlier to promote LLO cleavage in vitro. In pmm2 morphants, the free glycan by-products of LLO cleavage increased nearly twofold. Suppression of the M6P-synthesizing enzyme mannose phosphate isomerase within the pmm2 background normalized M6P levels and certain aspects of the craniofacial phenotype and abrogated pmm2-dependent LLO cleavage. In summary, we report the first zebrafish model of PMM2-CDG and uncover novel cellular insights not possible with other systems, including an M6P accumulation mechanism for underglycosylation.


Figures

FIGURE 1:
FIGURE 1:
Injection of pmm2 directed antisense morpholinos into zebrafish embryos reduces pmm2 transcript abundance and activity. (A) Schematic representation of pmm2 gene. The positions of TB and SB MOs are indicated, as is the transcriptional start site (*). Arrows indicate the position of one set of primers used to assess transcript abundance (see Materials and Methods). (B) RT-PCR of 3-dpf embryos after injection of indicated concentrations of SB MO. (C) Pmm2 activity measurements of 3-dpf embryos after injection of either the TB or SB MO. n = 4 experiments. Throughout this article, *p < 0.05 and **p < 0.01 (Student's t test). (D) Measurement of Pmm2 and Mpi activity in 3-dpf control embryos, embryos injected with 0.52 μM SB, and mRNA-rescued morphants. n = 25 experiments. (E) In situ analysis of pmm2 expression in control and pmm2 morphant (MO) embryos. Arrowheads indicate ventral concentration of staining.
FIGURE 2:
FIGURE 2:
pmm2 morphants have dysmorphic craniofacial cartilage. (A) Alcian blue stains of 4-dpf control and pmm2 morphant embryos revealed altered size and shape of Meckel's cartilage, as well as the palatoquadrate and ceratohyal cartilages. These defects were rescued by coinjection of pmm2 mRNA. n = 30–50 embryos per condition over three experiments. Arrow shows kinked pectoral fins in the pmm2 morphants. (B) The length of individual structures was measured and normalized to a standard length (SL), which was set as the distance between the eyes. Individual cartilage measurements are outlined in the fish schematic. n = 30–50 embryos per condition over three experiments. Here and throughout this article, ***p < 0.001. (C) The 4-dpf WT, pmm2 morphant (MO), and pmm2 mRNA–rescued embryos were dissected and the cartilages mounted flat. Analysis of these preparations showed that morphant chondrocytes were rounder and more underintercalated compared with WT chondrocytes. This was rescued by coinjection of pmm2 mRNA. n = 12–15 embryos per condition in three experiments. (D) Chondrocyte shape was measured in each of the affected structures by determining the ratio of cell short axis to long axis. The closer this number is to 1, the rounder is the cell. n = 12–15 embryos per condition in three experiments.
FIGURE 3:
FIGURE 3:
pmm2 morphants exhibit pronounced motility defects. (A) At 1 dpf the times that control and pmm2 morphant (MO) embryos spontaneously curled their tails in 1 min were counted and plotted. Each dot on the scatter plot represents one animal. Two hundred twenty-five embryos per condition were scored over five separate experiments. Horizontal markers indicate the median values. (B) At 3 dpf the swimming behaviors and “escape” responses of control, morphant, and pmm2 mRNA–rescued embryos were assessed by placing individual animals in the center of a Petri dish marked with three concentric rings. Embryos were lightly touched on the head and their behavior and final destination (zone 1, 2, or 3) recorded. (C) For each condition the average “final location” of 100 embryos from three experiments is graphed.
FIGURE 4:
FIGURE 4:
pmm2 morphant spinal cords contain increased numbers of secondary motoneurons. (A) Confocal images of control and pmm2 morphant (MO) embryos generated in the hb9:GFP background reveal increased numbers of motoneurons at 1 dpf (top) and 3 dpf (bottom) of development. Phalloidin staining of muscle fibers showed no differences in myotomal architecture between control and morphant embryos. White brackets indicate representative distances between the ventral spinal cord and the upper end of motoneuron occupancy. n = ∼30 embryos per condition. (B) Quantitation of the number of GFP-positive cell bodies per myotome at 1 dpf and width of motoneuron occupancy within both 1- and 3-dpf embryonic spinal cords demonstrated significant differences between control and pmm2 morphant (MO) embryos that were rescued by coinjection of pmm2 mRNA. n = ∼30 embryos per condition. (C) Whole-mount immunohistochemical stains of 3 dpf embryos using the secondary motoneuron marker zn5 show that the majority of neuronal increase occurs in the secondary motoneuron lineage of pmm2 morphant (MO) embryos. This increase is rescued by coinjection with pmm2 mRNA. Red brackets delineate the ventral edge of the spinal cord on upper limit of motoneuron occupancy. n = 22 embryos. (D) Schematic representation of increased numbers of motoneurons, which appears to primarily affect the secondary motoneuron (MN) population, represented as white cells, whereas the number of primary motoneurons (MN) is unaltered, represented as large green cells. The dotted arrow shows that the width of the spinal cord (SC) is similar between control (Cntrl), MO, and mRNA-rescued embryos.
FIGURE 5:
FIGURE 5:
G3M9Gn2-P-P-Dol suppression and restoration in pmm2 morphants. G3M9Gn2-P-P-Dol and M6P were measured with the FACE technique from the same samples of zebrafish. Similar numbers of 4-dpf embryos (50–200, depending on need) were used for each comparison. All measurements were normalized to total protein, which did not vary significantly among the different genetically modified groups of fish. (A) Representative FACE gel for total N-glycans released from the proteins of yolk-containing zebrafish embryos. Total N-glycan amounts (normalized to control) are indicated above each lane. (B) Bar graph depicting the average percentage loss of total N-glycans in pmm2 morphants (with and without yolks) in two separate experiments (mean ± SEM), normalized to control embryos. Direct comparison of the control samples showed that yolk-free embryos had 49% of the N-glycan content of whole embryos. Related information is provided in Supplemental Figure S1. (C) Representative FACE images showing LLO glycans (M5Gn2 and G3M9Gn2 standards are indicated) and M6P from a single set of control fish, pmm2 morphants, and morphants rescued by coinjection of pmm2 mRNA. Vertical lines denote electronic removal of irrelevant lanes from the image. The portion below the M5Gn2-LLO standard on FACE gels generally contains mostly non-LLO species, but it is included here because this is where any accumulation of M3Gn2-M4Gn2-LLO is likely to appear. Related information is provided in Supplemental Figure S2. (D) G3M9Gn2-LLO and M6P measured in three independent experiments, mean ± SEM. Control levels were arbitrarily set as 100% (dashed line). (E) Top, schematic comparisons of hypotheses for M1P insufficiency (model A) and M6P accumulation (model B). Bottom, models A and B are indicated by light and dark gray bars, respectively, and contrasting double-morphant outcomes are highlighted with boxes.
FIGURE 6:
FIGURE 6:
Knockdown of mpi in the pmm2 background normalizes M6P levels, with no further loss of G3M9Gn2-LLO. (A) Pmm2 and Mpi enzyme activity for control embryos, pmm2 morphants, mpi morphants, and pmm2/mpi double morphants. (B) G3M9Gn2-P-P-Dol and M6P were measured in control embryos, pmm2 morphants, mpi morphants, and pmm2/mpi double morphants. Results are shown for four independent experiments, mean ± SEM, with control values set as 100%.
FIGURE 7:
FIGURE 7:
Free glycans in pmm2 morphants. Total free glycans were measured with FACE techniques from the same samples of zebrafish presented in Figures 5 and 6. (A) Free glycans were measured in control embryos, pmm2 morphants, and morphants rescued by coinjection of pmm2 mRNA. Results of three independent experiments, mean ± SEM. Control levels were arbitrarily set as 100%. (B) Representative FACE image showing total free glycans from control embryos, pmm2 morphants, mpi morphants, and pmm2/mpi double morphants. Glucose oligomer standards (G4–G7) are shown. As shown previously (Gao et al., 2011), G3M9Gn2 released from the LLO pool by M6P action is glycosidically degraded, resulting in the heterogeneous mixture of free glycans detected. The most abundant glycan detected near the bottom of the gel is likely to be M2Gn2, based on migration. (C) Results for four independent experiments as in B, mean ± SEM, with control set as 100%. (D) Schematic showing that dolichol pyrophosphate can be recycled for multiple rounds of LLO synthesis while free glycans are released by the action of M6P. This explains why the molar increase of free glycans in pmm2 morphants vastly exceeds the measured loss of LLO (see Discussion).
FIGURE 8:
FIGURE 8:
Inhibition of mpi in the pmm2 background improves craniofacial chondrocyte morphology. (A) Alcian blue stains of 4 dpf control, pmm2 morphant, mRNA-rescued, and pmm2/mpi double-morphant embryonic cartilage revealed significant improvement after mpi manipulation. Unlike pmm2 morphant chondrocytes, which were round and unorganized, reducing mpi in pmm2 morphants restored the elongated shape of chondrocytes within the Meckel's, ceratohyal, and palatoquadrate (not shown) cartilages. (B) Quantitative measurement of cell shape demonstrated significant recovery of cell elongation in pmm2 morphants after either introduction of pmm2 mRNA or reduction of mpi expression. Briefly, the long and short axes of individual chondrocytes were measured and their ratio calculated. A ratio of 1 indicates equivalence of these axes and a perfectly round cell. (C) Cellular organization was also partially improved in pmm2 morphants after mpi manipulation. This is quantitatively demonstrated in the number of cells spanning the width of the Meckel's and ceratohyal elements.

References

    1. Bill BR, Petzold AM, Clark KJ, Schimmenti LA, Ekker SC. A primer for morpholino use in zebrafish. Zebrafish. 2009;6:69–77. - PMC - PubMed
    1. Chu J, Mir A, Gao N, Rosa S, Monson C, Sharma V, Steet R, Freeze HH, Lehrman MA, Sadler KC. A zebrafish model of congenital disorders of glycosylation with phosphomannose isomerase deficiency reveals an early opportunity for corrective mannose supplementation. Dis Model Mech. 2012 DOI: 10.1242/dmm.010116. - PMC - PubMed
    1. Clément A, Wiweger M, von der Hardt S, Rusch MA, Selleck SB, Chien CB, Roehl HH. Regulation of zebrafish skeletogenesis by ext2/dackel and papst1/pinscher. PLoS Genet. 2008;4:e1000136. - PMC - PubMed
    1. Coman D, Irving M, Kannu P, Jaeken J, Savarirayan R. The skeletal manifestations of the congenital disorders of glycosylation. Clin Genet. 2008;73:507–515. - PubMed
    1. de Lonlay P, et al. A broad spectrum of clinical presentations in congenital disorders of glycosylation I: a series of 26 cases. J Med Genet. 2001;38:14–19. - PMC - PubMed

Publication types

MeSH terms