. 2012 Sep 5;32(36):12337-48.
doi: 10.1523/JNEUROSCI.2129-12.2012.

Cholinergic coordination of presynaptic and postsynaptic activity induces timing-dependent hippocampal synaptic plasticity

Affiliations

Cholinergic coordination of presynaptic and postsynaptic activity induces timing-dependent hippocampal synaptic plasticity

Zhenglin Gu et al. J Neurosci. .

Abstract

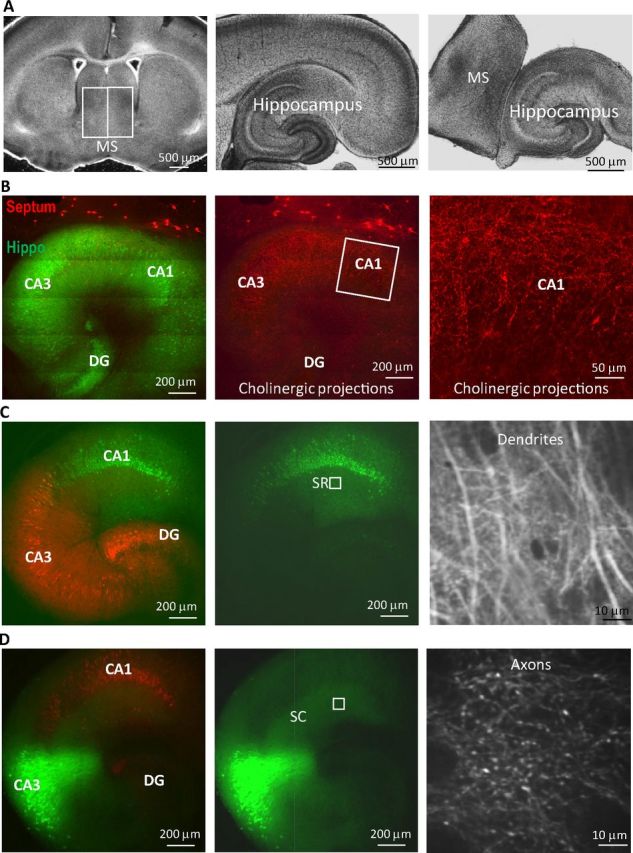
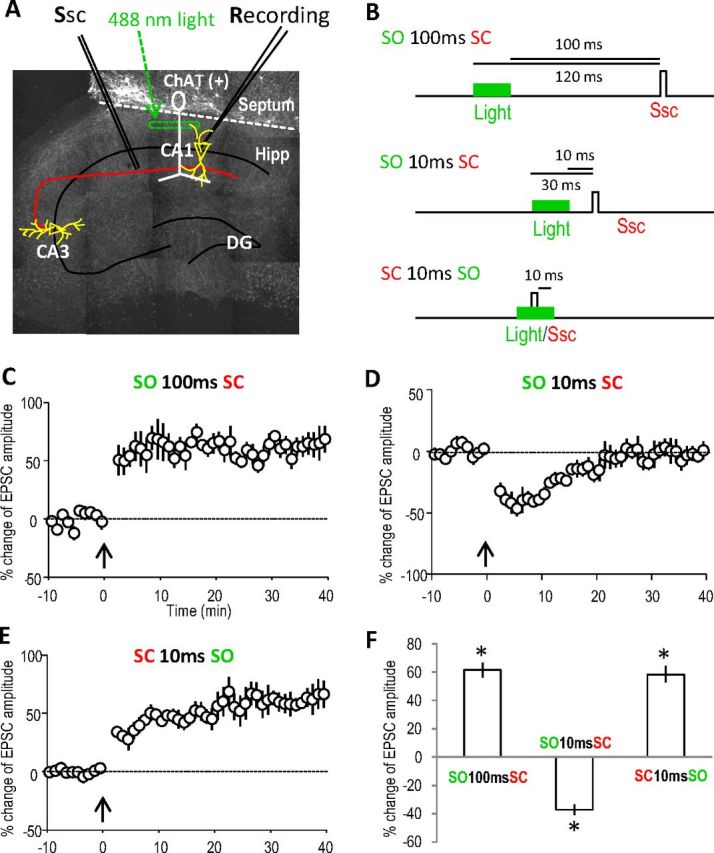
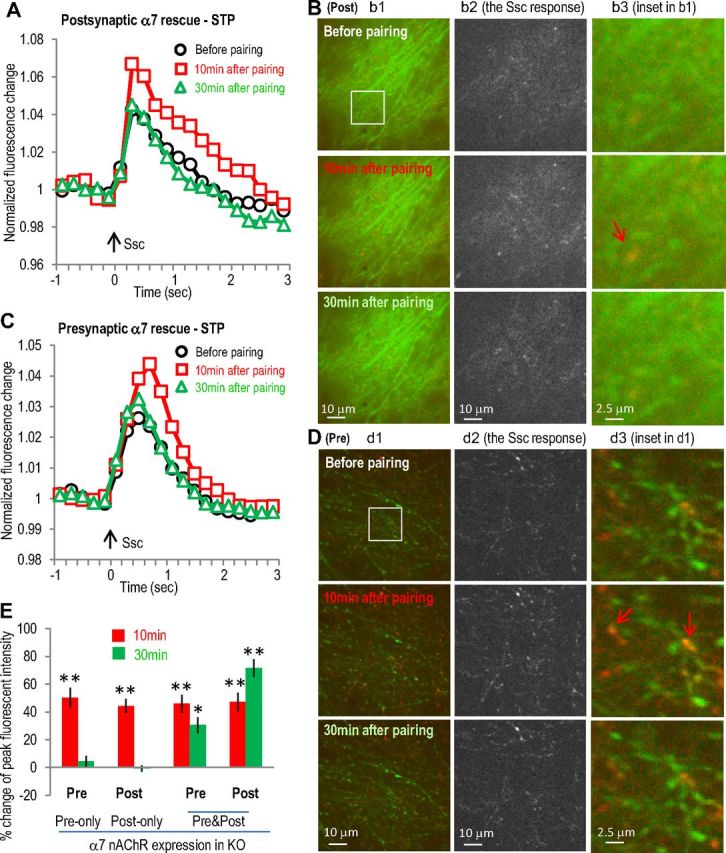
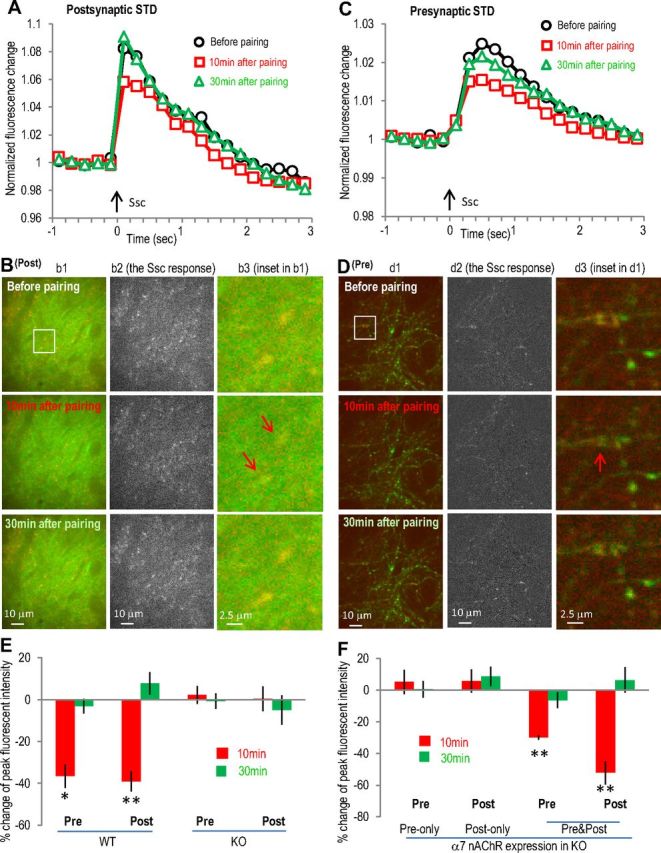
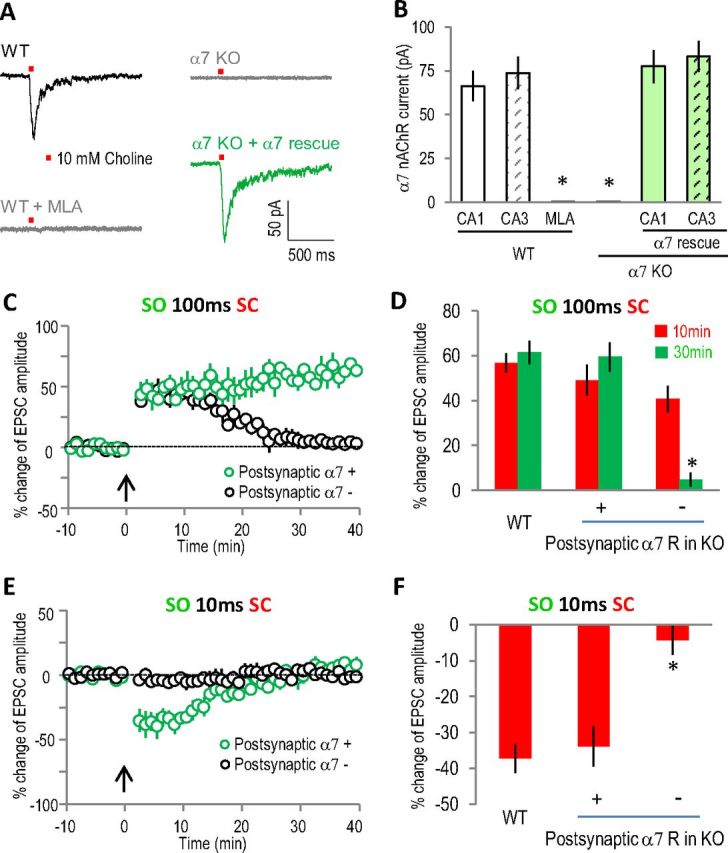
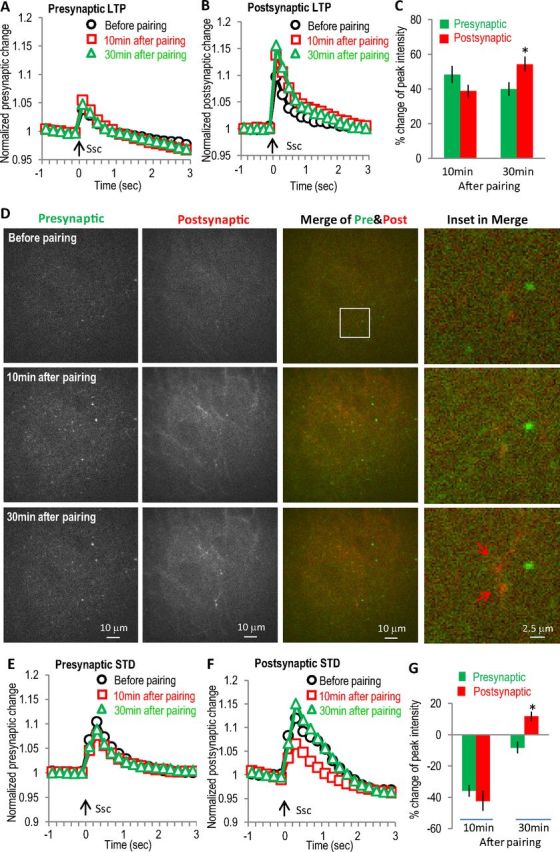
Correlated presynaptic and postsynaptic activity is the key factor in inducing Hebbian plasticity and memory. However, little is known about the physiological events that could mediate such coordination. Correlated cholinergic input induces spike timing-dependent plasticity-like hippocampal synaptic plasticity. Cholinergic receptors are localized to both presynaptic and postsynaptic glutamatergic sites and thus have the potential to coordinate presynaptic and postsynaptic activity to induce plasticity. By directly monitoring presynaptic and postsynaptic activities with genetically encoded calcium indicators in mouse septohippocampal cocultures, we found interactive but independent presynaptic and postsynaptic modulations in the cholinergic-dependent synaptic plasticity. Neither presynaptic nor postsynaptic modulation alone is sufficient, but instead a coordinated modulation at both sites is required to induce the plasticity. Therefore, we propose that correlated cholinergic input can coordinate presynaptic and postsynaptic activities to induce timing-dependent synaptic plasticity, providing a novel mechanism by which neuromodulators precisely modulate network activity and plasticity with high efficiency and temporal precision.


Figures

Figure 1.
Figure 1.
Monitoring neuronal synaptic activities with calcium imaging in septohippocampal slice cocultures. A, Septal tissue and hippocampus were dissected out from 300 μm brain slices and placed next to each other for culture. B, Abundant cholinergic innervation (red) into the hippocampus (Hippo) (green) 7 days after coculturing. C, Genetically encoded calcium indicator GCaMP3 (green, in synapsin promoter-driven AAV) was expressed in hippocampal CA1 neurons, and the dendritic spines were monitored in CA1 SR layer (box in the middle panel) as postsynaptic activities (right panel). D, GCaMP3 was expressed in CA3 neurons, but the projecting axons were monitored in CA1 SR area as presynaptic activities (right panel). The remaining areas of the hippocampus were shown with another red fluorescent protein also driven by synapsin promoter. MS, Medial septum; DG, dentate gyrus.
Figure 2.
Figure 2.
Optogenetically activated cholinergic inputs induce similar timing-dependent hippocampal plasticity in septohippocampal cocultures as in acute hippocampal slices. A, Cholinergic projections (infected with ChR2) in a small region in the hippocampal SO were exposed to 488 nm light (20 ms) for timed activation. B, Three different intervals for pairing cholinergic (SO) and SC pathways were used to induce plasticity, as used in acute hippocampal slices previously. C, LTP was induced by optically activating the cholinergic input 100 ms before stimulating the SC. The pairing protocol was introduced at the time point of 0 min as indicated by the arrow. D, STD was induced by activating the cholinergic input 10 ms before the SC. E, LTP was induced by pairing the SC 10 ms before optically activating the cholinergic input. F, Bar graph showing the amplitude changes of the three types of synaptic plasticity, analyzed at 30 min for LTP and 10 min for STD. *p < 0.001, as compared with before pairing, Student's t test, n = 5 in each group. Ssc, Stimulation of the SC; Hipp, hippocampus; DG, dentate gyrus.
Figure 3.
Figure 3.
The α7 nAChR-mediated LTP involves prolonged calcium activity enhancement in both presynaptic and postsynaptic sites in septohippocampal slice cocultures. LTP was induced by pairing SO pathway 100 ms before SC pathway in septohippocampal slice cocultures. A, Normalized SC pathway stimulation-induced postsynaptic GCaMP3 responses showing the prolonged enhancement of postsynaptic calcium activities after the SO pathway pairing protocol. SC pathway was stimulated at the time point of 0 s as indicated by the arrow. B, Images of SC pathway-induced postsynaptic calcium imaging from different time points before or after pairing protocol. C, Normalized presynaptic GCaMP3 responses showing the prolonged enhancement after the SO pathway pairing protocol. D, Images of presynaptic calcium imaging from different time points before or after pairing protocol. E, Bar graph showing the prolonged postsynaptic (Post) and presynaptic (Pre) responses during LTP; both were abolished in α7 nAChR knock-out slices. *p < 0.01, **p < 0.001, as compared with before pairing, Student's t test, n = 6 in each group. Ssc, Stimulation of the SC; WT, wild type.
Figure 4.
Figure 4.
Expression of α7 nAChR in postsynaptic or presynaptic sites in α7 nAChR KO slice only induced transient activity enhancement in postsynaptic or presynaptic sites, respectively. A, α7 nAChR was coexpressed with GCaMP3 in hippocampal CA1 area of α7 nAChR knock-out mice (where the α7 nAChR-dependent LTP was abolished) as postsynaptic rescue of α7 nAChR. Normalized postsynaptic GCaMP3 responses show transient enhancement after the SO pathway pairing protocol. B, Images of postsynaptic calcium imaging from different time points before or after pairing protocol, with left panels showing the original images, middle panel showing the active calcium responses to SC stimulation, and right panels showing some potential dendritic spines. The potentiation was present in most of the dendrites responsive to SC stimulation (middle panels). C, α7 nAChR was coexpressed with GCaMP3 in hippocampal CA3 area as presynaptic rescue. Normalized presynaptic GCaMP3 responses show transient enhancement of presynaptic calcium activities after the SO pathway pairing protocol. D, Images of presynaptic calcium imaging from different time points before or after pairing protocol, with individual panels similar as described in B. E, Bar graph showing the requirement of both presynaptic and postsynaptic presence of α7 nAChRs to induce LTP. Red signals (in B and D) show the SC stimulation-induced calcium increases (also shown separately in the middle panels) over the basal signals before stimulation (green). Arrows indicate some synaptic sites with significant transient calcium increase. *p < 0.01, **p < 0.001, as compared with before pairing, Student's t test, n = 5 in each group. Ssc, Stimulation of the SC.
Figure 5.
Figure 5.
The α7 nAChR-mediated STD involves transient calcium activity depression in both postsynaptic and presynaptic sites. The α7 nAChR-dependent STD was induced by pairing SO 10 ms before SC. A, Normalized postsynaptic GCaMP3 responses showing the transient depression of postsynaptic calcium activities after the SO pathway pairing protocol. B, Images of postsynaptic (Post) calcium imaging from different time points before or after pairing protocol, with individual panels similar as described in Figure 4B. C, Normalized presynaptic GCaMP3 responses showing the transient depression after the SO pathway pairing protocol. D, Images of presynaptic (Pre) calcium imaging from different time points before or after pairing protocol. E, F, Bar graphs showing that the presence of α7 nAChRs at both presynaptic and postsynaptic sites was required to induce the STD. Red signals (in B and D) show the SC stimulation-induced calcium increases (also shown separately in the middle panels) over the basal signals before stimulation (green). Arrows indicate some synaptic sites with significant transient calcium decrease. *p < 0.01, **p < 0.001, as compared with before pairing, Student's t test, n = 5 in each group. Ssc, Stimulation of the SC.
Figure 6.
Figure 6.
Postsynaptic functional α7 nAChRs in CA1 pyramidal neuron were required to induce either LTP or STD. A, Typical traces of α7 nAChR currents from whole-cell patch clamp recordings of CA1 pyramidal neurons. The α7 nAChR currents were induced by pressure application (10 psi for 50 ms) of 10 mm choline to the SR area (about 150 μm from the cell body). The α7 nAChR currents were completely blocked by MLA (10 nm) and absent in α7 nAChR knock-out slices. B, Bar graph showing the expression of functional α7 nAChRs in CA1 and CA3 pyramidal neurons in septohippocampal slice cultures and the efficient rescue by virus-introduced α7 nAChRs to the knock-out slices. *p < 0.001 as compared with wild-type, Student's t test, n = 8–12 in each group. C, E, Whole-cell recordings of EPSCs showing normal LTP and STD in α7 nAChR-positive CA1 pyramidal neurons in α7 nAChR knock-out rescue (at both CA1 and CA3 sites) slices, while both forms of plasticity were disrupted in neighboring α7 nAChR-negative CA1 pyramidal neurons. D, F, Bar graphs showing the difference of the plasticity between α7 nAChR-positive and their neighboring α7 nAChR-negative CA1 pyramidal neurons. *p < 0.001, as compared with α7 nAChR-positive CA1 pyramidal neurons, Student's t test, n = 5 in each group. WT, Wild type.
Figure 7.
Figure 7.
Differential presynaptic and postsynaptic changes in α7 nAChR-dependent LTP and STD revealed with dual-color GECI imaging. GECIs (green GCaMP3 and red R-GECO1) were expressed separately in hippocampal CA3 and CA1 to monitor presynaptic and postsynaptic activities simultaneously for LTP (AD) and STD (EG). A, Normalized presynaptic GCaMP3 responses showing smaller enhancement at 30 min than that at 10 min. B, Normalized postsynaptic R-GECO1 responses showing stronger enhancement at 30 min than that at 10 min. C, Bar graph showing the differential changes of the later stage (at 30 min) between presynaptic and postsynaptic activities during the LTP. D, Images of presynaptic and postsynaptic SC stimulation-induced calcium increases at different time points during the LTP. Left two panels show the active presynaptic and postsynaptic calcium responses to SC stimulation, respectively. The third panels are merged images of presynaptic and postsynaptic responses, with the right panels showing some potential spines. E, Normalized presynaptic GCaMP3 responses showing the transient depression after the SO pathway pairing protocol. Arrow indicates stimulation of the SC pathway. F, Normalized postsynaptic R-GECO1 responses showing the transient depression after pairing the SO pathway. G, Bar graph showing the differential recovery between presynaptic and postsynaptic activities during the STD. Ssc, Stimulation of the SC.

Similar articles

Cited by

References

    1. Agulhon C, Petravicz J, McMullen AB, Sweger EJ, Minton SK, Taves SR, Casper KB, Fiacco TA, McCarthy KD. What is the role of astrocyte calcium in neurophysiology? Neuron. 2008;59:932–946. - PMC - PubMed
    1. Araque A, Martín ED, Perea G, Arellano JI, Buño W. Synaptically released acetylcholine evokes Ca2+ elevations in astrocytes in hippocampal slices. J Neurosci. 2002;22:2443–2450. - PMC - PubMed
    1. Bailey CH, Giustetto M, Huang YY, Hawkins RD, Kandel ER. Is heterosynaptic modulation essential for stabilizing Hebbian plasticity and memory? Nat Rev Neurosci. 2000;1:11–20. - PubMed
    1. Bastrikova N, Gardner GA, Reece JM, Jeromin A, Dudek SM. Synapse elimination accompanies functional plasticity in hippocampal neurons. Proc Natl Acad Sci U S A. 2008;105:3123–3127. - PMC - PubMed
    1. Bell CC, Han VZ, Sugawara Y, Grant K. Synaptic plasticity in a cerebellum-like structure depends on temporal order. Nature. 1997;387:278–281. - PubMed

Publication types

LinkOut - more resources