. 2012 Sep 5;32(36):12396-405.
doi: 10.1523/JNEUROSCI.6189-11.2012.

Rapamycin delays disease onset and prevents PrP plaque deposition in a mouse model of Gerstmann-Sträussler-Scheinker disease

Affiliations

Rapamycin delays disease onset and prevents PrP plaque deposition in a mouse model of Gerstmann-Sträussler-Scheinker disease

Constanza J Cortes et al. J Neurosci. .

Abstract

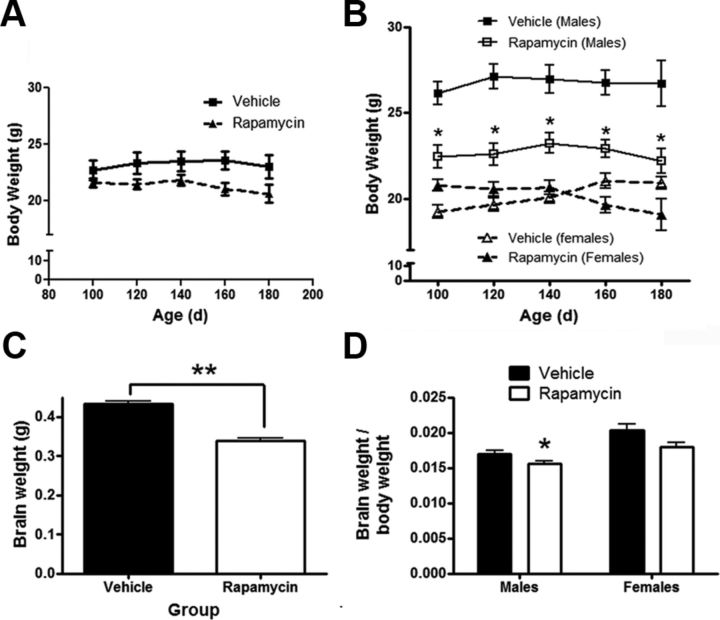
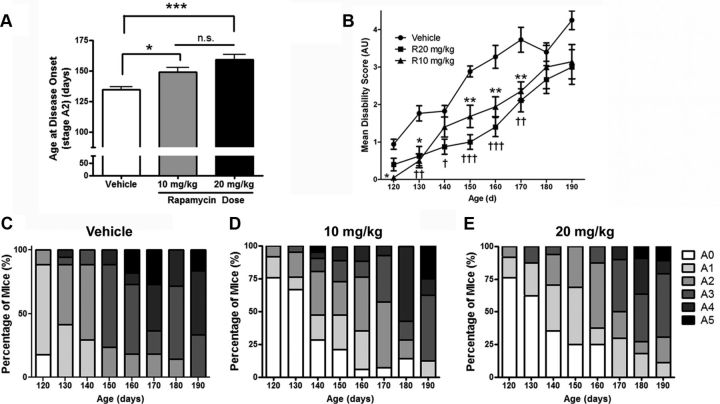
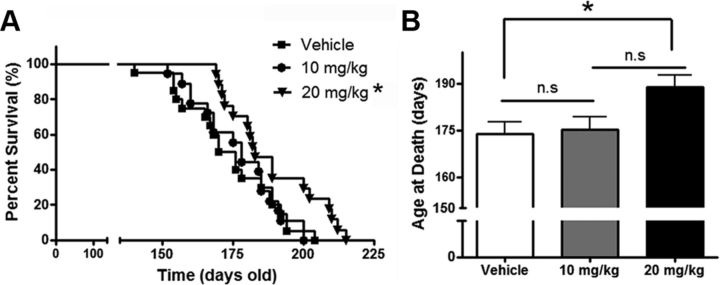
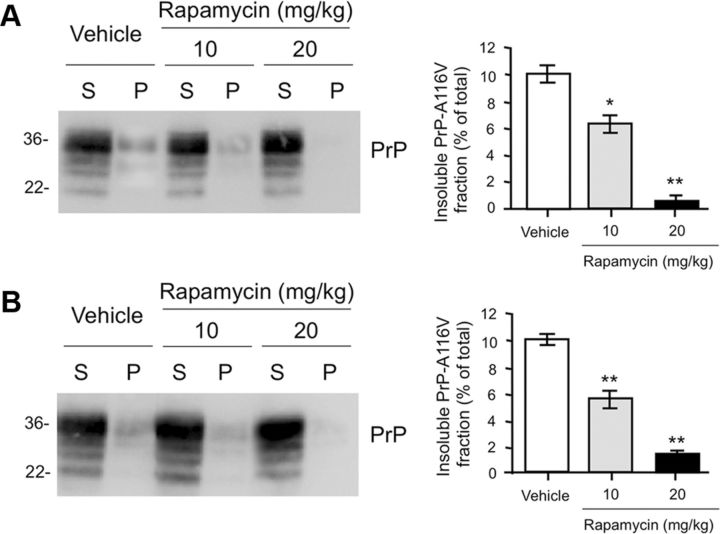
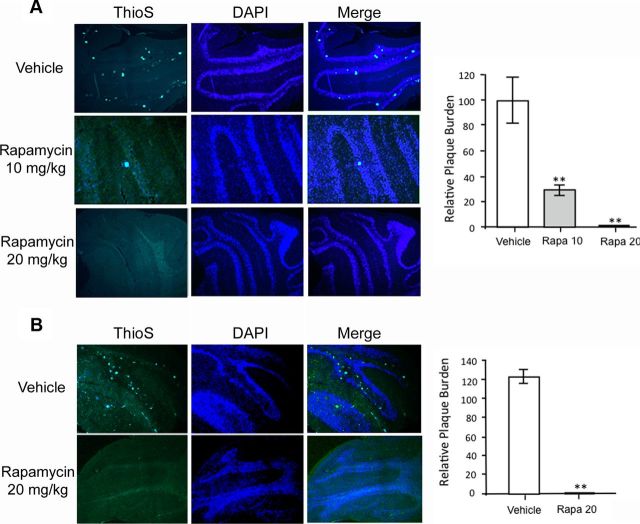
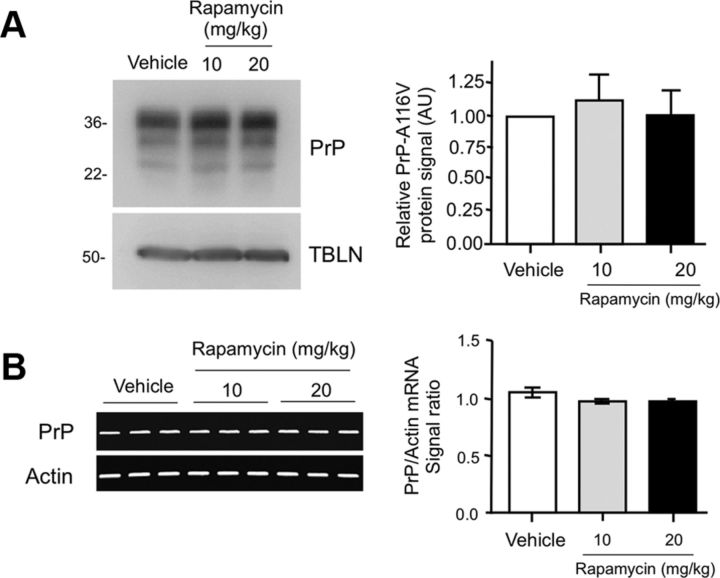
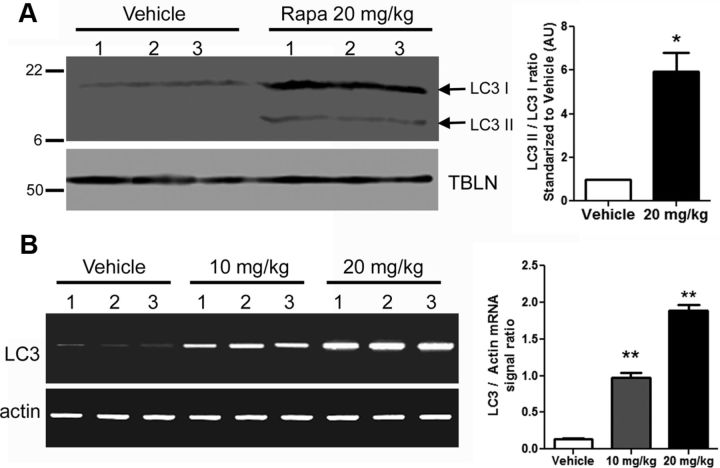
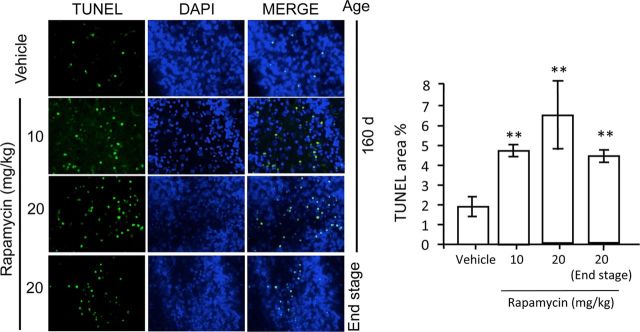
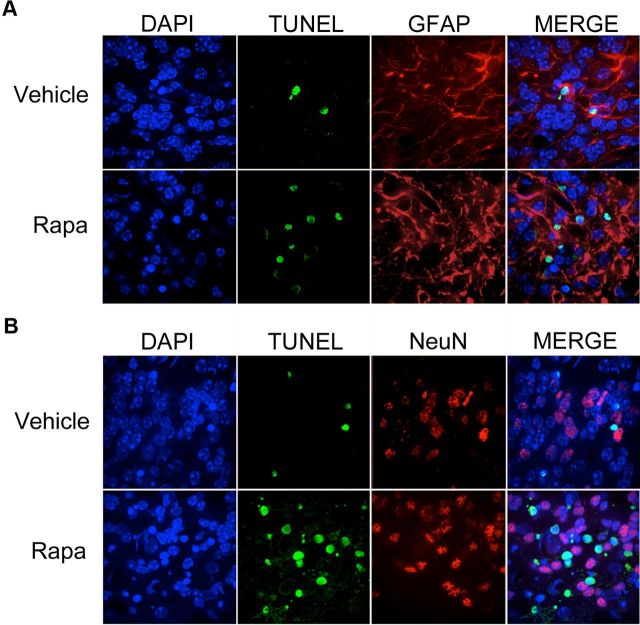
Autophagy is a cell survival response to nutrient deprivation that delivers cellular components to lysosomes for digestion. In recent years, autophagy has also been shown to assist in the degradation of misfolded proteins linked to neurodegenerative disease (Ross and Poirier, 2004). In support of this, rapamycin, an autophagy inducer, improves the phenotype of several animal models of neurodegenerative disease. Our Tg(PrP-A116V) mice model Gerstmann-Sträussler-Scheinker disease (GSS), a genetic prion disease characterized by prominent ataxia and extracellular PrP amyloid plaque deposits in brain (Yang et al., 2009). To determine whether autophagy induction can mitigate the development of GSS, Tg(PrP-A116V) mice were chronically treated with 10 or 20 mg/kg rapamycin intraperitoneally thrice weekly, beginning at 6 weeks of age. We observed a dose-related delay in disease onset, a reduction in symptom severity, and an extension of survival in rapamycin-treated Tg(PrP-A116V) mice. Coincident with this response was an increase in the autophagy-specific marker LC3II, a reduction in insoluble PrP-A116V, and a near-complete absence of PrP amyloid plaques in the brain. An increase in glial cell apoptosis of unclear significance was also detected. These findings suggest autophagy induction enhances elimination of misfolded PrP before its accumulation in plaques. Because ataxia persisted in these mice despite the absence of plaque deposits, our findings also suggest that PrP plaque pathology, a histopathological marker for the diagnosis of GSS, is not essential for the GSS phenotype.


Figures

Figure 1.
Figure 1.
Rapamycin reduces weight gain in male Tg(PrP-A116V) mice. A, Average weight ± SE, in grams, of all mice treated with rapamycin at 20 mg/kg or vehicle from 6 weeks of age, measured between 100 (presymptomatic) and 180 (symptomatic) days of age (n = 12 per group). No significant differences at any time point. B, Data from A, but separated by gender. Males (squares) and females (triangles) treated with rapamycin, compared with vehicle-treated, mice within the same gender group. Rapamycin-treated males weighed significantly less than vehicle-treated males at the start of the weight recordings, suggesting reduced weight gain with the initiation of rapamycin. *p < 0.05, Student's t test, measured at each time point. Data from mice receiving 10 mg/kg rapamycin are not shown, to simplify the figure, but no statistical difference compared with 20 mg/kg was detected. C, Brain weight (in grams) from ∼160-d-old male and female Tg(PrP-A116V) mice treated with vehicle or rapamycin at 20 mg/kg (n = 16 each, 10 males, 6 females). **p < 0.001, Student's t test. D, Ratio of brain to body weight in 160-d-old Tg(PrP-A116V) male and female mice treated with vehicle or rapamycin at 20 mg/kg (n = 6 each). *p = 0.0496, Student's t test.
Figure 2.
Figure 2.
Rapamycin delays disease onset and progression in Tg(PrP-A116V) mice. A, Mean age of disease onset ± SE (A2 stage) of mice chronically treated with vehicle or rapamycin at 10 or 20 mg/kg, beginning at 6 weeks of age. Vehicle, 134 ± 2.6 d (n = 20); rapamycin (10 mg/kg), 149 ± 3.7 d (n = 24); rapamycin (20 mg/kg), 159 ± 4.2 d (n = 23). *p < 0.05; ***p = 0.0001. ANOVA, Bonferroni's post hoc test; n.s., not significantly different. B, Disease (disability) scores of Tg(PrP-A116V) mice plotted over time. Animals were assessed weekly and scored according to an ataxia/disability scale that ranges from A0 (no signs) to A5 (severely ataxic, near terminal), when they were killed. Mean disability scores ± SE are plotted. Numbers of animals per group were initially 17 (vehicle), 25 (rapamycin 10 mg/kg), and 20 for (rapamycin at 20 mg/kg), and by 190 d, remaining mice numbered 4, 8, and 8, respectively. ANOVA was used to compare the three treatment groups at each time point, followed by Bonferroni's post hoc test. Significant differences between vehicle and rapamycin (10 mg/kg) group are indicated by the asterisk (*). Significant differences between vehicle and rapamycin 20 mg/kg are indicated by the dagger symbol (†). One, two, and three symbols represents a p < 0.05, p < 0.01, and p < 0.001 level of significance compared with vehicle-treated group, respectively. Although the mean disability scores for the higher rapamycin dose were lower throughout the observation period, no significant differences (p < 0.05) were detected between rapamycin at 10 mg/kg and rapamycin at 20 mg/kg at any age analyzed. C–E, The bars represent the percentage of mice within each stage of disease at the indicated time point. Note that rapamycin at 10 mg/kg (D) and 20 mg/kg (E) delay the appearance of higher disease scores (darker colors) compared with vehicle-treated mice (C).
Figure 3.
Figure 3.
Rapamycin extends survival of Tg(PrP-A116V) mice. A, Kaplan–Meier survival curve of mice chronically treated with vehicle or rapamycin at 10 or 20 mg/kg three times per week, beginning at 6 weeks of age. Rapamycin at 20 mg/kg, but not 10 mg/kg, significantly increased the survival of Tg(PrP-A116V) mice (*p < 0.05). B, Mean age at death ± SE of Tg(PrP-A116V) treated with vehicle or rapamycin. Actual numbers are 173 ± 3.7 d (n = 20) for vehicle, 175 ± 3.8 d (n = 19) for 10 mg/kg rapamycin, and 189 ± 3.8 d (n = 17) for 20 mg/kg rapamycin (*p < 0.05).
Figure 4.
Figure 4.
Rapamycin reduces the fraction of insoluble PrP-A116V. A, Western blot of supernatant (S) and pellet (P) fractions of PrP-A116V prepared from brain lysates of asymptomatic (stage A0) 80-d-old Tg(PrP-A116V) mice chronically treated with vehicle or 10 or 20 mg/kg rapamycin. Sample preparation is described in Materials and Methods. The markers on left are in kilodaltons. PrP detected with SAF-32 anti-mouse PrP antibody. Densitometric signal of each fraction was semiquantified using TotalLab, and the insoluble fraction is plotted as the percentage of total (S + P) signal. Actual values for each are as follows: vehicle, 10.3 ± 1.2%; rapamycin at 10 mg/kg, 6.5 ± 1.2%; rapamycin at 20 mg/kg, 0.5 ± 0.2%. B, Western blot and bar graph displays the insoluble fraction of PrP-A116V in the brains of symptomatic Tg(PrP-A116V) mice during late-stage (stage A5) disease. Actual values for each are as follows: vehicle, 10.1 ± 0.60%; rapamycin at 10 mg/kg, 5.7 ± 1.16%; rapamycin at 20 mg/kg, 1.4 ± 0.4%. The markers on left are in kilodaltons. *p < 0.05, **p < 0.01, n = 3 for each treatment per time point, Student's t test, from vehicle control. Error bars indicate SEM.
Figure 5.
Figure 5.
Rapamycin reduces PrP plaque burden in Tg(PrP-A116V) mice. A, Representative cerebellar sections from ∼160-d-old Tg(PrP-A116V) mice treated with vehicle or rapamycin (10 or 20 mg/kg). Sections were stained with thioflavin S to reveal PrP amyloid plaques. Nuclei were stained with DAPI. Sections were visualized by fluorescence microscopy on a Zeiss Axioplan microscope. Images are at 10× magnification. The area of thioflavin S staining, as a fraction of the total area of the cerebellar section, was determined using ImageJ and plotted as the relative plaque burden, by normalizing each group to the 160-d-old vehicle-treated group. The actual values are as follows: vehicle, 100.0 ± 36.7; rapamycin at 10 mg/kg, 28.7 ± 9.6; rapamycin at 20 mg/kg, none detected. B, Representative cerebellar sections from Tg(PrP-A116V) mice in the terminal stage of disease (≥A5) following treatment with vehicle or rapamycin at 20 mg/kg and stained with thioflavin S and DAPI, as above (magnification, 10×). The relative plaque burden was determined as in A, using 160-d-old vehicle-treated mice as control. The actual values are 125.3 ± 14.1 for vehicle-treated mice and none detected for rapamycin-treated mice. The bars represent the mean ± SD for each group (n = 6–9 samples per group). **p < 0.01 from vehicle treatment group, Student's t test.
Figure 6.
Figure 6.
Rapamycin does not alter protein or transcript levels of PrP. A, Western blot comparing PrP levels in total brain lysates prepared from ∼160-d-old Tg(PrP-A116V) mice chronically treated with vehicle or rapamycin at 10 or 20 mg/kg. Tubulin (TBLN) represents a loading control. The markers on the left are in kilodaltons. Densitometry quantification ± SD of PrP signal with each dose of rapamycin relative to vehicle was determined using ImageJ software and is plotted in the adjacent graph. No significant difference was detected among the three groups (ANOVA). B, RT-PCR of PrP-A116V and actin (control) transcripts from mice chronically administered vehicle or rapamycin at 10 or 20 mg/kg. The adjacent graph displays the ratio of PrP transcript signal ± SD relative to actin signal for each treatment group (n = 3 mice per experiment). No significant differences were detected by ANOVA.
Figure 7.
Figure 7.
LC3II levels and LC3 transcripts are increased in the CNS of rapamycin-treated Tg(PrP-A116V) mice. A, Representative Western blot prepared from brain lysates of ∼160-d-old mice chronically treated with vehicle or rapamycin (Rapa) at 20 mg/kg, and probed for LC3. Tubulin (TBLN) is a loading control. Each sample represents 30 μg of total protein. The markers on the left are in kilodaltons. The adjacent bar graph displays the ratio of LC3II/LC3I densitometric signal, as determined by ImageJ, relative to that of vehicle-treated mice (n = 3 mice for each treatment). B, RT-PCR of LC3 mRNA from the brains of ∼160-d-old mice chronically treated with vehicle or rapamycin at 10 or 20 mg/kg. RT-PCR of actin mRNA is presented as a reference control. Adjacent bar graph presents the ratio of LC3/actin RT-PCR signal for each treatment (n = 3 for each). *p < 0.05; **p < 0.001. Error bars indicate SEM.
Figure 8.
Figure 8.
Rapamycin induces apoptosis in the CNS of Tg(PrP-A116V) mice. TUNEL (green) and DAPI staining of representative cerebella of 160-d-old and end-stage (A5) Tg(PrP-A116V) mice chronically treated with vehicle or rapamycin at 10 or 20 mg/kg. Cerebellar sections adjacent to those used for assessment of plaque burden in Figure 5 were used to assess apoptosis. Adjacent bar graph displays the ratio of TUNEL-positive area relative to the total neuron load, as estimated by DAPI signal area, using ImageJ software. The bars represent the mean ± SE (n = 6 mice per group). **p < 0.01, significantly different from vehicle, Student's t test. No statistical differences were detected between any rapamycin-treated groups at 160 d compared with end-stage time points, suggesting this feature did not progress with disease.
Figure 9.
Figure 9.
Apoptosis induced by rapamycin is selective for astrocytes. A, B, Cerebellar sections from mice treated with 20 mg/kg rapamycin (Rapa) were costained for TUNEL (green) and either rabbit anti-GFAP antibody (A), to detect astrocytes, or mouse anti-NeuN monoclonal antibody (B), to detect nuclei of neuronal cells. TUNEL-positive nuclei (green) were associated primarily within GFAP-positive cells, although the difference in subcellular localization of the two markers made it difficult to rule out an effect on neuronal cells. NeuN staining (B) of neuronal nuclei confirmed a nearly complete absence of colocalization with TUNEL staining. Of 200 NeuN-positive neurons, only 11 were found to be TUNEL positive. These data suggest the enhanced apoptosis of rapamycin was selective for astrocytes and not neurons.

References

    1. Aguib Y, Heiseke A, Gilch S, Riemer C, Baier M, Schätzl HM, Ertmer A. Autophagy induction by trehalose counteracts cellular prion infection. Autophagy. 2009;5:361–369. - PubMed
    1. Aguzzi A, O'Connor T. Protein aggregation diseases: pathogenicity and therapeutic perspectives. Nat Rev Drug Discov. 2010;9:237–248. - PubMed
    1. Aguzzi A, Heppner FL, Heikenwalder M, Prinz M, Mertz K, Seeger H, Glatzel M. Immune system and peripheral nerves in propagation of prions to CNS. Br Med Bull. 2003;66:141–159. - PubMed
    1. Berger Z, Ravikumar B, Menzies FM, Oroz LG, Underwood BR, Pangalos MN, Schmitt I, Wullner U, Evert BO, O'Kane CJ, Rubinsztein DC. Rapamycin alleviates toxicity of different aggregate-prone proteins. Hum Mol Genet. 2006;15:433–442. - PubMed
    1. Bounhar Y, Zhang Y, Goodyer CG, LeBlanc A. Prion protein protects human neurons against Bax-mediated apoptosis. J Biol Chem. 2001;276:39145–39149. - PubMed

Publication types