Comparative Study
. 2012 Sep 5;32(36):12444-59.
doi: 10.1523/JNEUROSCI.0593-12.2012.

Reward cues in space: commonalities and differences in neural coding by hippocampal and ventral striatal ensembles

Affiliations
Comparative Study

Reward cues in space: commonalities and differences in neural coding by hippocampal and ventral striatal ensembles

Carien S Lansink et al. J Neurosci. .

Abstract

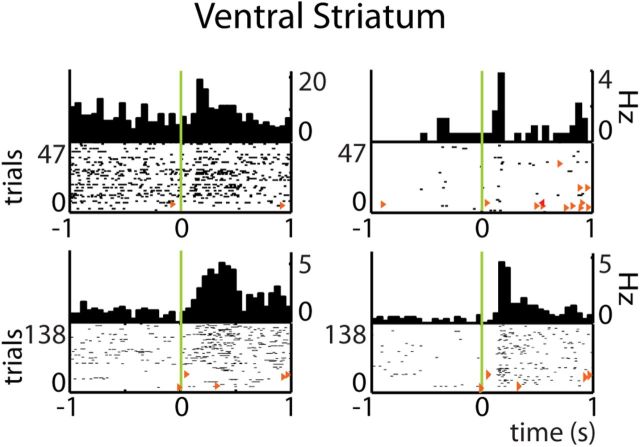
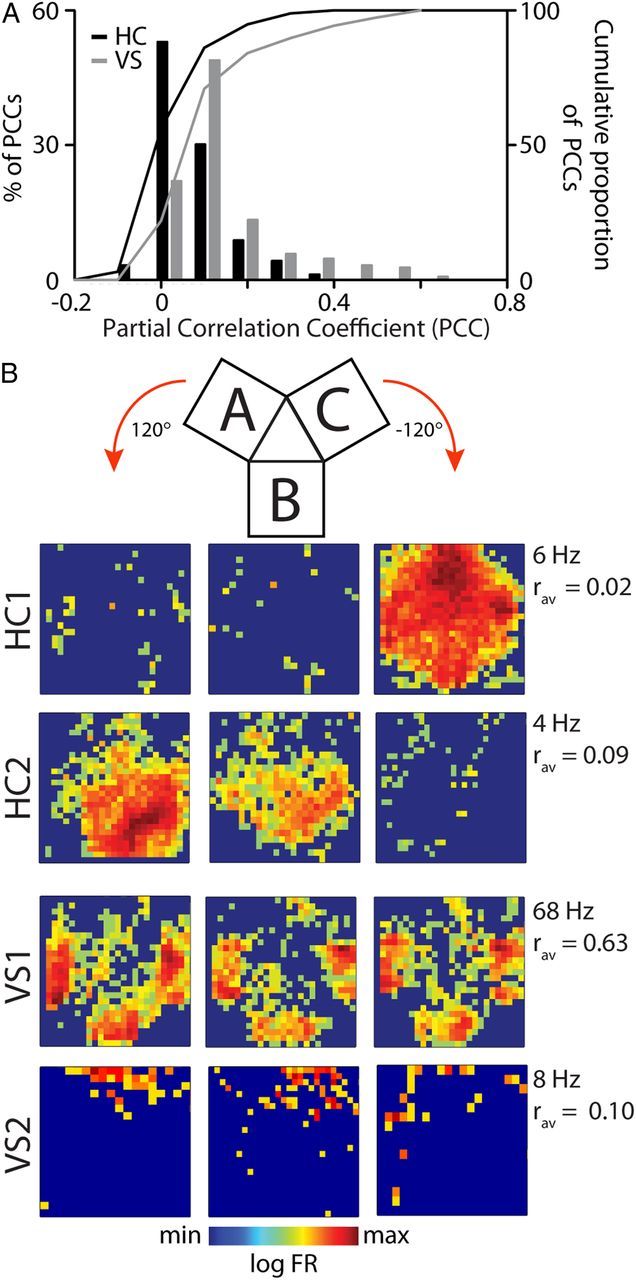
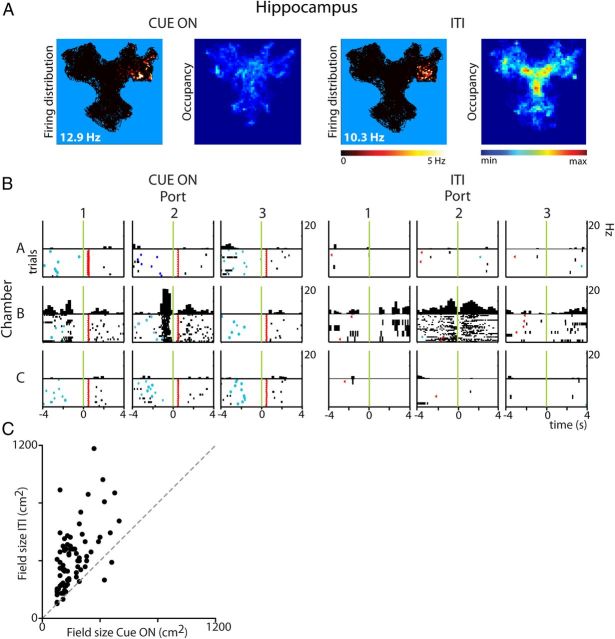
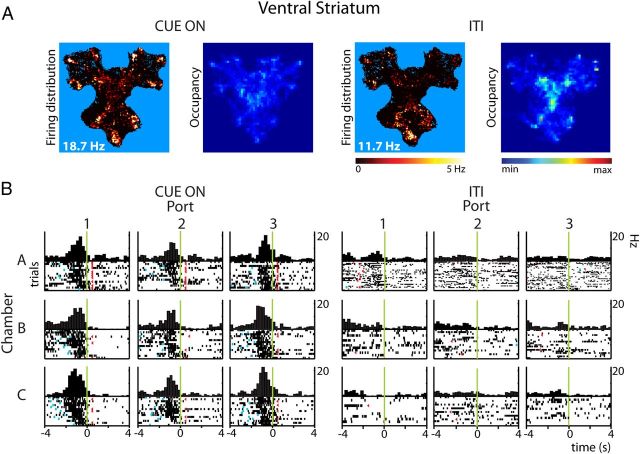
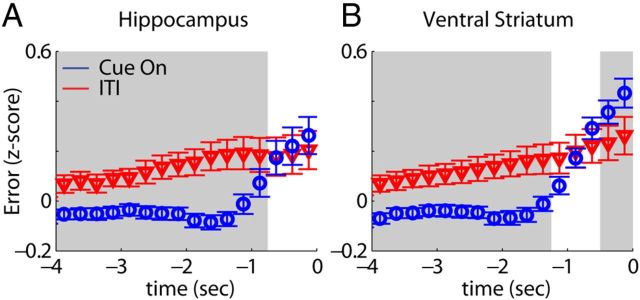
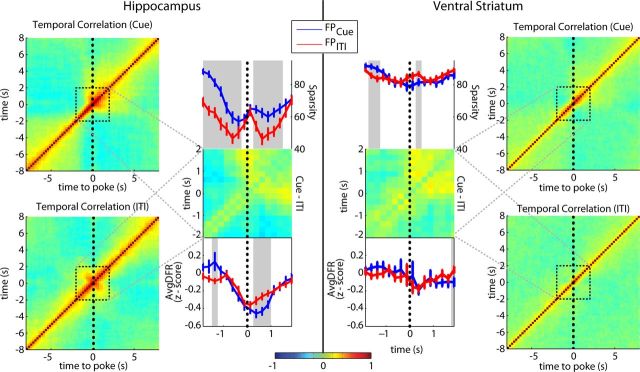
Forming place-reward associations critically depends on the integrity of the hippocampal-ventral striatal system. The ventral striatum (VS) receives a strong hippocampal input conveying spatial-contextual information, but it is unclear how this structure integrates this information to invigorate reward-directed behavior. Neuronal ensembles in rat hippocampus (HC) and VS were simultaneously recorded during a conditioning task in which navigation depended on path integration. In contrast to HC, ventral striatal neurons showed low spatial selectivity, but rather coded behavioral task phases toward reaching goal sites. Outcome-predicting cues induced a remapping of firing patterns in the HC, consistent with its role in episodic memory. VS remapped in conjunction with the HC, indicating that remapping can take place in multiple brain regions engaged in the same task. Subsets of ventral striatal neurons showed a "flip" from high activity when cue lights were illuminated to low activity in intertrial intervals, or vice versa. The cues induced an increase in spatial information transmission and sparsity in both structures. These effects were paralleled by an enhanced temporal specificity of ensemble coding and a more accurate reconstruction of the animal's position from population firing patterns. Altogether, the results reveal strong differences in spatial processing between hippocampal area CA1 and VS, but indicate similarities in how discrete cues impact on this processing.


Figures

Figure 1.
Figure 1.
Histological verification of recording sites in the HC and VS. Tetrode endpoints in the HC (A) and VS (B) are represented by black dots. B, Colored panels in the ventral striatal graphs indicate per rat the estimated area where recordings were taken based on tetrode tracks visible in the brain sections and daily records of downward tetrode advancement. Units were recorded from both the ventral striatal core (∼78%) and shell (∼22%) area. Note that ensembles from individual sessions could contain both core and shell units. Numbers indicate distance from bregma on the anterior–posterior axis in millimeters. Graphs adapted from Paxinos and Watson (1986).
Figure 2.
Figure 2.
Cue and context conditioning in the Y-maze. A, The maze consisted of three identical chambers situated around a triangular platform and each chamber contained three cue lights with a reward well underneath. In the cue-conditioning sessions a nose-poke response into the well associated with a light resulted in reward delivery (middle, magenta well). In context-conditioning sessions, reward probability after a correct response to a cue light depended on the location of the chamber (middle and right; 75 and 25% probability, respectively). B, Average percentage of correct nose pokes to cues across behavioral sessions (n = 7 rats; P = probe session; gray: SEM). C, Mean percentage (±SEM) of nose pokes during ITIs indicates a preference for the highly rewarded chamber during context but not cue-conditioning sessions. Place preference was confirmed in a context-conditioning test (CX). A probe session (P) indicated that the place preference was not aligned to uncontrolled environmental cues (*MWU, p < 0.005). Results for recorded rats (n = 3) were similar to the entire group shown above. Mean percentage of ITI nose pokes in 75% chamber vs 25% chambers: cue sessions: 32.5 ± 1.4 vs 33.7 ± 0.7; context sessions: 55.4 ± 2.1 vs 22.3 ± 1.1; CX test: 37.9 ± 3.6 vs 31.1 ± 1.8; probe test: 56.5 ± 1.4 vs 21.8 ± 0.7%.
Figure 3.
Figure 3.
Hippocampal neurons: spatial firing distributions and firing rate responses associated with reward port approach. A–O, Each blue panel shows the color-coded local instantaneous firing rate of a single neuron (scale, see bottom row), superimposed on the occupancy map of the rat (black). Maximal firing rate within the place field is noted in the lower right corner. P, Q, PETHs and rasters show firing rate responses of two cells aligned to nose pokes (t = 0; green line) into each of nine reward ports. Rows (A–C) designate chambers whereas columns indicate port location relative to chamber entrance (1, back wall; 2, left wall; 3, right wall). Cyan dots, cue onset; red triangles, reward delivery. Each row represents an individual trial, with the first trial plotted at the bottom. Statistical evaluation of the responses to individual reward ports was performed in the time window of [−2,0] s relative to nose pokes. Neurons (A–Q) were from different sessions.
Figure 4.
Figure 4.
Ventral striatal neurons: spatial firing distributions and firing-rate responses associated with reward port approach. Figure follows conventions of Figure 3. A–O, Firing patterns of ventral striatal neurons were mostly rotationally symmetric and the densest firing was either found in the center of the Y-maze (A, C, J, K, O), or close to or at rewards ports (D, F, M). (P, Q, PETHs and rasters display single ventral striatal neurons that respond before or at arrival with a firing rate increase (P) or decrease (Q) to all ports. R, Neuron exhibiting responses to a few spatially unrelated ports. Neurons (A–R) were from different sessions. S, Composite histogram of the average firing pattern of all ventral striatal unit recordings, including two putative interneurons, aligned to nose-poke onset (t = 0; each row represents one neuron; color represents firing rate normalized on the cell's maximum, with maxima in red). Responses to multiple ports by a single neuron were lumped. The graph emphasizes the temporal spreading of single neuron responses in VS in relation to arrival at the goal site and associated behaviors.
Figure 5.
Figure 5.
Ventral striatal firing-rate responses associated with cue light onset. PETHs and raster diagrams show examples of four ventral striatal neurons that increased their firing rate in relation to illumination of cue lights (t = 0, green line; bin size 50 ms). Graphs represent pooled responses to multiple ports: upper left: all ports in one chamber (n = 3); upper right: symmetrically similar port locations pooled across chambers (n = 3); lower graphs: all nine ports combined. Plotting conventions are according to Figures 3 and 4. Statistical evaluation was performed in the time window of [0,250] ms following cue onset. Orange triangles indicate nose pokes in any reward port.
Figure 6.
Figure 6.
Ventral striatal units show larger rotational symmetry than hippocampal units. A, Spatial symmetry of single neuron firing patterns was defined as the average of partial correlation coefficients across the three pairs of chambers (A-B, A-C, B-C). The ventral striatal distribution of coefficients and the cumulative distribution (gray bars and line, respectively) were significantly shifted toward higher values than for HC (black bars and line). B, Spatial symmetry of individual neurons, two from HC (top, HC1 and HC2) and two from VS (bottom, VS1 and VS2). Firing rate is color coded and chambers were aligned with the side that connects to the center triangle shown on top. Rotational symmetry (Rav) is low for HC1 showing one distinct place field and for HC2 exhibiting place fields in two chambers. Striatal units generally showed similar firing patterns across the three chambers (VS1), although occasionally neurons with low symmetry were found (VS2), attributable at least in part to low spike counts.
Figure 7.
Figure 7.
Reward-predictive cues modulate firing patterns of hippocampal neurons. Rate and occupancy maps (A) and PETHs (B) of a representative hippocampal neuron reveal spatial and temporal compression of the firing pattern and an increased peak firing rate during Cue On versus ITI periods. Firing rates are color coded and superimposed on the representation of the trajectory of the rat (black). Maximal firing rate is noted in the lower left corner of the rate maps. Occupancy maps indicate that the rat explored the entire Y-maze in Cue On and ITI periods. PETH plot conventions as in Figure 3. C, Place field size during Cue On periods plotted against field size during ITIs of all neurons that showed significant location-specific firing in both periods.
Figure 8.
Figure 8.
Reward-predictive cues modulate ventral striatal firing patterns. Firing responses of a ventral striatal neuron associated with nose poking (t = 0: onset) are clearly expressed during Cue On periods but not during the same behavior in ITIs. A, Rate and occupancy maps. B, PETHs. Plot conventions as in Figure 3 and 7.
Figure 9.
Figure 9.
Position reconstruction is more accurate during cue-induced behavioral states. The position of rats was reconstructed using ensemble activity during reward port approach (t = 0: nose-poke onset) to compare the accuracy of population coding between Cue On periods and ITIs. Note that here and in Figure 10 putative interneurons were included but the results were nearly identical when they were not taken into account. The z-scored reconstruction error was significantly smaller in Cue On periods versus ITIs for both HC (A) and VS (B) up to ∼1 s before the nose poke (bin size = 250 ms; gray background: WMPSR, p < 0.05) indicating a higher accuracy for cued, goal-directed versus uncued, spontaneous behaviors.
Figure 10.
Figure 10.
Cued, goal-directed behaviors increase the temporal specificity of population coding. A, Hippocampal ensemble activity around nose-poke onset (t = 0) was correlated with ensemble firing at every other moment in this task phase (i.e., population vectors at different moments were cross-correlated). This was done for approaches during the Cue On period (top, left) and ITIs (bottom, left). Color scale represents strength of population vector correlation. Sparsity (top, right panel) of regions boxed on the left side is shown for 2 s before and after nose poke for Cue On (blue, FPcue) and ITI periods (red, FPITI). The sparsity of vector correlations during cued approach was stronger than for ITIs (gray shading, p < 0.05 WMPSR). The difference in correlations between Cue On and ITI periods is shown in the center plot. There were small but significant differences in average population firing rate (AvgDFR; gray shading; bottom, right; p < 0.05 WMPSR). B, Same as A but now for VS ensembles (Cue On: top right; ITIs: bottom right). There were small but significant differences in sparsity (gray; p < 0.05 WMPSR). There was no significant difference in the population average firing rate during approach (bottom, left).

Similar articles

Cited by

References

    1. Aggleton JP, Petrides M, Iversen SD. Differential effects of amygdaloid lesions on conditioned taste aversion learning by rats. Physiol Behav. 1981;27:397–400. - PubMed
    1. Alexander GE, Crutcher MD, DeLong MR. Basal ganglia-thalamocortical circuits: parallel substrates for motor, oculomotor, “prefrontal” and “limbic” functions. Prog Brain Res. 1990;85:119–146. - PubMed
    1. Annett LE, McGregor A, Robbins TW. The effects of ibotenic acid lesions of the nucleus accumbens on spatial learning and extinction in the rat. Behav Brain Res. 1989;31:231–242. - PubMed
    1. Balleine BW, Dickinson A. Goal-directed instrumental action: contingency and incentive learning and their cortical substrates. Neuropharmacology. 1998;37:407–419. - PubMed
    1. Berke JD, Breck JT, Eichenbaum H. Striatal versus hippocampal representations during win-stay maze performance. J Neurophysiol. 2009;101:1575–1587. - PMC - PubMed

Publication types

LinkOut - more resources