Randomized Controlled Trial
. 2012 Sep 5;32(36):12488-98.
doi: 10.1523/JNEUROSCI.1708-12.2012.

Predicting perceptual decision biases from early brain activity

Affiliations
Randomized Controlled Trial

Predicting perceptual decision biases from early brain activity

Stefan Bode et al. J Neurosci. .

Abstract

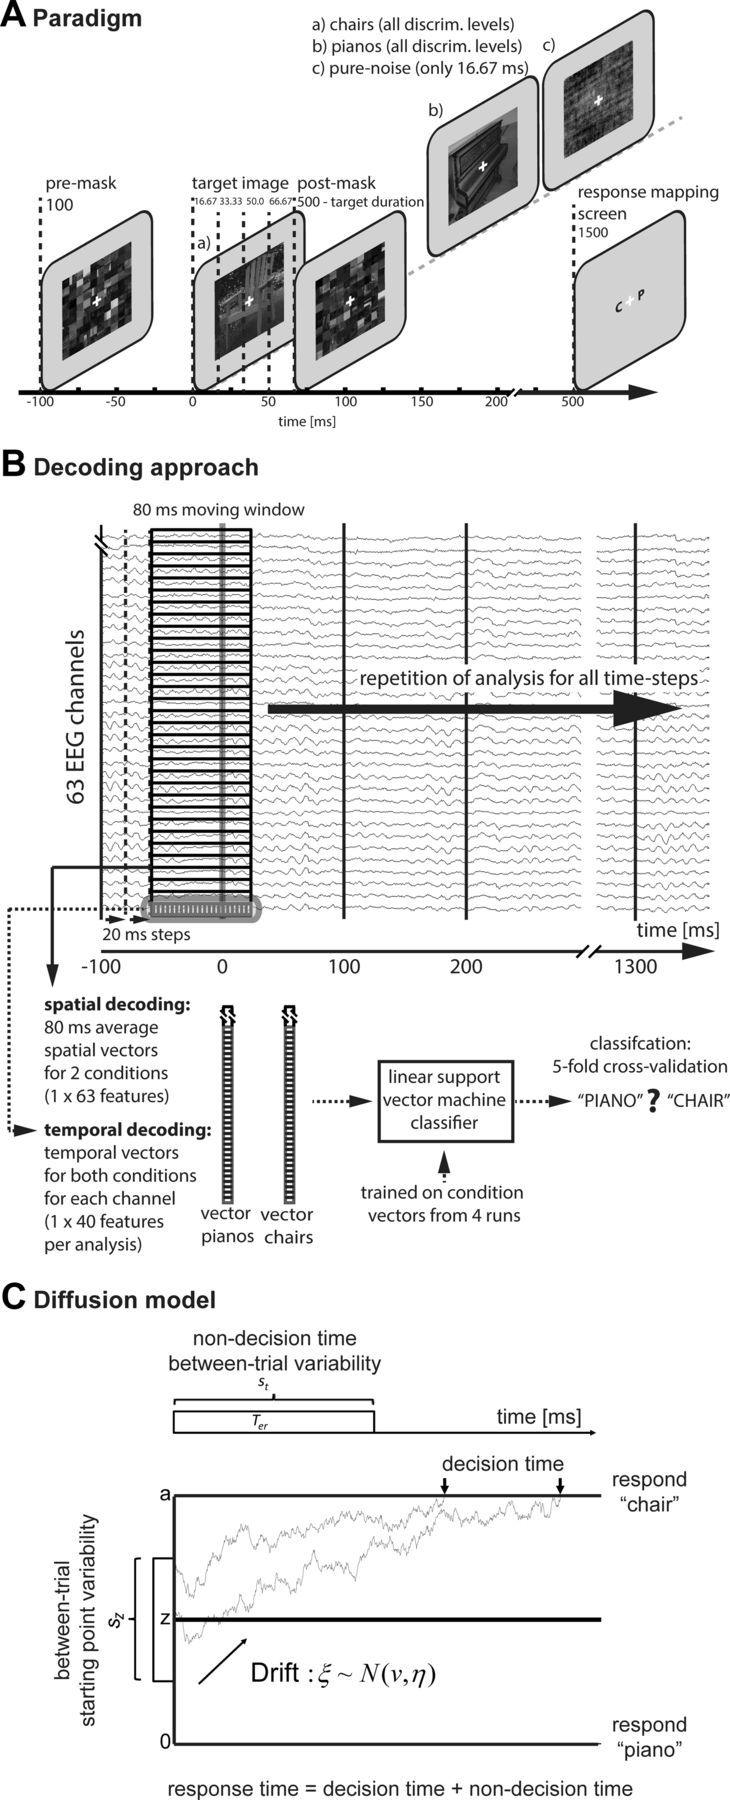
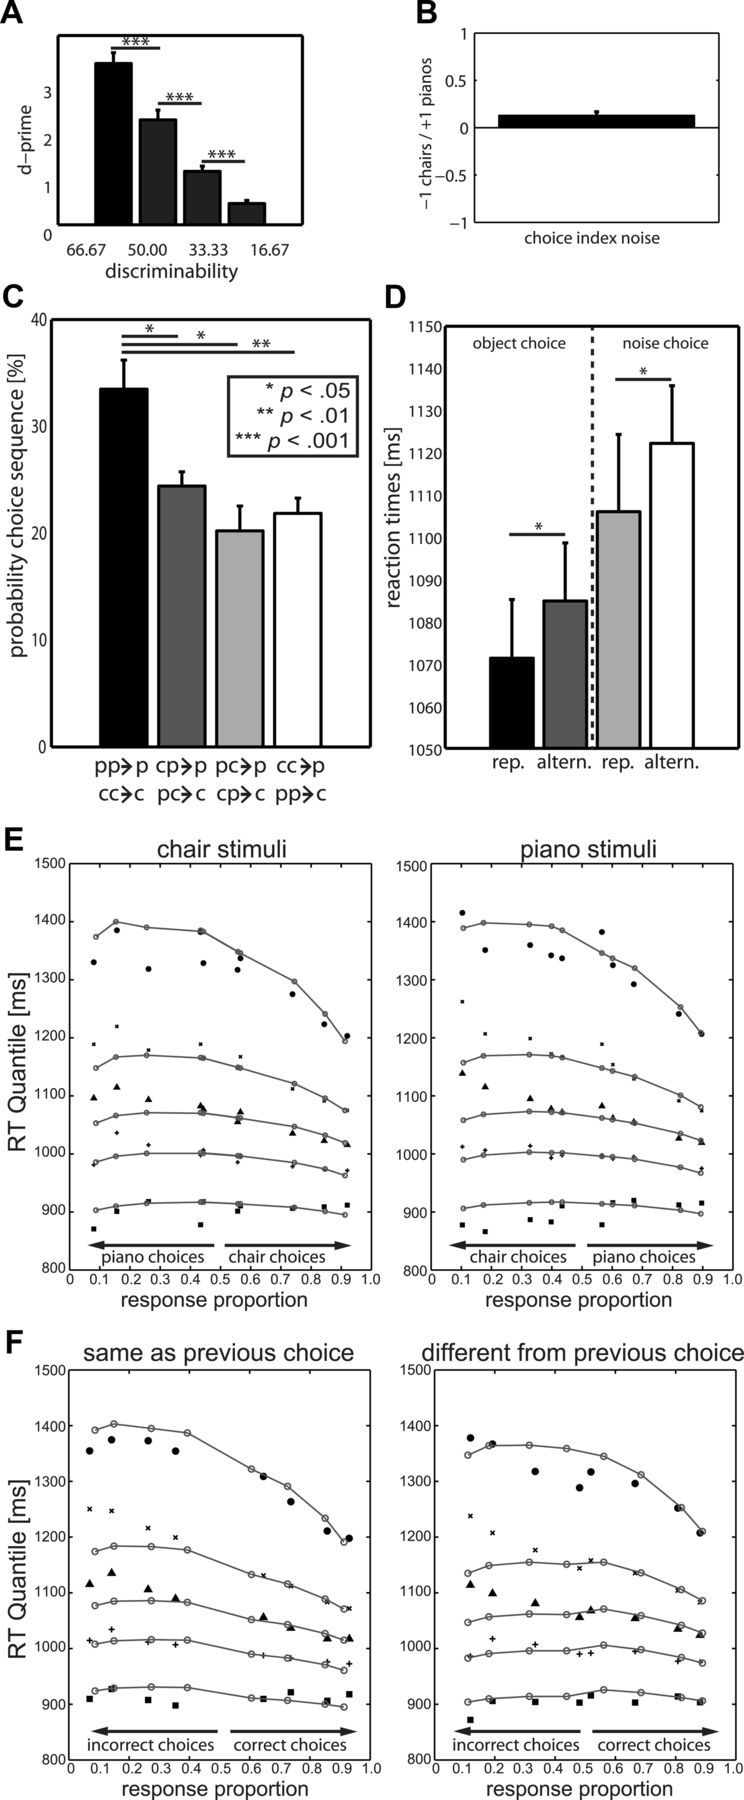
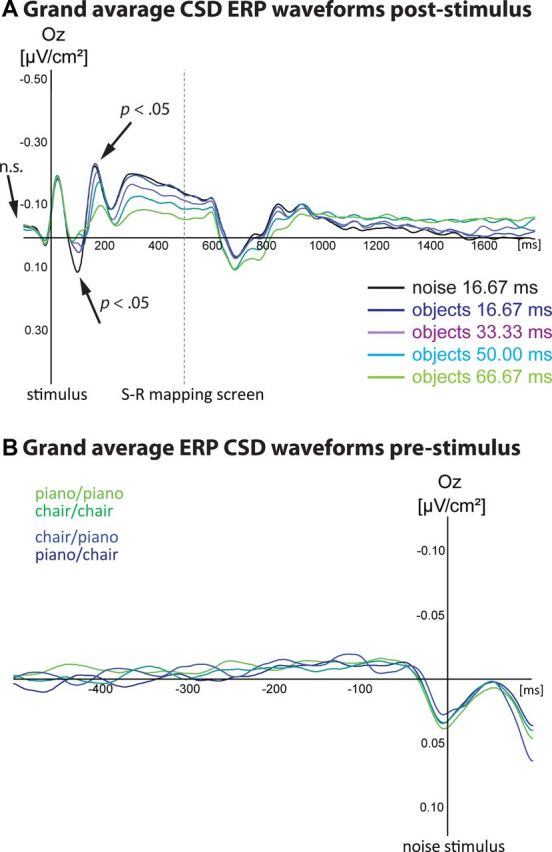
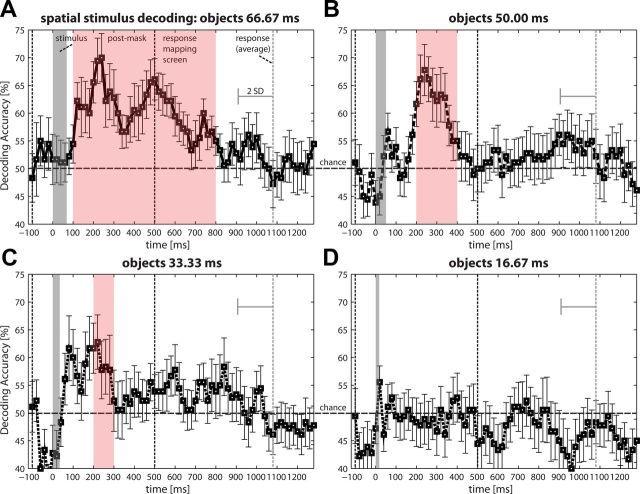
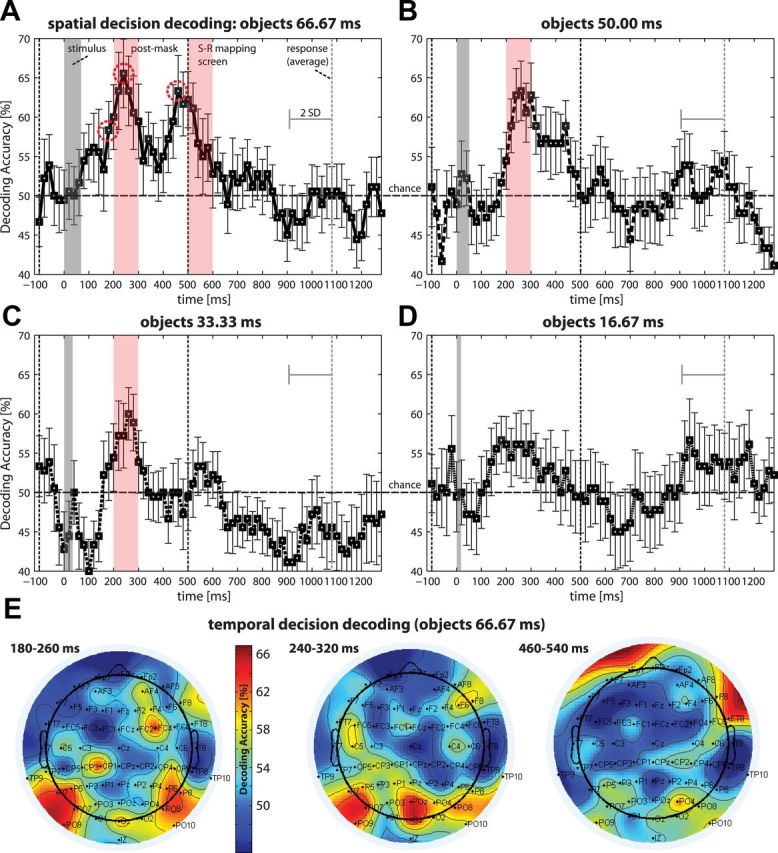
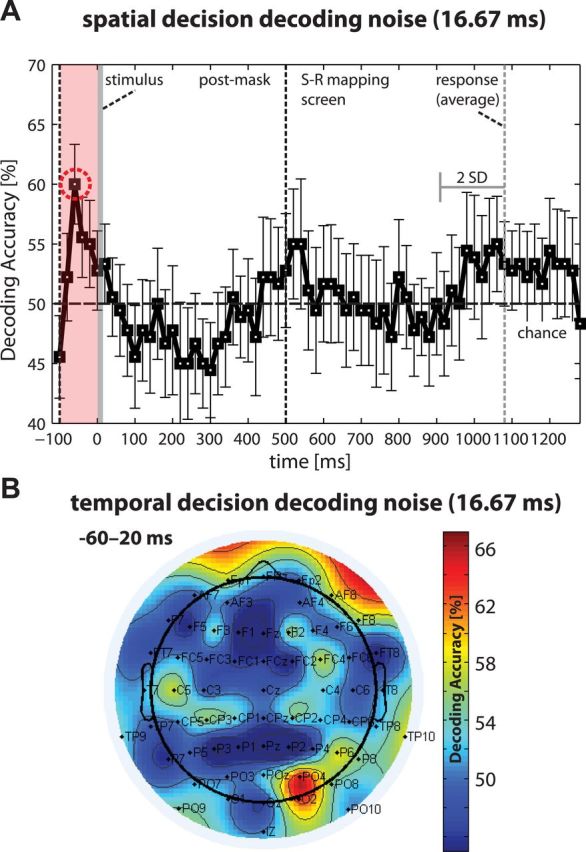
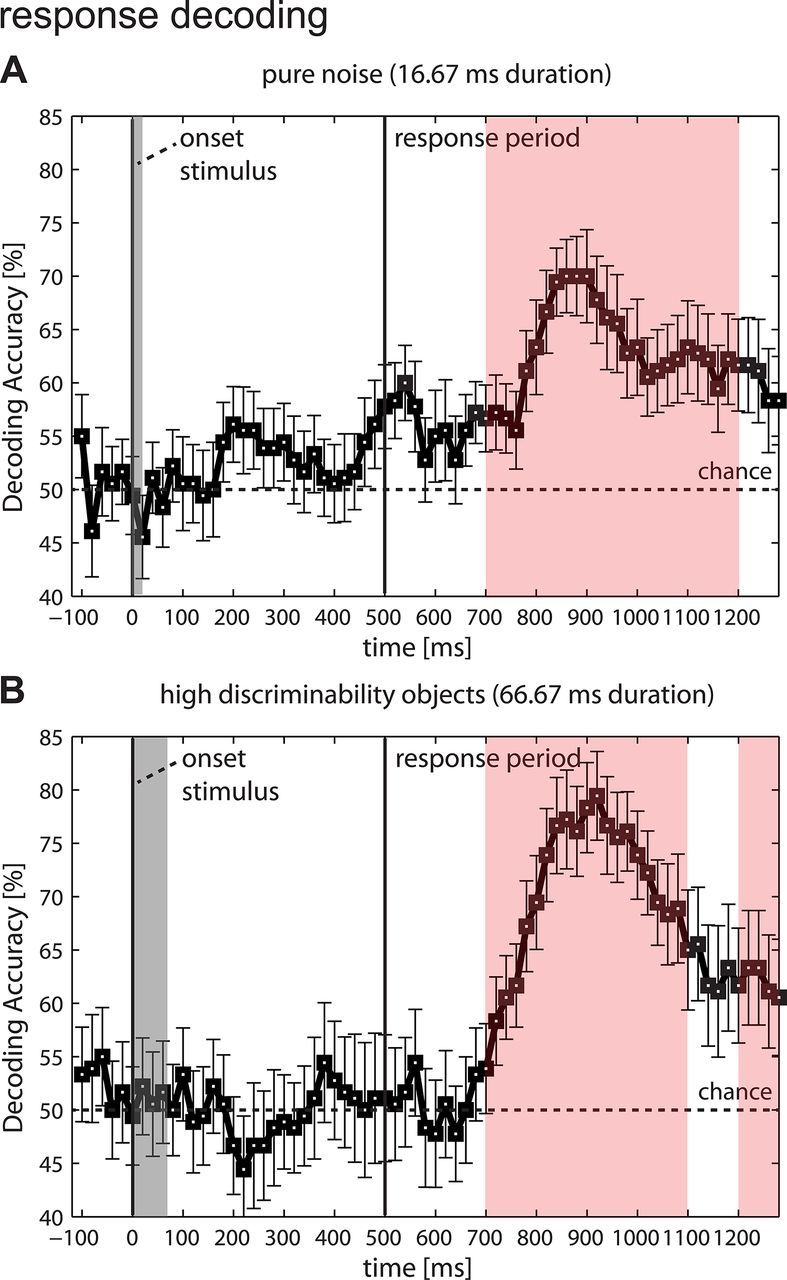
Perceptual decision making is believed to be driven by the accumulation of sensory evidence following stimulus encoding. More controversially, some studies report that neural activity preceding the stimulus also affects the decision process. We used a multivariate pattern classification approach for the analysis of the human electroencephalogram (EEG) to decode choice outcomes in a perceptual decision task from spatially and temporally distributed patterns of brain signals. When stimuli provided discriminative information, choice outcomes were predicted by neural activity following stimulus encoding; when stimuli provided no discriminative information, choice outcomes were predicted by neural activity preceding the stimulus. Moreover, in the absence of discriminative information, the recent choice history primed the choices on subsequent trials. A diffusion model fitted to the choice probabilities and response time distributions showed that the starting point of the evidence accumulation process was shifted toward the previous choice, consistent with the hypothesis that choice priming biases the accumulation process toward a decision boundary. This bias is reflected in prestimulus brain activity, which, in turn, becomes predictive of future decisions. Our results provide a model of how non-stimulus-driven decision making in humans could be accomplished on a neural level.


Figures

Figure 1.
Figure 1.
Experimental paradigm and methodology. A, Paradigm. A scrambled premask was presented at −100 ms. At time point 0 ms the target image was presented, followed by a scrambled postmask. In each of the five runs, 24 piano images and 24 chair images as well as 48 pure noise images (16 ms only) were shown in each discriminability condition. Participants were asked to choose the category of the presented image (piano or chair). Response mapping screens were pseudo-randomized. B, Multivariate pattern classification. For spatial decoding, data from all 63 head electrodes for each time step within a given trial were averaged within a time window of 80 ms, resulting in two 63-dimensional spatial vectors (chairs, pianos) per time step and per trial. A linear support vector machine classifier was used for classification of each time step (20 ms moving time-steps) separately. The temporal classification analysis was identical but used all 40 data points within the 80 ms time window as features for separate analyses for each channel. C, The diffusion model decomposes observed response time into time required to make a decision, and time related to nondecision components of processing. The first choice boundary reached by the diffusion process determines the overt response. The time taken to reach the choice boundary determines the decision time. Accumulation of perceptual evidence for one or the other alternatives begins at z. The distance between the absorbing boundaries reflects criterion setting. Evidence accumulation is assumed to be inherently noisy. The mean rate of evidence accumulation on a given trial is determined by the drift of the diffusion process. Drift is assumed to be normally distributed across trials with mean v and standard deviation η. The starting point of the evidence accumulation process is assumed to vary according to a uniform distribution centered at z, with range sz. Two example evidence accumulation paths are shown. The difference in the starting points of the pathways is due to between-trial starting point variability. The highly irregular paths are due to within-trial noise in the accumulation process. The top part of the figure summarizes the nondecision components of overall RT. Non-decision time is modeled as a uniform distribution centered at Ter, with range st.
Figure 2.
Figure 2.
Behavioral results. A, Average d ' (SE) differed significantly between discriminability levels. Error bars indicate SEM. B, Average choice index ([nπnch]/[nπ + nch]) indicated a slight but nonsignificant tendency toward piano choices. C, Probability of choosing piano (p) or chair (c) on a pure noise trial as a function of choices made on two consecutive noise trials. Priming effects were significant and even stronger if the same choice had been made on the preceding two trials. D, Repetition trials were faster than alternation trials. E, Diffusion model fit. The correct and error response time quantiles (black symbols) for each discriminability condition for both chair and piano stimuli are plotted together with predictions of the diffusion model (open circles/gray lines). In each panel, the response time quantiles for each discriminability condition are plotted (y-axis) as a function of choice probability (x-axis). The noise condition is redundantly plotted in each panel. F, Diffusion model fit for biased starting point model. Trials are collapsed across piano and chair decisions and sorted with respect to the choice from the previous trial. The correct and error response time quantiles (black symbols) for each discriminability condition are plotted together with predictions of the diffusion model (open circles/gray lines). In each panel, the response time quantiles for each discriminability condition are plotted (y-axis) as a function of choice probability (x-axis).
Figure 3.
Figure 3.
Grand average CSD ERPs. A, The visual inspection of the grand average waveforms indicated strongest differences between discriminability levels at Oz electrode site in the time-periods of 50–150 (CSD-P1), 100–200, (CSD-N1), 300–450 ms (CSD-N3), and 300–600 ms (CSD-P3) (displayed for correct responses and for all pure noise trials). Significant differences between the pure noise condition and all other conditions could be found ∼100 ms poststimulus. The object discriminability conditions did not significantly differ from each other. Differences between discriminability conditions showed a first negative peak ∼200 ms. In the 66.67 ms condition, the CSD-N2 amplitude was significantly smaller compared with the 16.67 ms condition (p < 0.001), the 33.33 ms condition (p < 0.05), and the pure noise condition (p < 0.01). These differences were very pronounced during the following 500 ms. This component was smaller in the 66.67 ms condition compared with the 16.67 ms condition (p < 0.001), the 33.33 ms condition (p < 0.05), and the pure noise condition (p < 0.001). The 33.33 ms condition and the pure noise condition also differed significantly (p < 0.01). No differences between any discriminability conditions were found in the prestimulus interval. No analysis revealed any differences between pianos and chairs for any discriminability condition. 0 ms = stimulus onset; negativity is plotted upwards. B, Grant average ERP CSD waveforms at Oz electrode site preceding the onset of the following pure noise trial. ERP waveforms are displayed separately for each combination of choices (piano–piano, chair–chair, piano–chair, chair–piano). No significant differences were found, confirming that ERPs from the preceding trial were not related to choice outcomes on the following noise trials (p > 0.10). The displayed electrode site was representative for all electrode sites.
Figure 4.
Figure 4.
Decoding the presented stimuli from EEG-CSD data. A linear SVM classifier was used on averages of 80 ms windows with 20 ms time-steps (the average accuracy for all classifications within 100 ms time windows was tested using a permutation test; time point 0 = stimulus presentation). Decoding for A, 66.67 ms; B, 50.00 ms; C, 33.33 ms; and D, 16.67 ms target duration. Stimuli could be predicted from the time windows beginning 100 ms after stimulus presentation (66.67 ms) or 200 ms after stimulus presentation (50.00 and 33.33 ms). The range of times during which decoding accuracy was significant above chance decreased with discriminability and no information was found for the lowest discriminability condition (16.67 ms). Note, however, that onset and peak times can only be approximations because these analyses cannot unambiguously resolve the occurrence of information within the averaged time window. Error bars indicate SEM. Significant time windows are highlighted.
Figure 5.
Figure 5.
Decoding category choices from EEG-CSD data for object stimuli. A linear SVM classifier was used on averages of 80 ms windows with 20 ms time-steps (the average accuracy for all classifications within 100 ms time windows was tested using a permutation test; time point 0 = stimulus presentation). Decoding for A, 66.67 ms; B, 50.00 ms; C, 33.33 ms; and D, 16.67 ms target duration. Error bars indicate SEM. Significant time windows are highlighted. E, Independent temporal pattern classification using data within each 80 ms window for each channel separately. Scalp maps show decoding accuracy for selected times corresponding to onset and peaks in spatial decoding (highest discriminability). During early stages, mostly occipital and parietal electrodes encoded choices (P7, P5, PO7, PO9, P6, P8, FC4, all p < 0.01; PO8, Oz, all p < 0.05; O2, p = 0.07). Similar channels were predictive during the first peak (POz, Oz, all p < 0.001; P7, PO7, PO9, P6, PO8, O2, all p < 0.05; F6, p = 0.05; P5, p = 0.06; PO4, p = 0.08). During the second peak prefrontal electrodes and parietal channels were predictive (FT8, PO4, all p < 0.01; Fp1, F8, all p < 0.05; PO8, p = 0.07).
Figure 6.
Figure 6.
Decoding the category choices from EEG-CSD data for pure noise. A, A linear SVM classifier was used on averages of 80 ms windows with 20 ms time-steps (the average accuracy for all classifications within 100 ms time windows was tested using a permutation test; time point 0 = stimulus presentation). Choices could only be predicted before stimulus presentation (−100–0 ms). Error bars indicate SEM. Significant time windows are highlighted. B, Independent temporal multivariate pattern classification using the data within each 80 ms time window for each channel separately. The scalp map shows decoding accuracy for the selected −60–20 ms window. Occipitoparietal channels (PO4, O2, all p < 0.01; Pz, p < 0.05; PO8, p = 0.07; PO9, p = 0.08) and by trend frontopolar channels (AF8, p = 0.09; Fp1, p = 0.10) were predictive for choice outcomes.
Figure 7.
Figure 7.
Decoding the motor responses. Displayed are decoding accuracies from spatial motor response decoding analysis (80 ms width, 20 ms moving time steps, left vs right button press, 50% chance level; 100 ms time window analysis using a permutation test). A, Pure noise condition. Responses could only be decoded until after the presentation of the response mapping screen (peak 70% accuracy at 920–1000 ms). B, High discriminability object condition (stimulus duration 66.67 ms). Similar to all other object conditions (illustrated only for highest discriminability condition), motor responses could again only be decoded after the presentation of the response mapping screen (peak 79% accuracy at 940–1020 ms). Thus, participants made true category choices and did not prepare random motor responses. The absence of motor response encoding early in the trial also confirmed that motor response priming cannot explain our choice decoding results. Significant time windows are highlighted.

References

    1. Bai O, Lin P, Vorbach S, Li J, Furlani S, Hallett M. Exploration of computational methods for classification of movement intention during human voluntary movement from single trial EEG. Clin Neurophysiol. 2007;118:2637–2655. - PMC - PubMed
    1. Blankertz B, Lemm S, Treder M, Haufe S, Müller KR. Single-trial analysis and classification of ERP components—A tutorial. Neuroimage. 2011;56:814–825. - PubMed
    1. Bode S, He AH, Soon CS, Trampel R, Turner R, Haynes JD. Tracking the unconscious generation of free decisions using ultra-high field fMRI. PLoS ONE. 2011;6:e21612. - PMC - PubMed
    1. Bode S, Bogler C, Soon CS, Haynes JD. The neural encoding of guesses in the human brain. Neuroimage. 2012;59:1924–1931. - PubMed
    1. Boly M, Balteau E, Schnakers C, Delgueldre C, Moonen G, Luxen A, Phillips C, Peigneux P, Maquet P, Laureys S. Baseline brain activity fluctuations predict somatosensory perception in humans. Proc Natl Acad Sci U S A. 2007;104:12187–12192. - PMC - PubMed

Publication types

LinkOut - more resources