. 2012 Sep 5;32(36):12506-17.
doi: 10.1523/JNEUROSCI.2306-12.2012.

Key electrophysiological, molecular, and metabolic signatures of sleep and wakefulness revealed in primary cortical cultures

Affiliations

Key electrophysiological, molecular, and metabolic signatures of sleep and wakefulness revealed in primary cortical cultures

Valérie Hinard et al. J Neurosci. .

Abstract

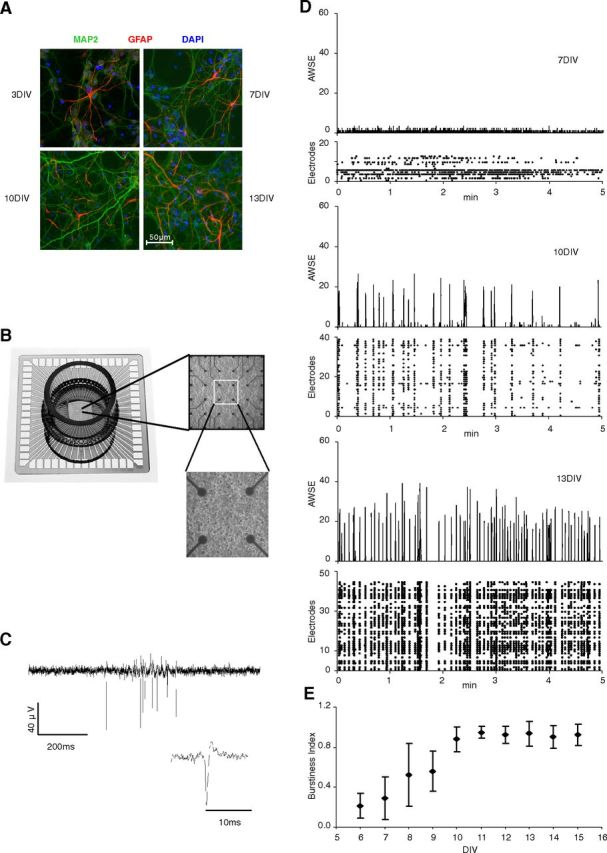
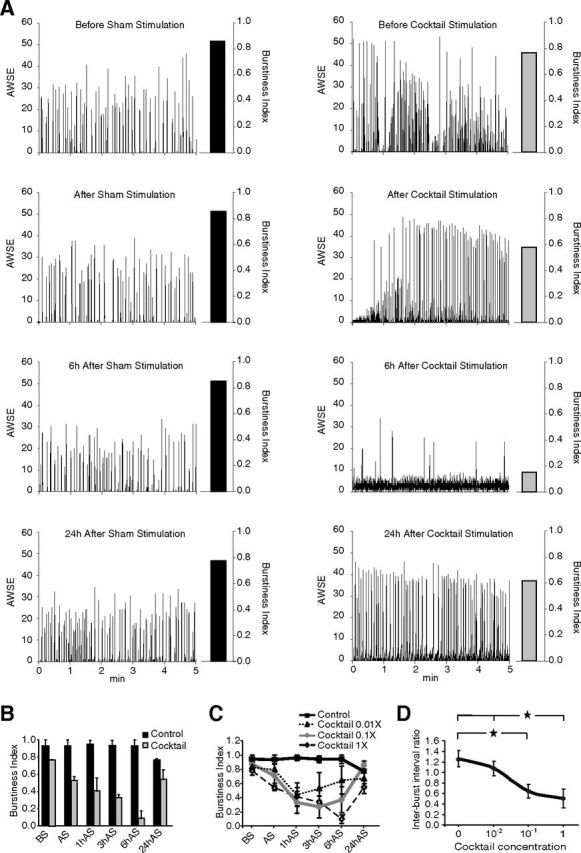
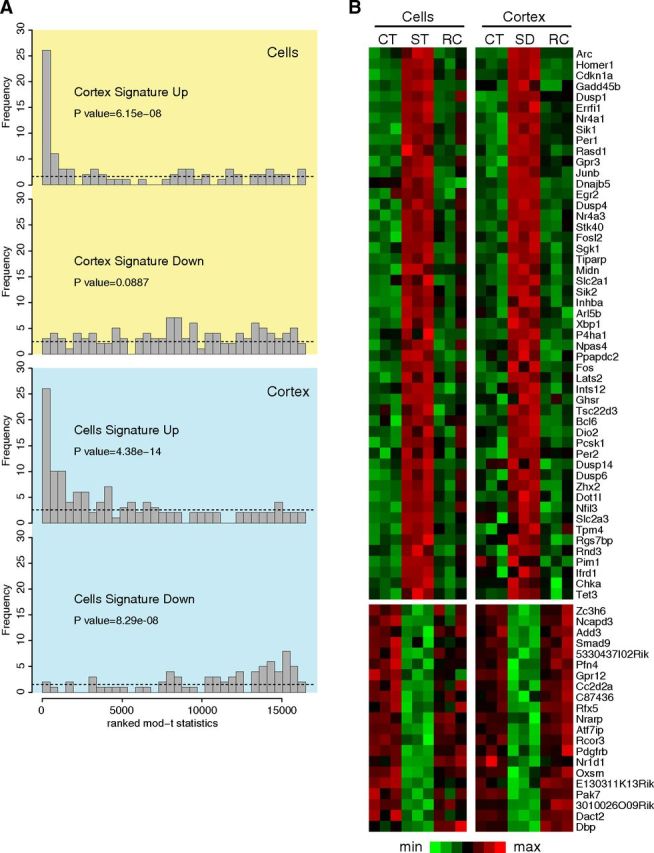
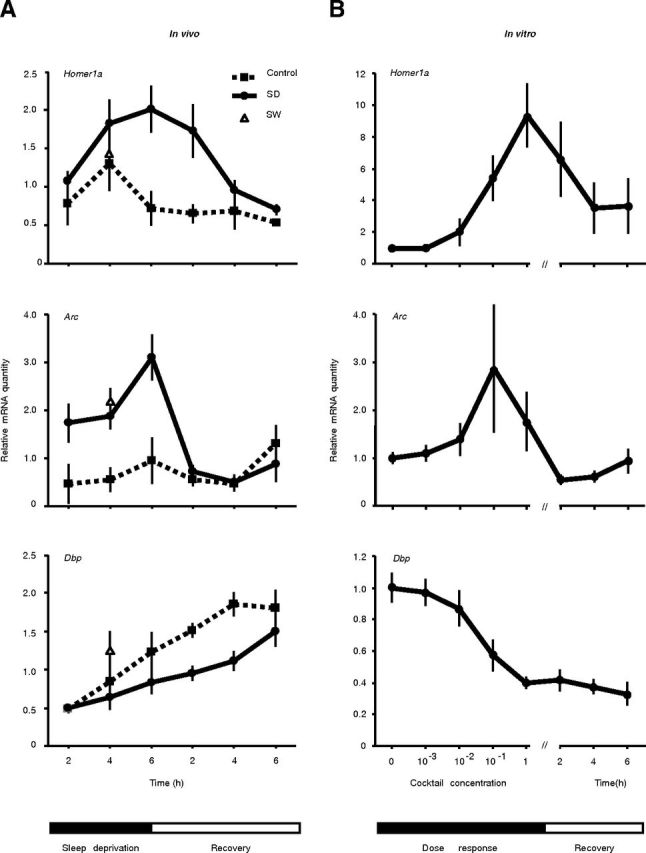
Although sleep is defined as a behavioral state, at the cortical level sleep has local and use-dependent features suggesting that it is a property of neuronal assemblies requiring sleep in function of the activation experienced during prior wakefulness. Here we show that mature cortical cultured neurons display a default state characterized by synchronized burst-pause firing activity reminiscent of sleep. This default sleep-like state can be changed to transient tonic firing reminiscent of wakefulness when cultures are stimulated with a mixture of waking neurotransmitters and spontaneously returns to sleep-like state. In addition to electrophysiological similarities, the transcriptome of stimulated cultures strikingly resembles the cortical transcriptome of sleep-deprived mice, and plastic changes as reflected by AMPA receptors phosphorylation are also similar. We used our in vitro model and sleep-deprived animals to map the metabolic pathways activated by waking. Only a few metabolic pathways were identified, including glycolysis, aminoacid, and lipids. Unexpectedly large increases in lysolipids were found both in vivo after sleep deprivation and in vitro after stimulation, strongly suggesting that sleep might play a major role in reestablishing the neuronal membrane homeostasis. With our in vitro model, the cellular and molecular consequences of sleep and wakefulness can now be investigated in a dish.


Conflict of interest statement

The authors declare no financial conflicts of interest.

Figures

Figure 1.
Figure 1.
The sleep-like state emerges after 10 DIV. A, The structural organization of cortical cultures at different time points shows a progressive establishment of complex interconnected neuronal networks. Neurons are stained with anti-MAP2 (red), astrocytes with anti-GFAP (green), and cell nuclei with DAPI (blue). Note that cultures are enriched in neurons (86–94% neurons and 1–14% astrocytes from 3–13 DIV). B, The MEA used for recording firing activity is composed of 60 electrodes arranged on a culture surface. C, Typical bursting activity recorded from one electrode with an expanded illustration of a single spike (amplitude scale bar applies to both panels). D, Five-minute MEA recordings performed from 6 DIV onwards at daily intervals (7, 10, and 13 DIV shown) show initial random activity (7 DIV), which becomes progressively synchronized throughout the array by 10 DIV. For each DIV, the bottom panel (Electrodes) depicts timing of firing at individual electrodes. The top panel shows the number of electrodes for which simultaneous firing activity was observed. AWSE, Array-wide synchronous electrodes. E, Synchronized burst–pause activity, quantified with the burstiness index (with an index of 1 indicating synchronized firing over all recorded electrodes; see Materials and Methods), increases until 10 DIV, after which a plateau is reached, representing the prevailing default firing mode in mature cortical cultures. Values for each DIV represent means ±1 SD of at least three different cultures. Note that not all 60 electrodes of each MEA detect firing activity, but that their number increases with the maturation of cortical cultures.
Figure 2.
Figure 2.
The sleep-like state can be changed into active wake-like state. A, Mature cortical cultures (11–13 DIV) were stimulated with either distilled water (Sham, left) or the neurotransmitter cocktail (right). Typical 5 min MEA recordings before (BS), immediately after (AS), 6 h after (6hAS), and 24 h after (24hAS) the stimulation are shown. Stimulation completely abolished the typical burst–pause activity 6 h after stimulation and reappeared 24 h later. Within each panel, the array-wide synchronous electrodes (AWSE) and corresponding burstiness index (vertical bar) for the 5 min recordings are indicated (see Fig. 1 for details). B, Mean burstiness index (+1 SD; n = 3+) in the sham and cocktail-stimulated conditions was calculated in the 5 min before and 5 min and 1, 3, 6, and 24 h after the stimulation. The stimulation significantly changed bursting pattern (two-way ANOVA with factors: condition, F(1,27) = 69.95, p < 10−8; time, F(5,27) = 3.56, p < 0.02; and interaction, F(5,27) = 5.04, p < 0.003). C, Cortical cultures stimulated with different concentrations of the neurotransmitter cocktail (0.01×, 0.1×, and 1×; n = 3, mean ± 1 SD) show changes in bursting activity in a dose-dependent manner (two-way ANOVA with factors: dose, F(3,45) = 29.20, p < 10−10; time, F(5,45) = 9.58, p < 3 × 10⁻⁶; and interaction, F(15,45) = 3.12, p < 0.002). Note that minimum bursting activity is reached later (i.e., 1, 3, and 6 h after stimulation) with increasing concentration and that values revert to control levels thereafter. D, Interburst intervals are shorter after stimulation with different concentrations of the neurotransmitter cocktail (0×, 0.01×, 0.1×, and 1×; n = 3, mean ± 1 SD) compared with baseline (before stimulation) in a dose-dependent manner (ANOVA: F(3,8) = 12.4, p < 0.003; *p < 0.05, post hoc Tukey test).
Figure 3.
Figure 3.
Gene expression signatures in vitro and in vivo. A, Probe sets were ranked by their moderated t statistic and binned into 34 bins. The bins were ordered from the highest t statistic (left) to the lowest t statistic (right); the yellow box is from the in vitro dataset and in the blue box is from the in vivo dataset. The number of upregulated (or downregulated) probe sets from the sleep signature of the other condition dataset is displayed in each bin (the height of the bar). Under the assumption that the transcription signature of one dataset is not differentially regulated in the other dataset, probe sets from the signature should be uniformly distributed among bins, as indicated by the dashed line. The peaks on the left show that the upregulated sleep signature of one dataset tend to be upregulated in the other dataset. p values from the Mann–Whitney U test are indicated. B, Heat map with genes identified as sleep-responsive genes both in cortex and in cell cultures. Expression data were scaled (mean-centered and variance normalized) for each dataset separately. CT, Control; ST, stimulated; SD, sleep-deprived; RC, recovery. Genes are ordered by Z scores.
Figure 4.
Figure 4.
Similarities in the time course of gene expression in vivo (A) and in vitro (B). The time course of gene expression was followed in vivo by sleep depriving (SD) mice (n = 4 for each time point) for 2, 4, and 6 h; 6-h-sleep-deprived mice were allowed 2, 4, or 6 h of recovery (left). Undisturbed home-cage controls were also assessed at the same time points (Control). A reference level of expression corresponding to 4 h of spontaneous wakefulness (SW) is indicated by a triangle (note that this point is 4 h into the dark period and not at the same circadian time as the 4 h of sleep deprivation after lights-on). Homer1a is overexpressed proportional to the time kept awake and decreases slowly during the recovery period, while Arc shows a rapid recovery after 6 h of sleep deprivation. Dbp is decreased by sleep deprivation and the recovery is slow. To show the similarity in the time course of gene expression, primary cortical cultures (n = 3 measured in triplicates) were stimulated at indicated concentrations of our waking cocktail; those stimulated for 3 h with 1× cocktail were allowed 2, 4, or 6 h of recovery (right).
Figure 5.
Figure 5.
Circadian rhythms in vitro. Recording of circadian changes in PER2-bioluminescence in primary cortical cultures prepared from PerLuc knock-in embryos. A, Stimulation at 0 h (blue triangle) with 1× neurotransmitter cocktail after 11 d in vitro induced a circadian oscillation in PER2-bioluminescence with a mean period length of 23.5 h (n = 15; including recordings in B). Period length was calculated over the first cycle as the difference between the time of the second and first trough. B, Cocktail-induced phase shifts depend on circadian phase. A second stimulation (blue triangle) with cocktail (or water) given at circadian time (CT)3.5 (red) or CT11.7 (green line; n = 3/condition) resulted in a phase advance or delay, respectively. Phase shifts were calculated according to differences in the time PER2-bioluminescence peaked during the cycle after the stimulation between stimulated (cocktail) and control (water) conditions. Values represent circadian hours calculated according to individual period length in the cycle before stimulation. Note that CT0, denoting the time trough values are reached in culture, corresponds to approximately Zeitgeber time (ZT)6 in vivo in the cortex of adult PerLuc mice under entrained conditions. Waveforms represent 100 min moving averages at 10 min intervals (n = 3/condition). C, The mean (±1 SEM) phase delay was significant (green bar; *p < 0.05), while the phase advance only showed a trend (red bar; Xp < 0.09; t tests; n = 3/condition). Black bars show the change in phase in the two control conditions (H2O) relative to the recording in A (p > 0.10; n = 3/condition).
Figure 6.
Figure 6.
Similarities in the Ser845 phosphorylation of GluR1 subunit in vivo and in vitro. A, Western blot of synaptoneurosomes from half cortical hemisphere of C57BL/6J mice sleep deprived for 0, 2, or 6 h and sleep deprived for 6 h and let recovered for 2 or 4 h. A representative blot of Ser845-phosphorylated GluR1 and IgY loading control is shown. Quantitative analysis were performed with ImageJ and presented as the phosphorylated Ser845-GluR1 amount relative to IgY internal control (mean + SD of three mice per condition). B, Western blot of synaptoneurosomes from mature cortical cultures (11–13 DIV) stimulated with either distilled water (C, control) or the neurotransmitter cocktail and sampled after 1, 3, 6, or 24 h. A representative blot of Ser845-phosphorylated GluR1 and IgY loading control is shown. Quantitative analysis is presented as the phosphorylated Ser845-GluR1 amount relative to IgY internal control (mean + SD of three independent cultures). *Significant (p < 0.01) differences with the control condition (post hoc Tukey test).
Figure 7.
Figure 7.
Oxygen consumption increases in stimulated cortical cultures. A, In vivo oxygen consumption of C57BL/6J mice increased by 40% during the dark active period compared with the light rest period. The VO2 at each time point is expressed relative to the mean of the VO2 of the first 4 h of the first light period (black bar). Data indicate means ± SEM. B, Stimulation of cortical neurons increased by 40% oxygen consumption within 5 min, and increased oxygen consumption is maintained during 2 h. Data are from 10 wells per condition (mean ± SD).

References

    1. Achermann P, Borbély AA. Low-frequency (<1 Hz) oscillations in the human sleep electroencephalogram. Neuroscience. 1997;81:213–222. - PubMed
    1. Benington JH, Heller HC. Restoration of brain energy metabolism as the function of sleep. Prog Neurobiol. 1995;45:347–360. - PubMed
    1. Bersagliere A, Achermann P. Slow oscillations in human non-rapid eye movement sleep electroencephalogram: effects of increased sleep pressure. J Sleep Res. 2010;19:228–237. - PubMed
    1. Brown AM. Brain glycogen re-awakened. J Neurochem. 2004;89:537–552. - PubMed
    1. Campbell SS, Tobler I. Animal sleep: a review of sleep duration across phylogeny. Neurosci Biobehav Rev. 1984;8:269–300. - PubMed

Publication types