. 2012 Sep 5;32(36):12558-69.
doi: 10.1523/JNEUROSCI.1618-12.2012.

Dynamics of local input normalization result from balanced short- and long-range intracortical interactions in area V1

Affiliations

Dynamics of local input normalization result from balanced short- and long-range intracortical interactions in area V1

Alexandre Reynaud et al. J Neurosci. .

Abstract

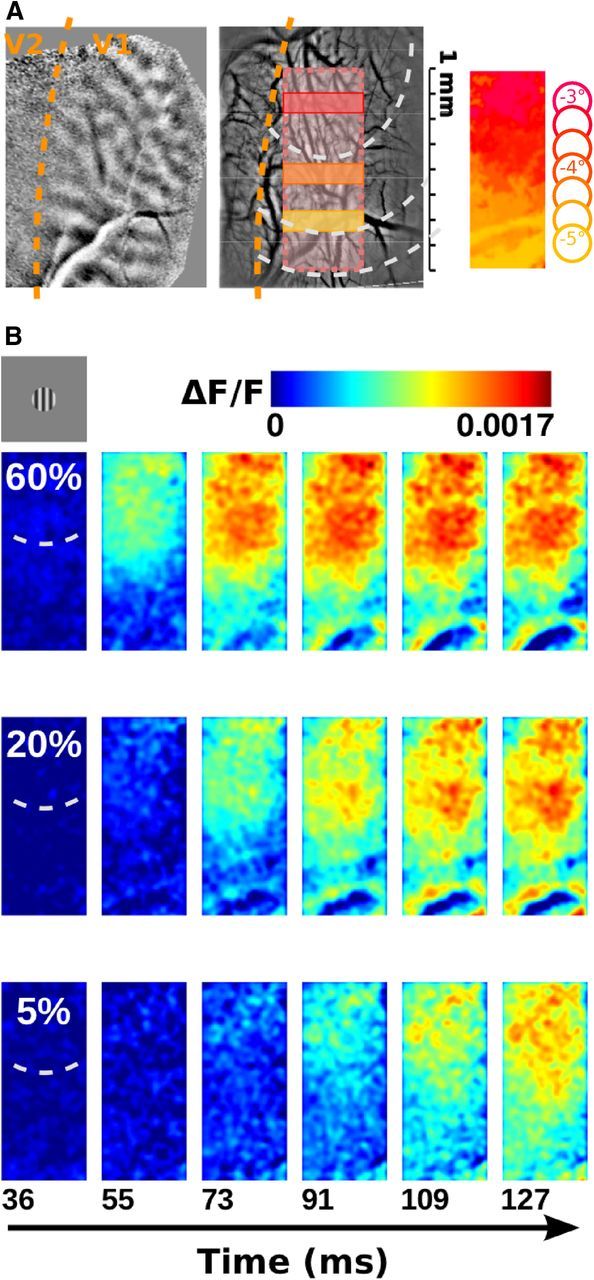
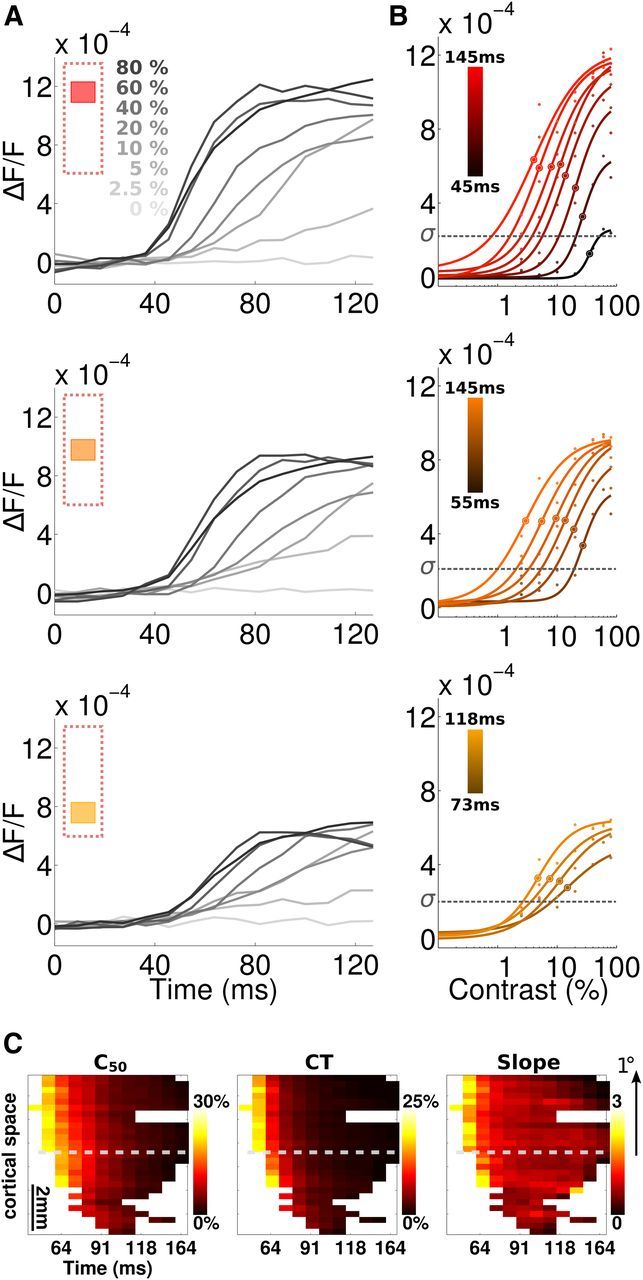
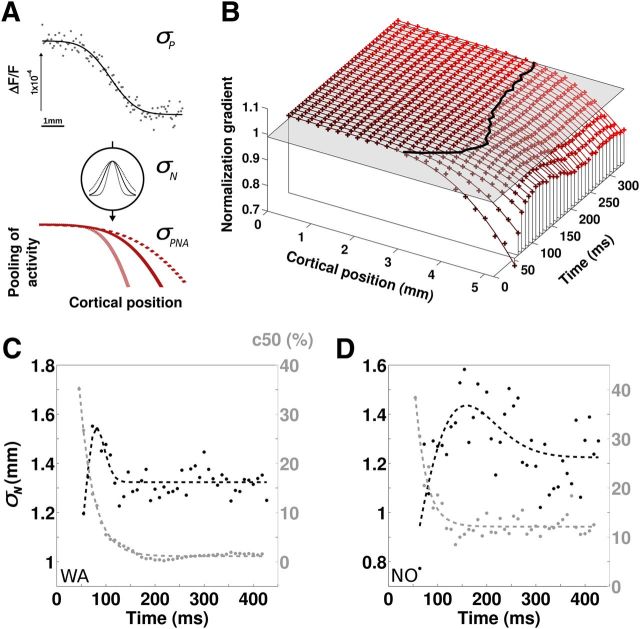
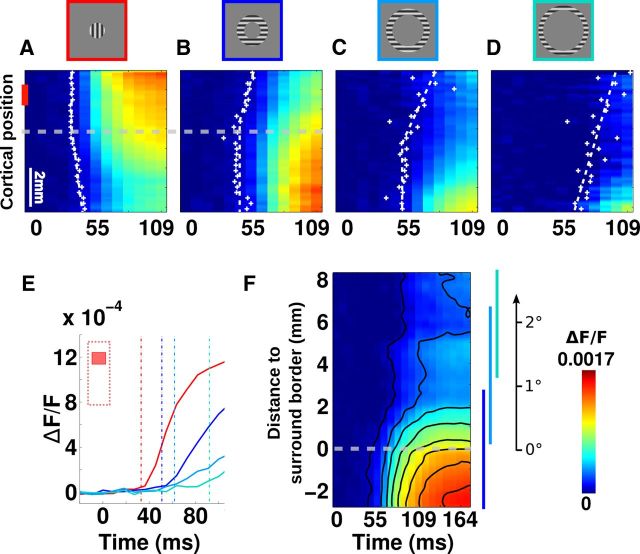
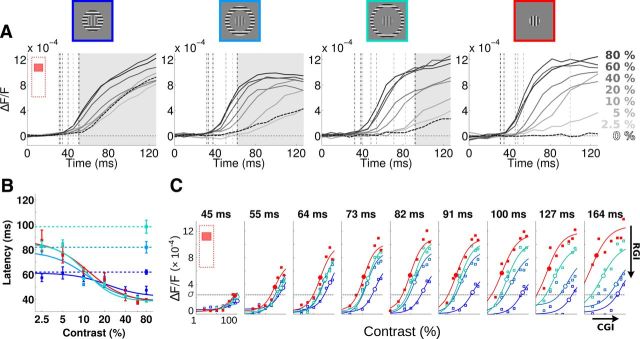
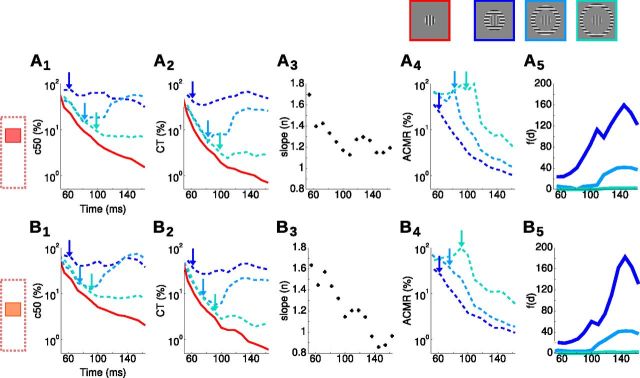
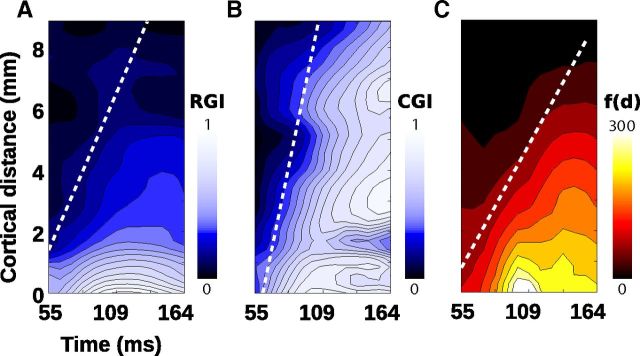
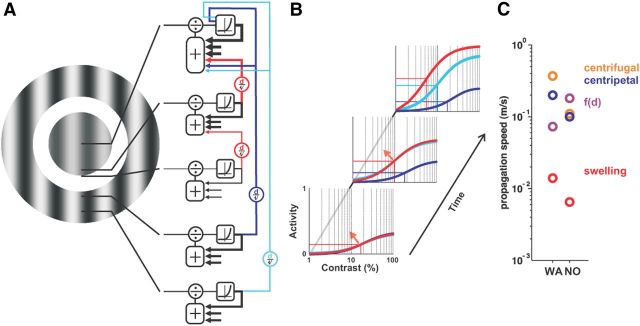
To efficiently drive many behaviors, sensory systems have to integrate the activity of large neuronal populations within a limited time window. These populations need to rapidly achieve a robust representation of the input image, probably through canonical computations such as divisive normalization. However, little is known about the dynamics of the corticocortical interactions implementing these rapid and robust computations. Here, we measured the real-time activity of a large neuronal population in V1 using voltage-sensitive dye imaging in behaving monkeys. We found that contrast gain of the population increases over time with a time constant of ~30 ms and propagates laterally over the cortical surface. This dynamic is well accounted for by a divisive normalization achieved through a recurrent network that transiently increases in size after response onset with a slow swelling speed of 0.007-0.014 m/s, suggesting a polysynaptic intracortical origin. In the presence of a surround, this normalization pool is gradually balanced by lateral inputs propagating from distant cortical locations. This results in a centripetal propagation of surround suppression at a speed of 0.1-0.3 m/s, congruent with horizontal intracortical axons speed. We propose that a simple generalized normalization scheme can account for both the dynamical contrast response function through recurrent polysynaptic intracortical loops and for the surround suppression through long-range monosynaptic horizontal spread. Our results demonstrate that V1 achieves a rapid and robust context-dependent input normalization through a timely push-pull between local and lateral networks. We suggest that divisive normalization, a fundamental canonical computation, should be considered as a dynamic process.


Figures

Figure 1.
Figure 1.
Spatio-temporal VSDI activation to local stimuli at various contrasts. A, Left, Ocular dominance maps were used to delimit the functional border between V1 and V2. Middle, Superimposed registered images of the cortical vasculature over five sessions. The overlaid rectangle indicates the ROI common in all sessions, the dotted arc-circles indicate retinotopic representations of the stimulus for the center (2° diameter) to the periphery (dotted arc-circles at 1° and 1.8° eccentricity to the center outer border). The different colored rectangles indicate the region of interest used in the next figure. Right, Color-coded retinotopic map of the cortical rectangular region defined in the middle panel. The retinotopy was obtained in response to seven local stimuli placed from −3° to −5° below the fovea (and 0.5° on the left). B, Time sequence of cortical response to local stimuli presented at 5%, 20%, and 60% contrast.
Figure 2.
Figure 2.
The temporal and spatial aspects of the contrast response function. A, Time course of the VSDI response to all contrasts (from 0% to 80%) in three different regions of interests from the central (top, red) to peripheral (bottom, yellow) locations. B, Contrast response function of VSDI response for same regions as in A (hue of the color code) over time (measured in 9.09 ms time bins, ranging from 27 to 145 ms, brightness of the color code). Observed data (dots) are presented with the Naka–Rushton best-fit (curve). The SD (σ) estimated on blank trials is shown as a horizontal dotted line. C, Spatio-temporal representation of c50 (left), CT (middle), and n (right) from the Naka–Rushton function from central (1–3 mm) to eccentric (4–6 mm) positions. Holes correspond to positions leading to nonsignificant fit. Dashed gray lines indicate the center stimulus border projection calculated from Figure 4. Data are averaged over the anteroposterior axis of the ROI shown in Figure 1A. An alternate visual dimension scale is shown on the right-hand side of the figure.
Figure 3.
Figure 3.
Estimating the dynamics of the normalization pool size. A, Population normalization pool model (see text). The measured spatial profile of activity along the cortical dimension (top) is fitted by an error function with SD σP. Pooling of neuronal activity is modeled as a spatial Gaussian of SD σN. The resulting spatial profile of the pooling of activity is an error function of SD σPNA equal to the root mean square of σN2 + σP2. Varying the Gaussian pooling (gray or dotted line) will affect the shape of the spatial profile of the activity pooling. B, NG (see text) is plotted as a function of cortical position and time (“+”). The NG spatial profiles were fitted with error functions (continuous lines). The gray plane is a threshold intercept of the NG at 99%, delimiting the border within which test and reference CoRFs are identical (black curve). C, D, Dynamics of the normalization pool size (black) for two monkeys, with data fitted with a difference of error functions. Superimposed is the dynamics of c50 averaged for a central region of interest (gray), with data fitted with a decaying exponential. Note that the spatio-temporal scales of C and D are identical although centered on different values.
Figure 4.
Figure 4.
Surround stimulus induces centripetal propagation. A–D, Spatio-temporal representations of VSDI activity as already illustrated in Figure 1B but now displayed in space–time plots after averaging pixels along the anteroposterior axis in response to 80% contrast stimulation for four stimuli: A, center (2° diameter); B, close surround (inner diameter adjacent to the central target contour 2°; outer diameter 4°); C, intermediate surround (inner diameter 4°, outer diameter 5.6°); D, far surround (inner diameter 5.6°; outer 6.9°). Superimposed dots represent response latency at each cortical position, fitted with two straight dotted lines (one orthogonal, one oblique) representing respectively regions within which responses latencies are the same or gradually increasing. Dashed gray lines indicate cortical position at which center and adjacent surround responses cross each other, indicating center stimulus border projection. E, Time course of the VSDI response for the four conditions presented in A–D averaged in a central region of interest (1 to 2 mm, red vertical bar in A). Vertical lines indicate latencies. F, Unified representation of the three spatio-temporal profiles of activity in B–D. Ordinate corresponds to the cortical distance from the inner border of the peripheral stimuli. Vertical blue lines on the right indicate ranges of the data from the three conditions. Contours delimit different levels of iso-activity. An alternate visual dimension scale is shown on the right-hand side.
Figure 5.
Figure 5.
Surround modulation of center response latency and amplitude at various contrasts. A, Time course of the VSDI response to all contrasts (from 0% to 80%) in response to center–surround configuration for three different surround distances to the outer border of the central stimulus (first column 0°; second column 1°; third column 1.8°) and for the center-only condition (fourth column, same as Fig. 2A). VSDI was averaged within the central region of interest (same as Fig. 2A). The dotted curve is the response to zero contrast in the center, hence peripheral-alone stimulus in center–surround conditions and no stimulus in the center-only condition. Vertical dotted lines are latencies of all responses. A shaded area is delimiting the time period for which a response to surround-only is observed. B, Response latency is plotted as a function of contrast for all conditions (color code shown in A), for center–surround (bluish squares), center-only (red square), and surround-only (bluish circles and horizontal dotted lines) conditions. Curve plots Naka–Rushton fits applied to the latency responses for center–surround and center conditions. Error bars are SEM. C, Time sequence of the contrast response functions observed in the four conditions: center (red), center with close, intermediate and far periphery (blue hue), averaged in a central region of interest (Fig. 4A, red bar). Data are fitted with the model presented in Equation 4, realigned according to the 0% center contrast condition. As indicated in the last time frame (t = 164 ms), we measured an RGI for each time frame, to quantify how much the response amplitude is suppressed by the surround, and a CGI, to quantify how much the operating range of the contrast response function is frozen by the surround (see Eq. 5).
Figure 6.
Figure 6.
Dynamics of surround influence on center contrast response function. We plot the dynamics of five parameters extracted from the Equation 4 fit, averaged in two different regions of interest [central (A) and more peripheral (B), see left-hand icons] and three surround positions (blue color-code). A1–B1, Dynamics of c50. A2–B2, Dynamics of CT. A3–B3, Dynamics of n. A4–B4, Dynamics of ACMR. A5–B5, Dynamics of the f(d). Arrows point at latency of responses to the three different surround-only stimuli.
Figure 7.
Figure 7.
Surround-induced propagation of normalization and suppression. Different components of the surround propagation controlling the central CoRF are shown along the unified metric introduced in Figure 4F. A, B, Propagation of response and contrast suppression: spatio-temporal maps of the RGI (see Fig. 5C) (A) and CGI (see Fig. 5C) (B). The dotted line indicates regression line best-fit to the iso-contour of significant levels of RGI and CGI. C, Net peripheral input propagation: spatio-temporal map of the integral of f(d). The dotted line indicates the regression line best fitted to the iso-contour of significant levels of peripheral input strength.
Figure 8.
Figure 8.
Intracortical circuits implementing local input normalization and surround suppression. A, Schematic drawing illustrating both stimulus and the divisive normalization recurrent circuits implementing local input integration (in red) and surround suppression (in blue). Red and blue arrows depict horizontal spread of activity at a constant speed, v, over various distances. The normalization pool implementing local divisive normalization is transiently fed by polysynaptic recurrent intracortical activity (red), whereas surround suppression feeds both the normalization pool and the direct input to the cell (blue). B, Schematic dynamics of the contrast response function for the three conditions tested here: the central stimulus alone (red); a center stimulus with a close surround (blue); or a far surround (cyan). At the second and third time frames, the presence of a surround clamps the CoRF at the state it has reached, whereas center-only stimuli CoRFs continue to evolve (red arrow). C, Recapitulation of the various speeds measured for both monkeys. Color-coded legend shown on the right.

References

    1. Albrecht DG, Hamilton DB. Striate cortex of monkey and cat: contrast response function. J Neurophysiol. 1982;48:217–237. - PubMed
    1. Albrecht DG, Geisler WS, Frazor RA, Crane AM. Visual cortex neurons of monkeys and cats: temporal dynamics of the contrast response function. J Neurophysiol. 2002;88:888–913. - PubMed
    1. Albus K. A quantitative study of the projection area of the central and the paracentral visual field in area 17 of the cat. I. The precision of the topography. Exp Brain Res. 1975;24:159–179. - PubMed
    1. Angelucci A, Levitt JB, Walton EJ, Hupe JM, Bullier J, Lund JS. Circuits for local and global signal integration in primary visual cortex. J Neurosci. 2002;22:8633–8646. - PMC - PubMed
    1. Arieli A, Grinvald A, Slovin H. Dural substitute for long-term imaging of cortical activity in behaving monkeys and its clinical implications. J Neurosci Methods. 2002;114:119–133. - PubMed

Publication types

LinkOut - more resources