

Weighted frequent gene co-expression network mining to identify genes involved in genome stability
- PMID: 22956898
- PMCID: PMC3431293
- DOI: 10.1371/journal.pcbi.1002656
Weighted frequent gene co-expression network mining to identify genes involved in genome stability
Abstract
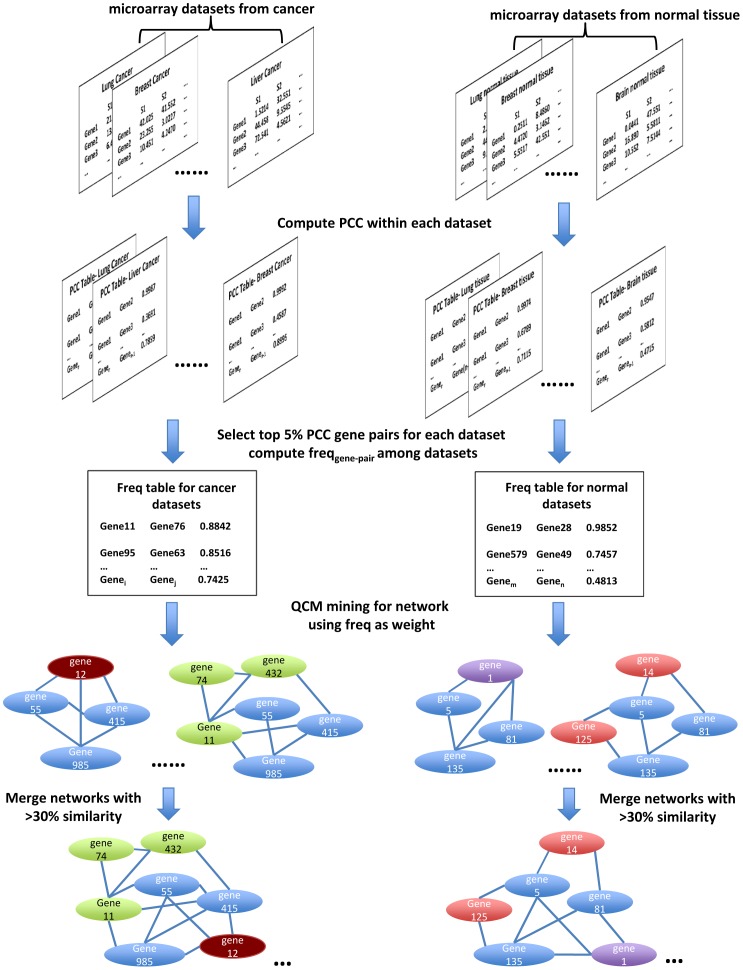
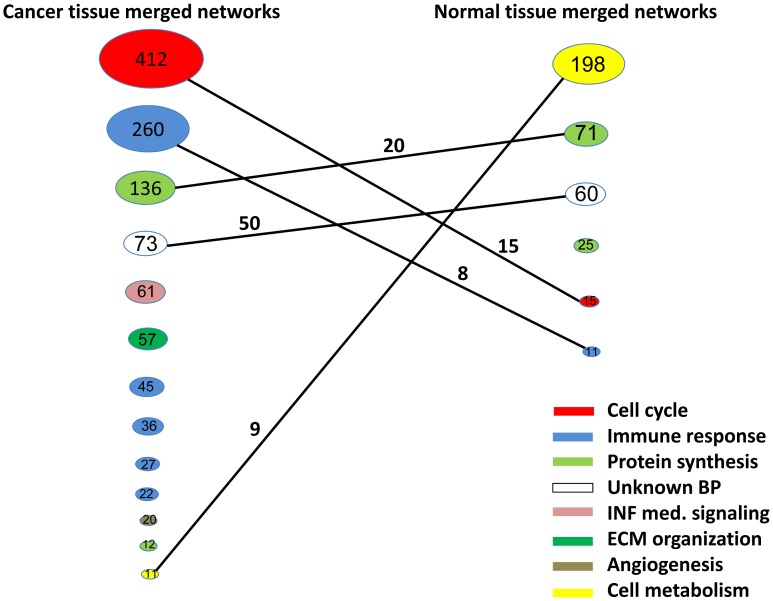
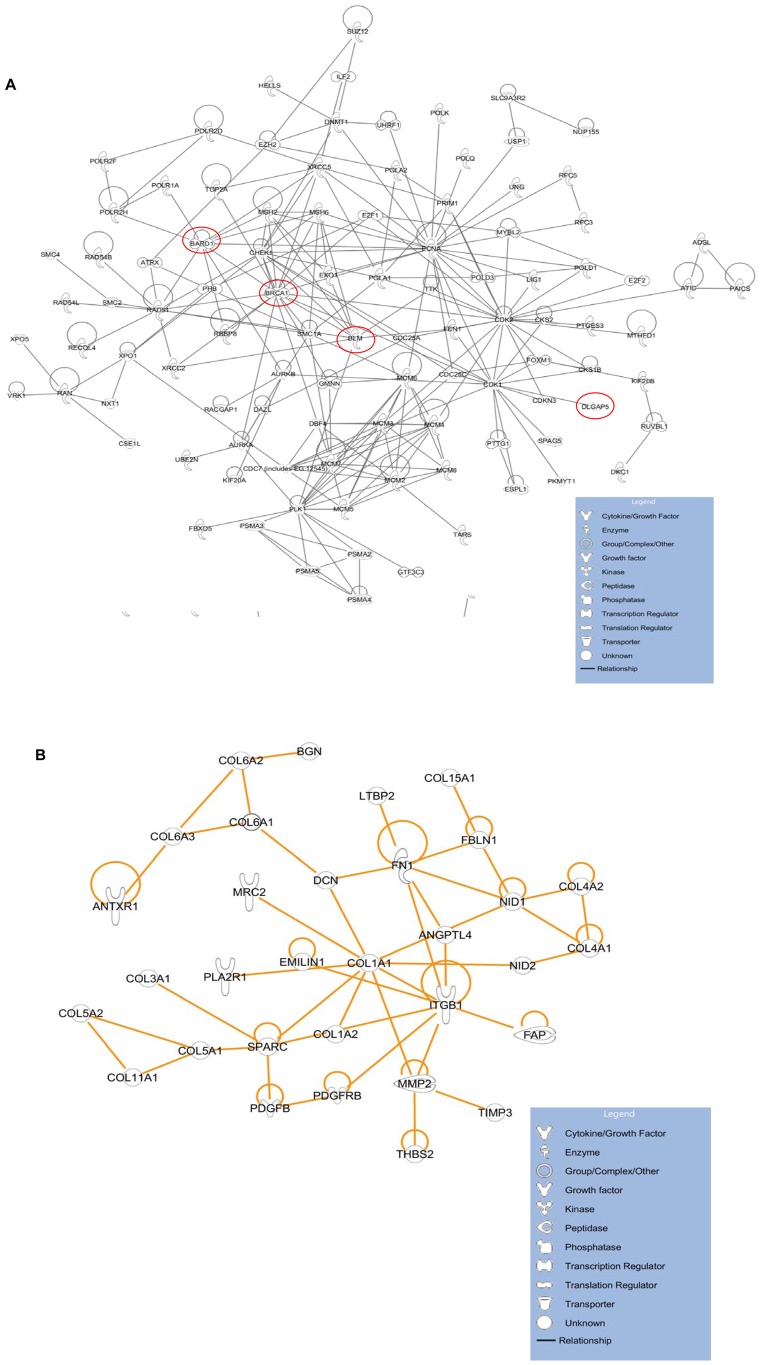
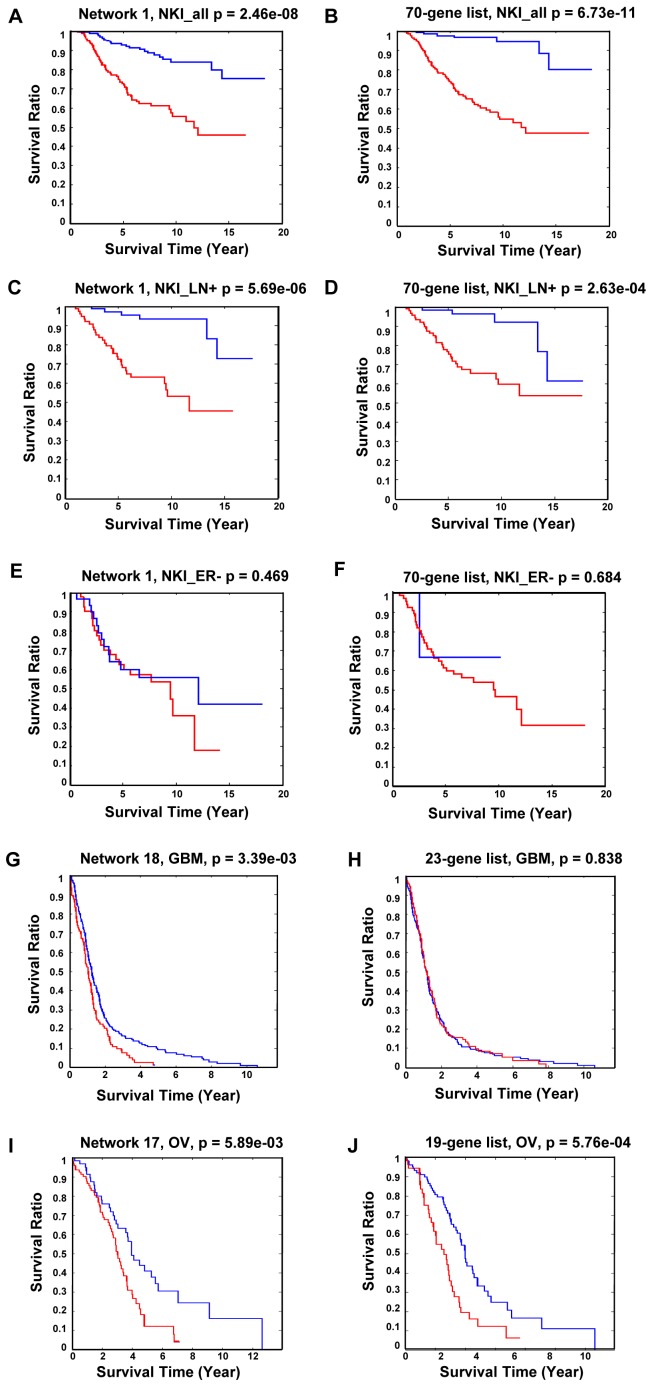
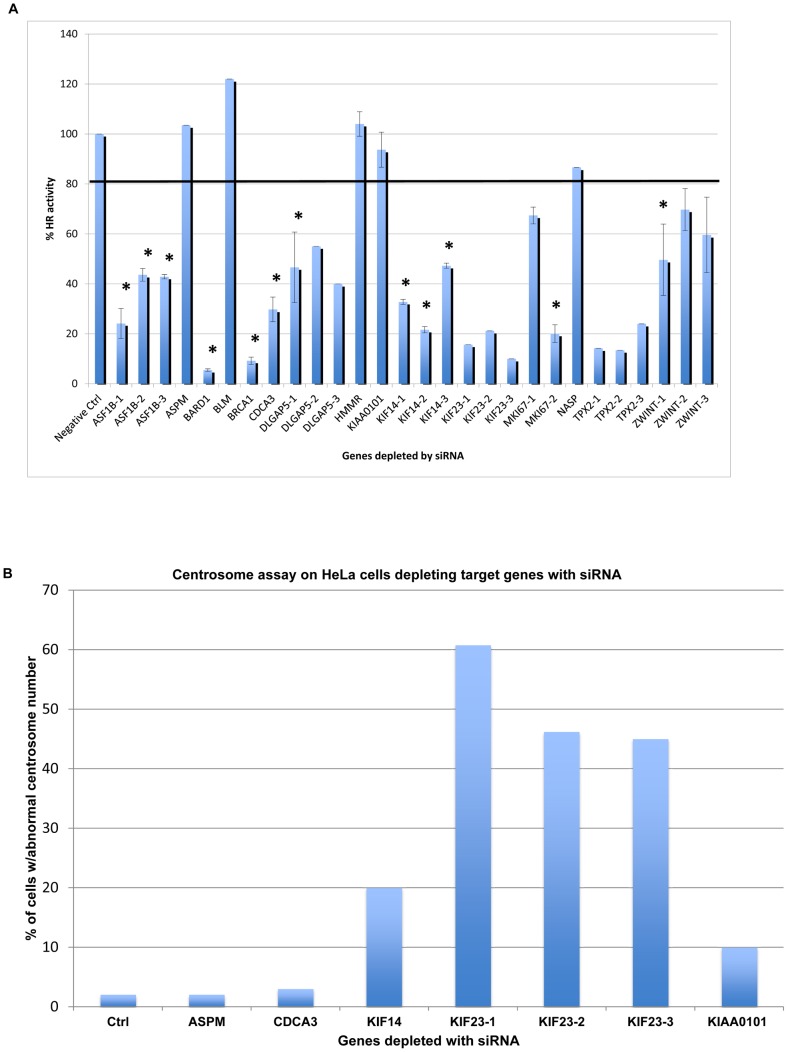
Gene co-expression network analysis is an effective method for predicting gene functions and disease biomarkers. However, few studies have systematically identified co-expressed genes involved in the molecular origin and development of various types of tumors. In this study, we used a network mining algorithm to identify tightly connected gene co-expression networks that are frequently present in microarray datasets from 33 types of cancer which were derived from 16 organs/tissues. We compared the results with networks found in multiple normal tissue types and discovered 18 tightly connected frequent networks in cancers, with highly enriched functions on cancer-related activities. Most networks identified also formed physically interacting networks. In contrast, only 6 networks were found in normal tissues, which were highly enriched for housekeeping functions. The largest cancer network contained many genes with genome stability maintenance functions. We tested 13 selected genes from this network for their involvement in genome maintenance using two cell-based assays. Among them, 10 were shown to be involved in either homology-directed DNA repair or centrosome duplication control including the well-known cancer marker MKI67. Our results suggest that the commonly recognized characteristics of cancers are supported by highly coordinated transcriptomic activities. This study also demonstrated that the co-expression network directed approach provides a powerful tool for understanding cancer physiology, predicting new gene functions, as well as providing new target candidates for cancer therapeutics.
Conflict of interest statement
The authors have declared that no competing interests exist.
Figures
Similar articles
-
Analysis of cis-Regulatory Elements in Gene Co-expression Networks in Cancer.Methods Mol Biol. 2017;1613:291-310. doi: 10.1007/978-1-4939-7027-8_11. Methods Mol Biol. 2017. PMID: 28849565
-
Analyzing miRNA co-expression networks to explore TF-miRNA regulation.BMC Bioinformatics. 2009 May 28;10:163. doi: 10.1186/1471-2105-10-163. BMC Bioinformatics. 2009. PMID: 19476620 Free PMC article.
-
Comprehensive network analysis of anther-expressed genes in rice by the combination of 33 laser microdissection and 143 spatiotemporal microarrays.PLoS One. 2011;6(10):e26162. doi: 10.1371/journal.pone.0026162. Epub 2011 Oct 26. PLoS One. 2011. PMID: 22046259 Free PMC article.
-
Condition-specific gene co-expression network mining identifies key pathways and regulators in the brain tissue of Alzheimer's disease patients.BMC Med Genomics. 2018 Dec 31;11(Suppl 6):115. doi: 10.1186/s12920-018-0431-1. BMC Med Genomics. 2018. PMID: 30598117 Free PMC article.
-
A novel parametric approach to mine gene regulatory relationship from microarray datasets.BMC Bioinformatics. 2010 Dec 14;11 Suppl 11(Suppl 11):S15. doi: 10.1186/1471-2105-11-S11-S15. BMC Bioinformatics. 2010. PMID: 21172050 Free PMC article.
Cited by
-
Generalized gene co-expression analysis via subspace clustering using low-rank representation.BMC Bioinformatics. 2019 May 1;20(Suppl 7):196. doi: 10.1186/s12859-019-2733-5. BMC Bioinformatics. 2019. PMID: 31074376 Free PMC article.
-
iGPSe: a visual analytic system for integrative genomic based cancer patient stratification.BMC Bioinformatics. 2014 Jul 10;15:203. doi: 10.1186/1471-2105-15-203. BMC Bioinformatics. 2014. PMID: 25000928 Free PMC article.
-
Differential expression of inflammasomes in lung cancer cell lines and tissues.Tumour Biol. 2015 Sep;36(10):7501-13. doi: 10.1007/s13277-015-3473-4. Epub 2015 Apr 25. Tumour Biol. 2015. PMID: 25910707
-
Genetic co-expression networks contribute to creating predictive model and exploring novel biomarkers for the prognosis of breast cancer.Sci Rep. 2021 Mar 31;11(1):7268. doi: 10.1038/s41598-021-84995-z. Sci Rep. 2021. PMID: 33790307 Free PMC article.
-
Computational systems biology in disease modeling and control, review and perspectives.NPJ Syst Biol Appl. 2022 Oct 3;8(1):37. doi: 10.1038/s41540-022-00247-4. NPJ Syst Biol Appl. 2022. PMID: 36192551 Free PMC article. Review.
References
-
- Van 't Veer LJ, Dai H, van de Vijver MJ, He YD, Hart AA, et al. (2002) Gene expression profiling predicts clinical outcome of breast cancer. Nature 415: 530–536. - PubMed
-
- Van de Vijver MJ, He YD, van't Veer LJ, Dai H, Hart AA, et al. (2002) A gene-expression signature as a predictor of survival in breast cancer. N Engl J Med 347: 1999–2009. - PubMed
-
- Buyse M, Loi S, van't Veer L, Viale G, Delorenzi M, et al. (2006) Validation and clinical utility of a 70-gene prognostic signature for women with node-negative breast cancer. J Natl Cancer Inst 98: 1183–1192. - PubMed
-
- Hu H, Yan X, Huang Y, Han J, Zhou XJ (2005) Mining coherent dense subgraphs across massive biological networks for functional discovery. Bioinformatics 21 Suppl 1: i213–221. - PubMed
-
- Pujana MA, Han JD, Starita LM, Stevens KN, Tewari M, et al. (2007) Network modeling links breast cancer susceptibility and centrosome dysfunction. Nat Genet 39: 1338–1349. - PubMed
Publication types
MeSH terms
Grants and funding
LinkOut - more resources
Full Text Sources
Other Literature Sources
