

Interplay of gene expression noise and ultrasensitive dynamics affects bacterial operon organization
- PMID: 22956903
- PMCID: PMC3431296
- DOI: 10.1371/journal.pcbi.1002672
Interplay of gene expression noise and ultrasensitive dynamics affects bacterial operon organization
Abstract
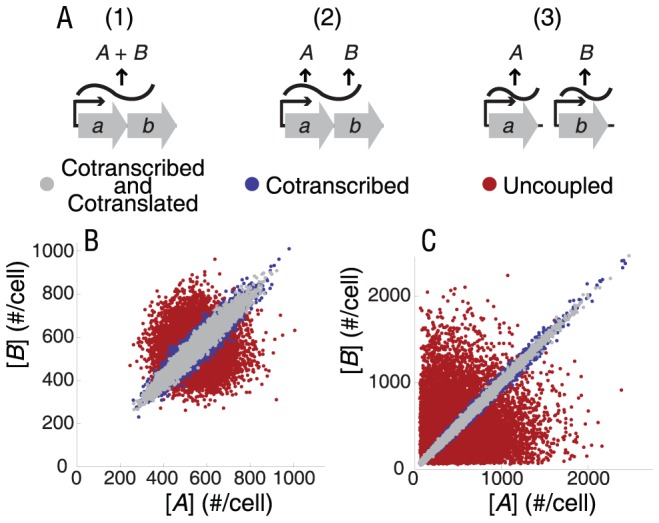
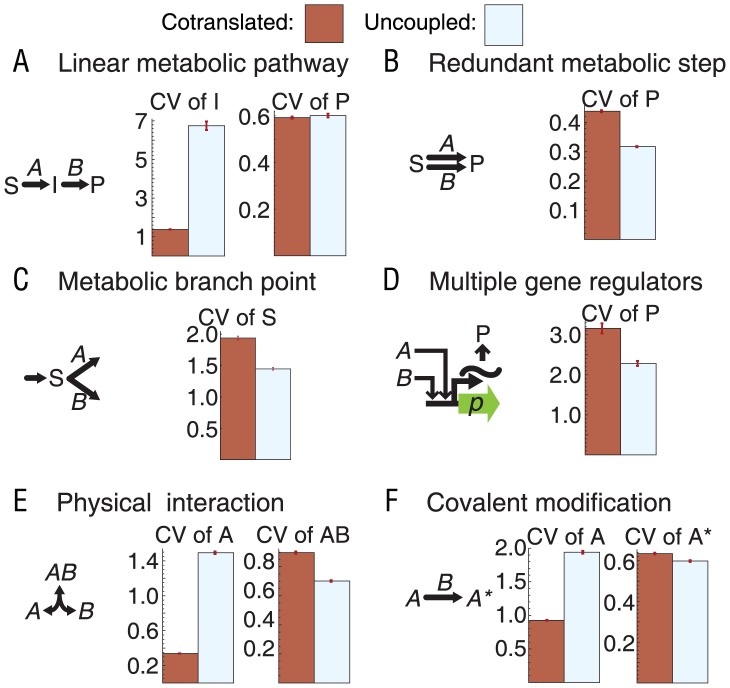
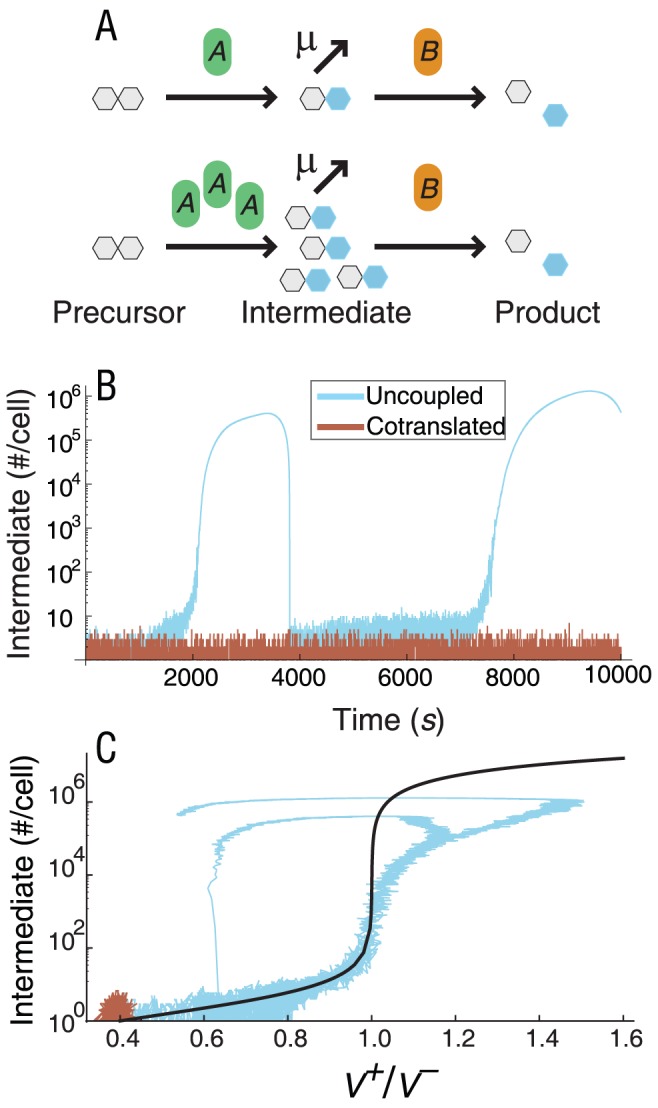
Bacterial chromosomes are organized into polycistronic cotranscribed operons, but the evolutionary pressures maintaining them are unclear. We hypothesized that operons alter gene expression noise characteristics, resulting in selection for or against maintaining operons depending on network architecture. Mathematical models for 6 functional classes of network modules showed that three classes exhibited decreased noise and 3 exhibited increased noise with same-operon cotranscription of interacting proteins. Noise reduction was often associated with a decreased chance of reaching an ultrasensitive threshold. Stochastic simulations of the lac operon demonstrated that the predicted effects of transcriptional coupling hold for a complex network module. We employed bioinformatic analysis to find overrepresentation of noise-minimizing operon organization compared with randomized controls. Among constitutively expressed physically interacting protein pairs, higher coupling frequencies appeared at lower expression levels, where noise effects are expected to be dominant. Our results thereby suggest an important role for gene expression noise, in many cases interacting with an ultrasensitive switch, in maintaining or selecting for operons in bacterial chromosomes.
Conflict of interest statement
The authors have declared that no competing interests exist.
Figures


Similar articles
-
Strategy of tuning gene expression ratio in prokaryotic cell from perspective of noise and correlation.J Theor Biol. 2015 Jan 21;365:377-89. doi: 10.1016/j.jtbi.2014.11.002. Epub 2014 Nov 11. J Theor Biol. 2015. PMID: 25446713
-
Stochasticity in protein levels drives colinearity of gene order in metabolic operons of Escherichia coli.PLoS Biol. 2009 May 12;7(5):e1000115. doi: 10.1371/journal.pbio.1000115. Epub 2009 May 26. PLoS Biol. 2009. PMID: 19492041 Free PMC article.
-
Functional Operons in Secondary Metabolic Gene Clusters in Glarea lozoyensis (Fungi, Ascomycota, Leotiomycetes).mBio. 2015 Jun 16;6(3):e00703. doi: 10.1128/mBio.00703-15. mBio. 2015. PMID: 26081635 Free PMC article.
-
Ancient origin of the tryptophan operon and the dynamics of evolutionary change.Microbiol Mol Biol Rev. 2003 Sep;67(3):303-42, table of contents. doi: 10.1128/MMBR.67.3.303-342.2003. Microbiol Mol Biol Rev. 2003. PMID: 12966138 Free PMC article. Review.
-
Transperons: RNA operons as effectors of coordinated gene expression in eukaryotes.Trends Genet. 2022 Dec;38(12):1217-1227. doi: 10.1016/j.tig.2022.07.005. Epub 2022 Aug 4. Trends Genet. 2022. PMID: 35934590 Review.
Cited by
-
A survey of HK, HPt, and RR domains and their organization in two-component systems and phosphorelay proteins of organisms with fully sequenced genomes.PeerJ. 2015 Aug 13;3:e1183. doi: 10.7717/peerj.1183. eCollection 2015. PeerJ. 2015. PMID: 26339559 Free PMC article.
-
Cross-evaluation of E. coli's operon structures via a whole-cell model suggests alternative cellular benefits for low- versus high-expressing operons.Cell Syst. 2024 Mar 20;15(3):227-245.e7. doi: 10.1016/j.cels.2024.02.002. Epub 2024 Feb 27. Cell Syst. 2024. PMID: 38417437 Free PMC article.
-
Antibiotic-induced population fluctuations and stochastic clearance of bacteria.Elife. 2018 Mar 6;7:e32976. doi: 10.7554/eLife.32976. Elife. 2018. PMID: 29508699 Free PMC article.
-
Dynamical predictors of an imminent phenotypic switch in bacteria.Phys Biol. 2017 Jun 29;14(4):045007. doi: 10.1088/1478-3975/aa7870. Phys Biol. 2017. PMID: 28597843 Free PMC article.
-
Maximization of information transmission influences selection of native phosphorelay architectures.PeerJ. 2021 Jun 10;9:e11558. doi: 10.7717/peerj.11558. eCollection 2021. PeerJ. 2021. PMID: 34178454 Free PMC article.
References
-
- Jacob F, Monod J (1961) Genetic regulatory mechanisms in the synthesis of proteins. J Mol Biol 3: 318–356. - PubMed
-
- Blumenthal T, Evans D, Link CD, Guffanti A, Lawson D, et al. (2002) A global analysis of Caenorhabditis elegans operons. Nature 417: 851–854. - PubMed
-
- Rocha EP (2008) The organization of the bacterial genome. Annu Rev Genet 42: 211–233. - PubMed
Publication types
MeSH terms
Grants and funding
LinkOut - more resources
Full Text Sources
