

Protective Effects of Green Tea Extract against Hepatic Tissue Injury in Streptozotocin-Induced Diabetic Rats
- PMID: 22956978
- PMCID: PMC3432555
- DOI: 10.1155/2012/740671
Protective Effects of Green Tea Extract against Hepatic Tissue Injury in Streptozotocin-Induced Diabetic Rats
Abstract
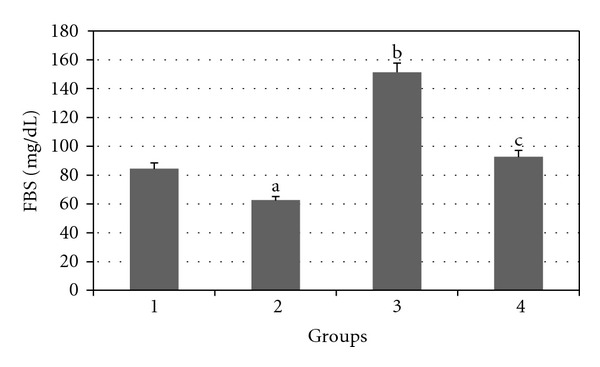
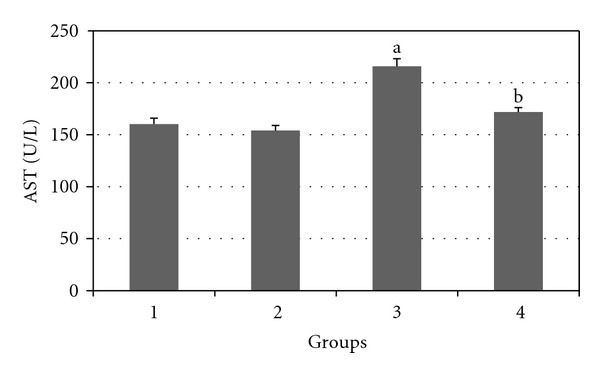
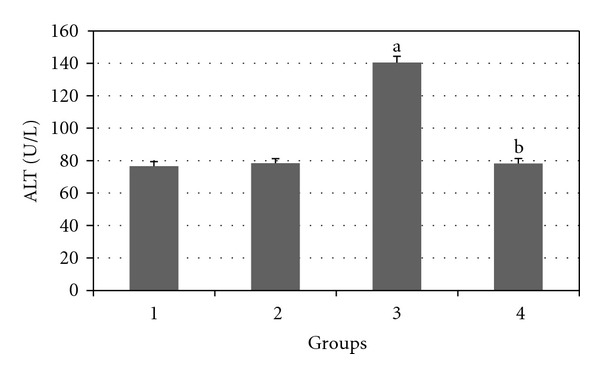
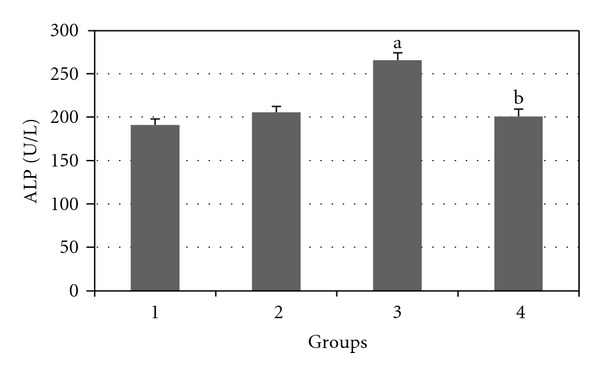
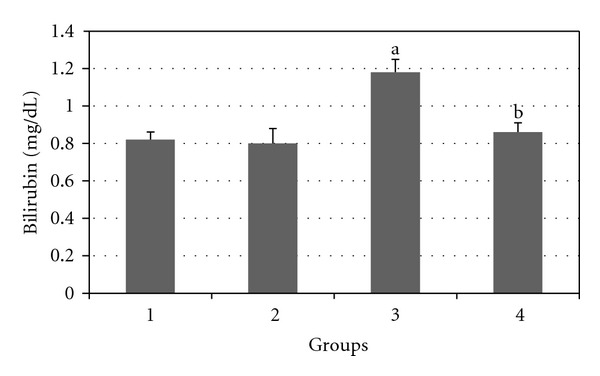
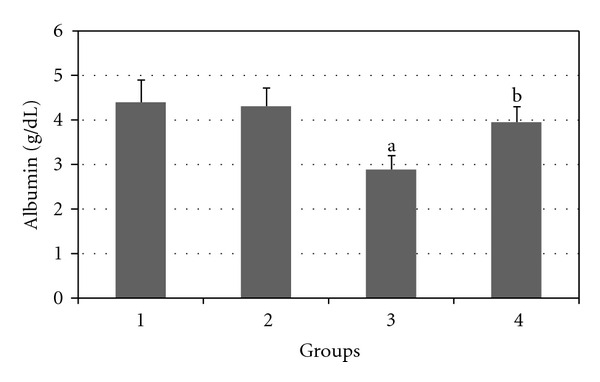
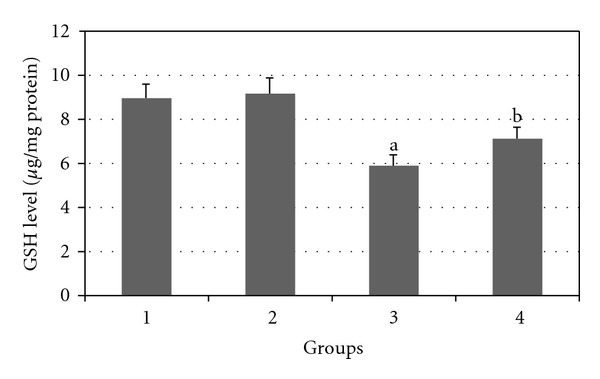
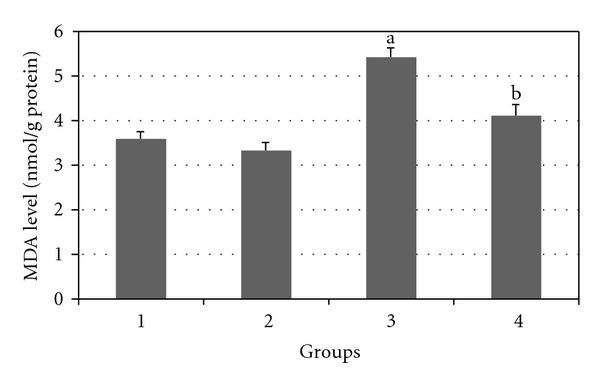
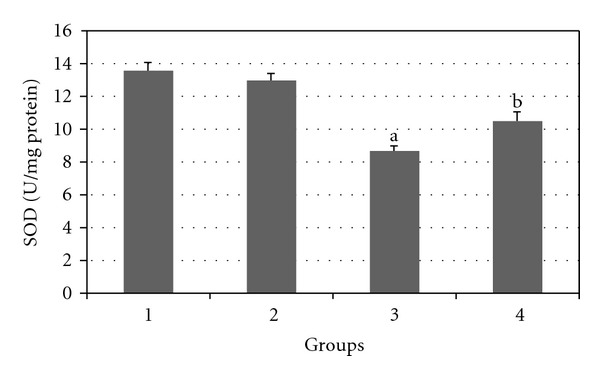
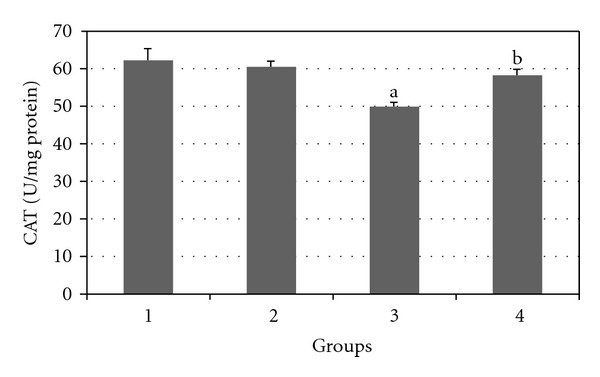
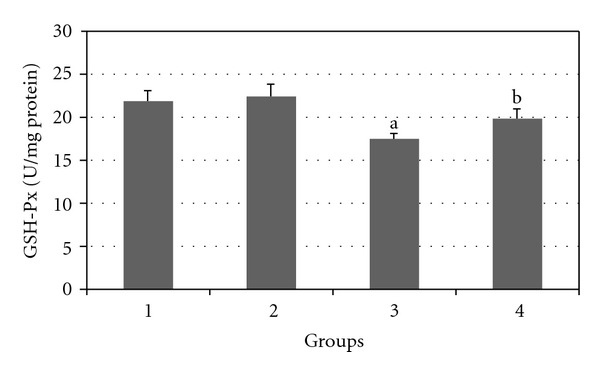
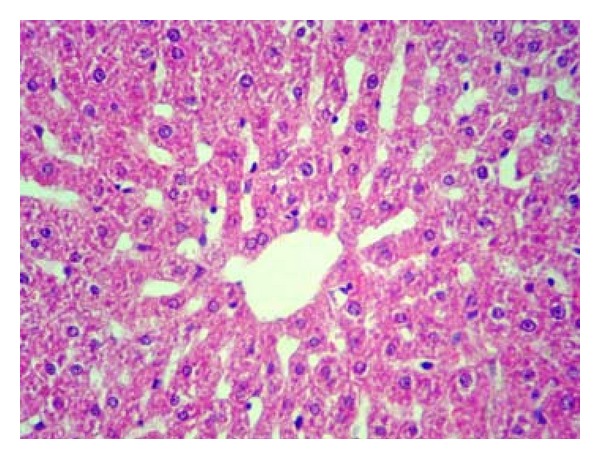
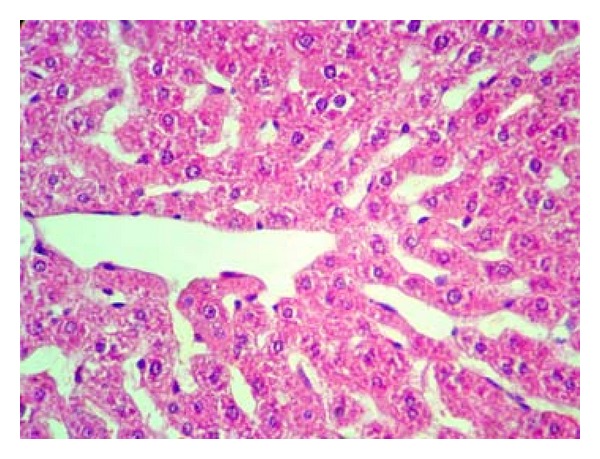
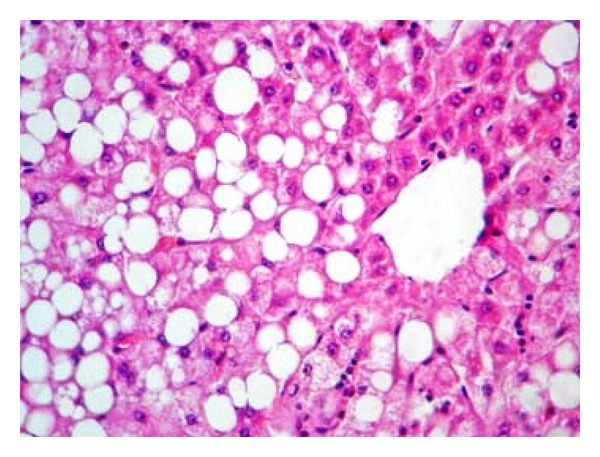
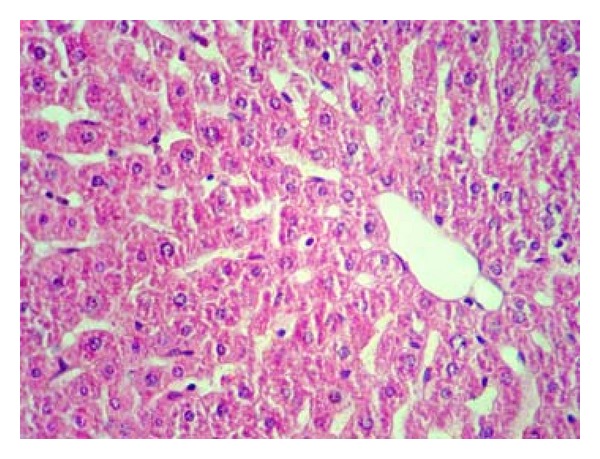
Although diabetic hepatopathy is potentially less common, it may be appropriate for addition to the list of target organ conditions related to diabetes. This study was designed to evaluate the hepatoprotective properties of green tea extract (GTE) in STZ-induced diabetes in rats. Wistar rats were made diabetic through single injection of STZ (75 mg/kg i.p.). The rats were randomly divided into four groups of 10 animals each: Group 1, healthy control; Group 2, nondiabetics treated with GTE administered orally (1.5%, w/v); Group 3, diabetics; Group 4, diabetics treated with GTE (1.5%, w/v) for 8 weeks. Serum biomarkers were assessed to determine hepatic injury. Malondialdehyde (MDA) and reduced glutathione (GSH) contents were measured to assess free radical activity in the liver tissue. Hepatic antioxidant activities of glutathione peroxidase (GSH-Px), superoxide dismutase (SOD), and catalase (CAT) were also determined. The biochemical findings were matched with histopathological verifications. Liver MDA content and serum levels of ALT, AST, ALP, and bilirubin in Group 3 significantly increased compared to Group 1 (P < 0.05) and significantly decreased in Group 4 compared to Group 3 (P < 0.05). Serum albumin level and GSH, SOD, CAT, and GSH-Px contents of the liver in Group 3 were significantly decreased compared to Group 1 (P < 0.05) and were significantly increased in Group 4 compared to Group 3 (P < 0.05). Histopathologically, the changes were in the same direction with biochemical findings. This study proved the hepatoprotective activity of GTE in experimentally induced diabetic rats.
Figures
References
-
- Ritz E, Hasslacher C, Tschope W. Diabetic nephropathy—are there differences between type I and type II? Mineral and Electrolyte Metabolism. 1990;16(1):69–72. - PubMed
-
- Hendriksen PH, Oey PL, Wieneke GH, Bravenboer B, Banga JD. Subclinical diabetic neuropathy: similarities between electrophysiological results of patients with Type 1 (insulin-dependent) and Type 2 (non-insulin-dependent) diabetes mellitus. Diabetologia. 1992;35(7):690–695. - PubMed
-
- de Marco R, Locatelli F, Zoppini G, Verlato G, Bonora E, Muggeo M. Cause-specific mortality in type 2 diabetes: the verona diabetes study. Diabetes Care. 1999;22(5):756–761. - PubMed
-
- Tolman KG, Fonseca V, Dalpiaz A, Tan MH. Spectrum of liver disease in type 2 diabetes and management of patients with diabetes and liver disease. Diabetes Care. 2007;30(3):734–743. - PubMed
-
- Athyros VG, Mikhailidis DP, Didangelos TP, et al. Effect of multifactorial treatment on non-alcoholic fatty liver disease in metabolic syndrome: a randomised study. Current Medical Research and Opinion. 2006;22(5):873–883. - PubMed
LinkOut - more resources
Full Text Sources
Miscellaneous
