. 2012;7(9):e41212.
doi: 10.1371/journal.pone.0041212. Epub 2012 Sep 5.

Universal access to HIV treatment versus universal 'test and treat': transmission, drug resistance & treatment costs

Affiliations

Universal access to HIV treatment versus universal 'test and treat': transmission, drug resistance & treatment costs

Bradley G Wagner et al. PLoS One. 2012.

Abstract

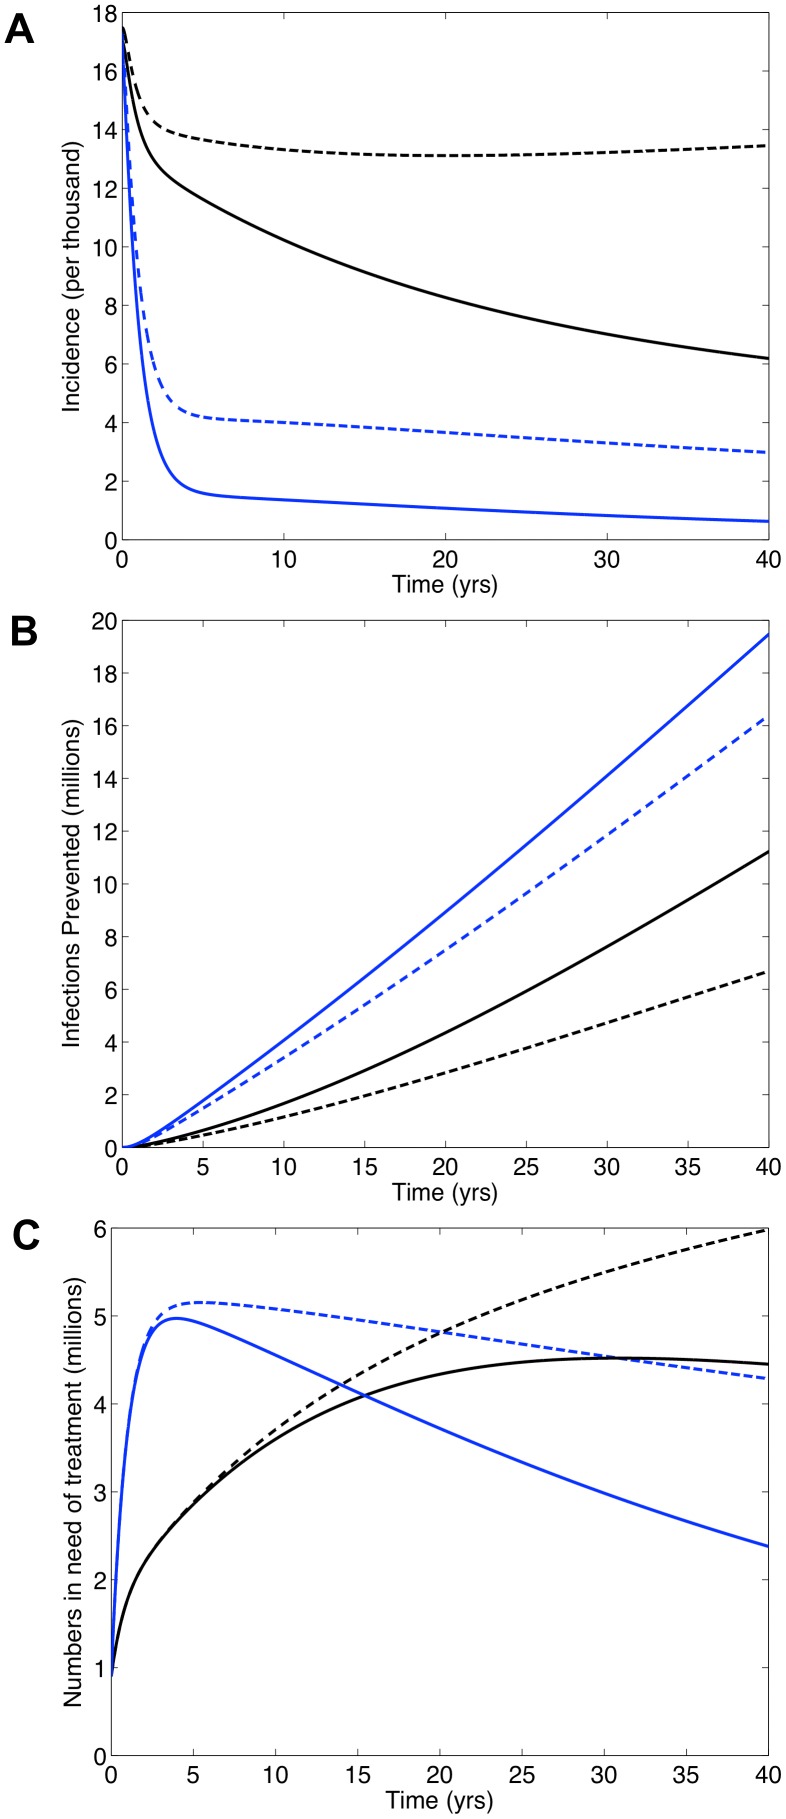
In South Africa (SA) universal access to treatment for HIV-infected individuals in need has yet to be achieved. Currently ~1 million receive treatment, but an additional 1.6 million are in need. It is being debated whether to use a universal 'test and treat' (T&T) strategy to try to eliminate HIV in SA; treatment reduces infectivity and hence transmission. Under a T&T strategy all HIV-infected individuals would receive treatment whether in need or not. This would require treating 5 million individuals almost immediately and providing treatment for several decades. We use a validated mathematical model to predict impact and costs of: (i) a universal T&T strategy and (ii) achieving universal access to treatment. Using modeling the WHO has predicted a universal T&T strategy in SA would eliminate HIV within a decade, and (after 40 years) cost ~$10 billion less than achieving universal access. In contrast, we predict a universal T&T strategy in SA could eliminate HIV, but take 40 years and cost ~$12 billion more than achieving universal access. We determine the difference in predictions is because the WHO has under-estimated survival time on treatment and ignored the risk of resistance. We predict, after 20 years, ~2 million individuals would need second-line regimens if a universal T&T strategy is implemented versus ~1.5 million if universal access is achieved. Costs need to be realistically estimated and multiple evaluation criteria used to compare 'treatment as prevention' with other prevention strategies. Before implementing a universal T&T strategy, which may not be sustainable, we recommend striving to achieve universal access to treatment as quickly as possible. We predict achieving universal access to treatment would be a very effective 'treatment as prevention' approach and bring the HIV epidemic in SA close to elimination, preventing ~4 million infections after 20 years and ~11 million after 40 years.


Conflict of interest statement

Competing Interests: The authors have declared that no competing interests exist.

Figures

Figure 1
Figure 1. Dependence of the Control Reproduction Number (Rc) on the average population-level testing frequency for HIV (in terms of years between tests) and the treatment initiation threshold in terms of the CD4 cells/µL.
The dotted black line represents the threshold Rc = 1; below this threshold (i.e., Rc<1) elimination is (theoretically) possible. Panels represent the average treatment-induced reduction in infectivity at the population level: (A) 96% (B) 90% (C) 85%.
Figure 2
Figure 2. Predictions for South Africa generated from our transmission model if universal access to treatment is achieved (black curves) or a universal T&T (with annual testing) strategy (blue curves) is implemented.
The dynamics of acquired and transmitted drug resistance are not included in these simulations. Solid lines denote the case where the treatment-induced reduction in infectivity is 96% and dashed lines denote the case where the reduction is 85%. Panels show (A) annual incidence over time, (B) number of infections prevented over time and (C) number of individuals in need of treatment over time.
Figure 3
Figure 3. Comparison of the universal ‘test and treat’ (T&T) strategy (blue curves) and achieving universal access to treatment (black curves) in terms of discounted treatment costs.
Costs are discounted by 3.5% annually, following Granich et al. . The dynamics of acquired and transmitted drug resistance are not included in these simulations. Solid lines denote the case where the treatment-induced reduction in infectivity is 96% and dashed lines denote the case where the reduction is 85%. Panels show (A) discounted annual treatment costs over time and (B) discounted cumulative treatment costs over time. The dynamics of acquired and transmitted drug resistance are not included in these simulations.
Figure 4
Figure 4. Predictions for South Africa from our transmission model if universal access to treatment is achieved or a universal T&T (with annual testing) strategy is implemented.
Dynamics of acquired and transmitted drug resistance are included in these simulations. To generate this figure we assumed a treatment-induced reduction in infectivity of 85%, acquired drug resistance develops in treated individuals at a rate of 3% per year and drug-resistant strains are 50% as transmissible as wild-type strains. Panel (A) shows annual incidence over time. The blue curve shows wild-type incidence if the T&T strategy is implemented; black curve shows wild-type incidence if universal access to treatment is achieved. The red dashed curve shows the maximum incidence of transmitted drug resistance if either universal access is achieved or the T&T strategy is implemented. Panel (B) shows the number of infections prevented over time for the T&T strategy (blue curve) and if universal access to treatment (black curve) is achieved. Panel (C) shows the number of individuals in need of treatment over time. Blue and red curves represent the T&T strategy; the blue curve shows the number of individuals in need of first-line regimens, the solid red curve shows the number in need of second-line regimens. Black and orange curves represent achieving universal access to treatment; the black curve shows the number in need of first-line regimens, the orange curve shows the number in need of second-line regimens.
Figure 5
Figure 5. Comparison of the costs of the universal ‘test and treat’ (T&T) strategy (blue curve) and achieving universal access to treatment (black curve) in terms of discounted treatment costs.
Costs are discounted by 3.5% annually, following Granich et al. . Dynamics of acquired and transmitted drug resistance are included in these simulations. To generate this Figure we assumed a treatment-induced reduction in infectivity of 85%, acquired drug resistance develops in treated individuals at a rate of 3% per year and drug-resistant strains are 50% as transmissible as wild-type strains. Panel (A) shows discounted annual treatment costs over time and (B) shows discounted cumulative treatment costs over time. Treatment costs include the costs for both first-line and second-line regimens.

References

    1. Cohen MS, Mastro TD, Cates W (2009) Universal voluntary HIV testing and immediate antiretroviral therapy. Lancet 373: 1077 author reply 1080–1071. - PubMed
    1. Dieffenbach CW, Fauci AS (2009) Universal voluntary testing and treatment for prevention of HIV transmission. JAMA 301: 2380–2382. - PubMed
    1. El-Sadr WM, Affrunti M, Gamble T, Zerbe A (2010) Antiretroviral therapy: a promising HIV prevention strategy? J Acquir Immune Defic Syndr 55 Suppl 2: S116–121. - PMC - PubMed
    1. Garnett GP, Baggaley RF (2009) Treating our way out of the HIV pandemic: could we, would we, should we? Lancet 373: 9–11. - PubMed
    1. Granich RM, Gilks CF, Dye C, De Cock KM, Williams BG (2009) Universal voluntary HIV testing with immediate antiretroviral therapy as a strategy for elimination of HIV transmission: a mathematical model. Lancet 373: 48–57. - PubMed

Publication types