Meta-Analysis
. 2012;7(9):e44274.
doi: 10.1371/journal.pone.0044274. Epub 2012 Sep 5.

Meta-analysis derived (MAD) transcriptome of psoriasis defines the "core" pathogenesis of disease

Affiliations
Meta-Analysis

Meta-analysis derived (MAD) transcriptome of psoriasis defines the "core" pathogenesis of disease

Suyan Tian et al. PLoS One. 2012.

Abstract

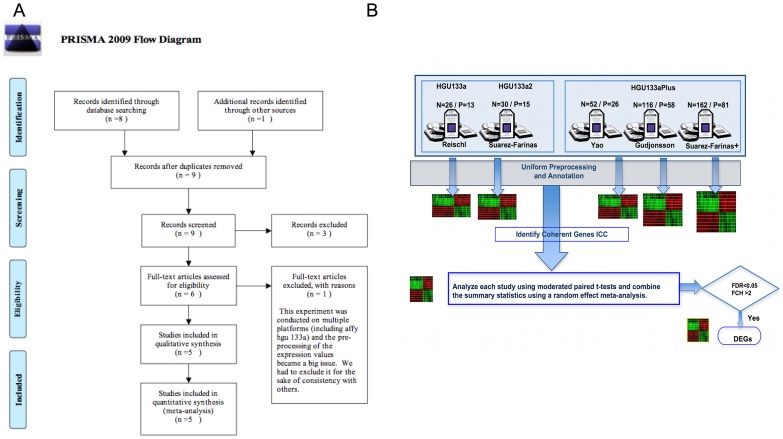
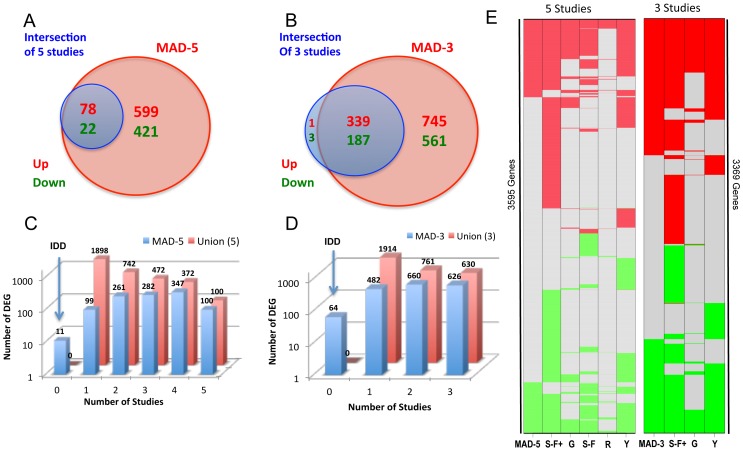
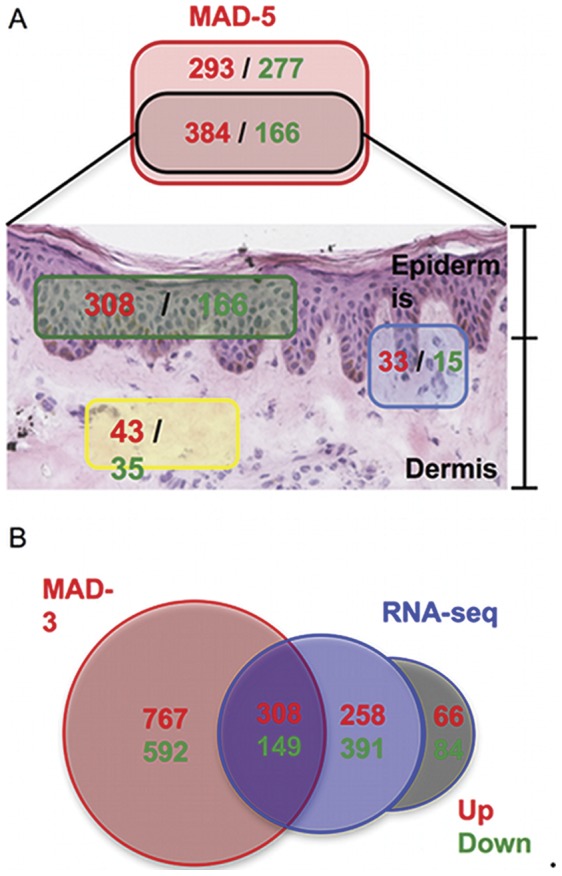
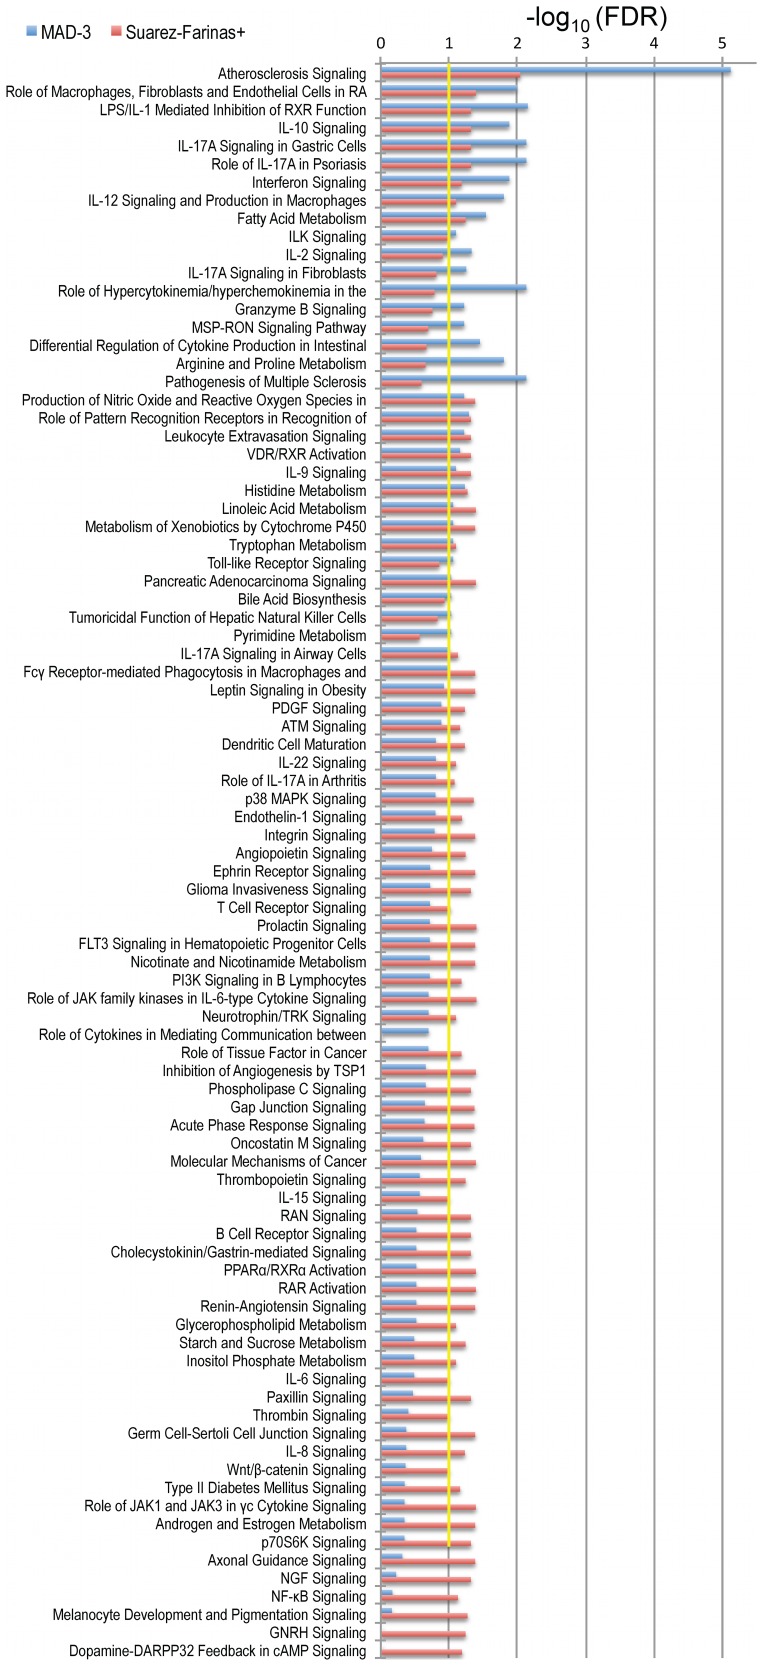
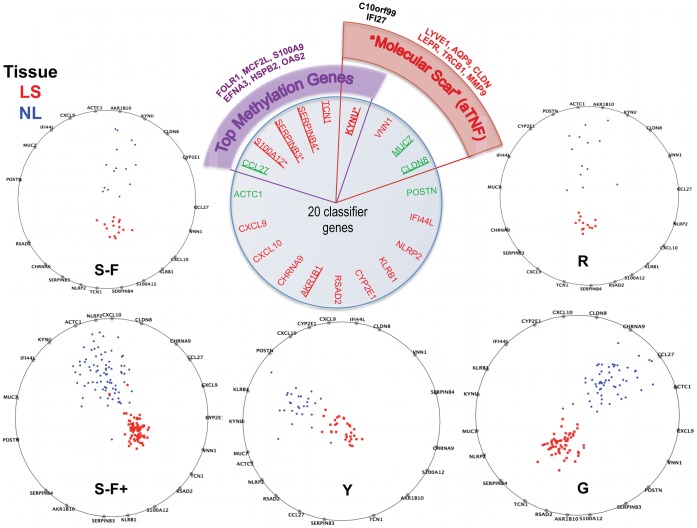
The cause of psoriasis, a common chronic inflammatory skin disease, is not fully understood. Microarray experiments have been widely used in recent years to identify genes associated with psoriasis pathology, by comparing expression levels of lesional (LS) with adjacent non-lesional (NL) skin. It is commonly observed that the differentially expressed genes (DEGs) differ greatly across experiments, due to variations introduced in the microarray experiment pipeline. Therefore, a statistically based meta-analytic approach, which combines the results of individual studies, is warranted. In this study, a meta-analysis was conducted on 5 microarray data sets, including 193 LS and NL pairs. We termed this the Meta-Analysis Derived (MAD) transcriptome. In "MAD-5" transcriptome, 677 genes were up-regulated and 443 were down-regulated in LS skin compared to NL skin. This represents a much larger set than the intersection of DEGs of these 5 studies, which consisted of 100 DEGs. We also analyzed 3 of the studies conducted on the Affymetrix hgu133plus2 chips and found a greater number of DEGs (1084 up- and 748 down-regulated). Top canonical pathways over-represented in the MAD transcriptome include Atherosclerosis Signaling and Fatty Acid Metabolism, while several "new" genes identified are involved in Cardiovascular Development and Lipid Metabolism. These findings highlight the relationship between psoriasis and systemic manifestations such as the metabolic syndrome and cardiovascular disease. Then, the Meta Threshold Gradient Descent Regularization (MTGDR) algorithm was used to select potential markers distinguishing LS and NL skin. The resulting set (20 genes) contained many genes that were part of the residual disease genomic profile (RDGP) or "molecular scar" after successful treatment, and also genes subject to differential methylation in LS tissues. To conclude, this MAD transcriptome yielded a reference list of reliable psoriasis DEGs, and represents a robust pool of candidates for further discovery of pathogenesis and treatment evaluation.


Conflict of interest statement

Competing Interests: Two coauthors are employed by a commercial company “Janssen Research & Development”. They participated in the manuscript writing, revision and review. There are no other declarations relating to employment, consultancy, patents, products in development or marketed products. This does not alter the authors’ adherence to all the PLoS ONE policies on sharing data and materials.

Figures

Figure 1
Figure 1. PRIMA diagram and study schema.
A. PRIMA (Preferred Reporting Items for Systematic Reviews and Meta-Analyses) diagram. B. Schema describing the steps taken during the meta-analysis. N and P represent the number of samples (N) and patients (P) respectively in each study.
Figure 2
Figure 2. Overview of the MAD-5 and MAD-3 transcriptomes.
A. Venn diagram showing that when comparing the MAD-5 transcriptome with the intersection of DEGs identified by individual studies, the meta-analysis always identified a much larger set. B. Venn diagram showing the same comparison as A but for MAD-3 transcriptome. C. 3D Barplots showing the overlap of MAD-5 genes (blue bars) by the number of individual studies (x-axis). For example: among the MAD-5 transcriptome, 347 genes were identified by 4 studies and 100 by all 5 studies. For comparison the numbers for the set of genes that were identified by any of the individual studies (Union) is also represented (red bars). Most DEGs from the meta-analysis appeared in at least two of these studies. Integration Discovery Genes (IDD) represents the set of genes only identified by the meta-analysis. D. 3D Barplots showing the same comparison as C for MAD-3. E. Color-coded graphs showing the comparison of MADs transcriptomes and individual studies. Each row represents a gene and the color indicates whether the gene is up-regulated (red), down-regulated (green) or not differentially expressed (gray) in each (columns) and the meta-analysis. Meta: meta-analysis; S-F+: Suarez-Farinas 2012, hgu33plus2 chips; G: Gudjonsson’2009; S-F: Suarez-Farinas’2010; R: Reischl’2007; Y: Yao’2008.
Figure 3
Figure 3. Comparison with other transcriptomes.
A. Cutaneous localization of MAD-5 transcriptome. 49% of MAD-5 genes (black rectangle) were identified as being part of the Epidermis (green rectangle) or Dermis (yellow rectangle) psoriasis transcriptome defined by the use of laser capture micro-dissection (LCM) techniques (using the same cutoffs FDR<0.05 and FCH>2). Genes identified in both Epidermis and Dermis transcriptomes are in the blue rectangle. B. Venn-Diagram showing the intersection between the MAD-3 psoriasis transcriptome and RNA-seq pilot experiment (using the same cutoffs FDR<0.05 and FCH>2). Numbers are colored in red and green to represent up-regulated or down-regulated genes respectively. The gray zone represents genes identified by RNA-seq but that were not physically present in the hgu133plus2 chips.
Figure 4
Figure 4. Ingenuity Pathway Analysis.
Comparison of canonical pathways overrepresented in MAD-3 transcriptome (blue bars) and Suarez-Farinas+ (red bars), which is the study with the largest sample size and number of DEG. Bars represents a –log10 transformation of the Benjamini-Hochberg adjusted p-value, which controls FDR. Only pathways with FDR<0.1 (which corresponds to 1 in the –log10 scale; represented by yellow line) in either MAD-3 or Suarez-Farinas+ are shown.
Figure 5
Figure 5. MAD classifier.
Radviz plots showing how the 20 genes selected by MTGDR procedure separate the lesional (LS) and non-lesional (NL) samples apart in each study. Perfect separation between LS and NL samples can be seen in every study. S-F+: Suarez-Farinas 2012, hgu33plus2 chips; G: Gudhjonsson’2009; S-F: Suarez-Farinas’2010; R: Reischl’2007; Y: Yao’2008. Center insert shows biological relevance of these genes. Top 25 psoriasis genes in Table 1 are underline. 6 of these 20 genes have been identified as top methylation genes discriminating between psoriasis (LS) and healthy skin. 4/20 were identified as part of the Residual Disease Genomic Profile (RGDP) or “Molecular Scar”.

Similar articles

Cited by

References

    1. Bowcock AM, Shannon W, Du F, Duncan J, Cao K, et al. (2001) Insights into psoriasis and other inflammatory diseases from large-scale gene expression studies. Hum Mol Genet 10: 1793–1805. - PubMed
    1. Gudjonsson JE, Ding J, Li X, Nair RP, Tejasvi T, et al. (2009) Global gene expression analysis reveals evidence for decreased lipid biosynthesis and increased innate immunity in uninvolved psoriatic skin. J Invest Dermatol 129: 2795–2804. - PMC - PubMed
    1. Oestreicher JL, Walters IB, Kikuchi T, Gilleaudeau P, Surette J, et al. (2001) Molecular classification of psoriasis disease-associated genes through pharmacogenomic expression profiling. Pharmacogenomics J 1: 272–287. - PubMed
    1. Yao Y, Richman L, Morehouse C, de los Reyes M, Higgs BW, et al. (2008) Type I interferon: potential therapeutic target for psoriasis? PLoS One 3: e2737. - PMC - PubMed
    1. Zhou X, Krueger JG, Kao MC, Lee E, Du F, et al. (2003) Novel mechanisms of T-cell and dendritic cell activation revealed by profiling of psoriasis on the 63,100-element oligonucleotide array. Physiol Genomics 13: 69–78. - PubMed

Publication types

Substances