

Genetic diversity, population structure and linkage disequilibrium in elite Chinese winter wheat investigated with SSR markers
- PMID: 22957076
- PMCID: PMC3434133
- DOI: 10.1371/journal.pone.0044510
Genetic diversity, population structure and linkage disequilibrium in elite Chinese winter wheat investigated with SSR markers
Abstract
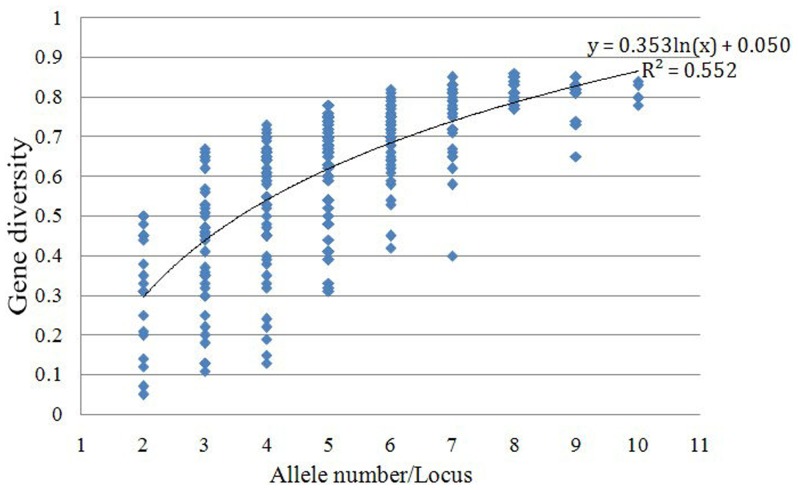
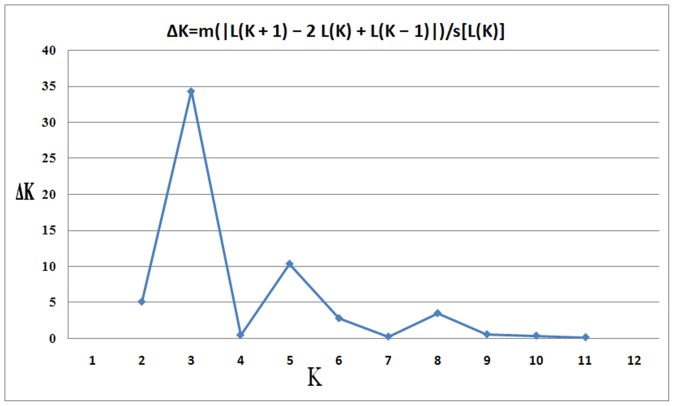
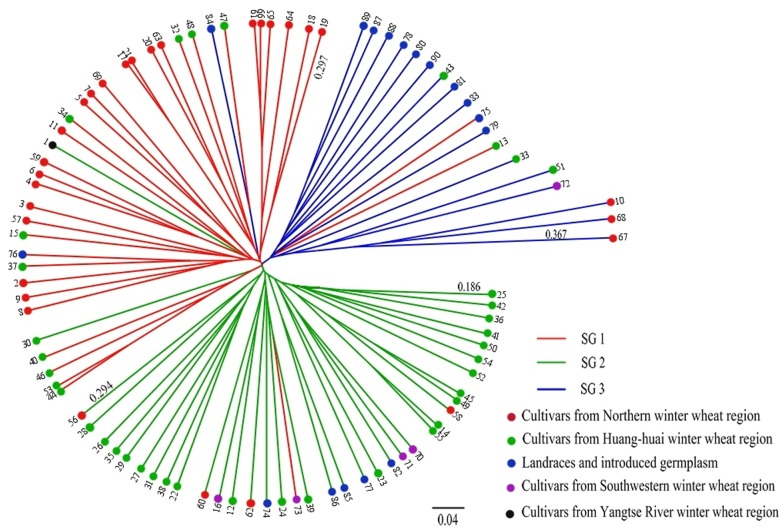
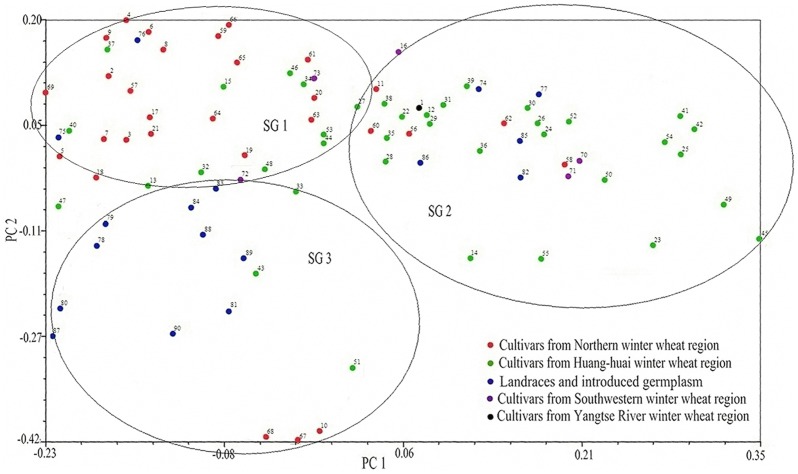
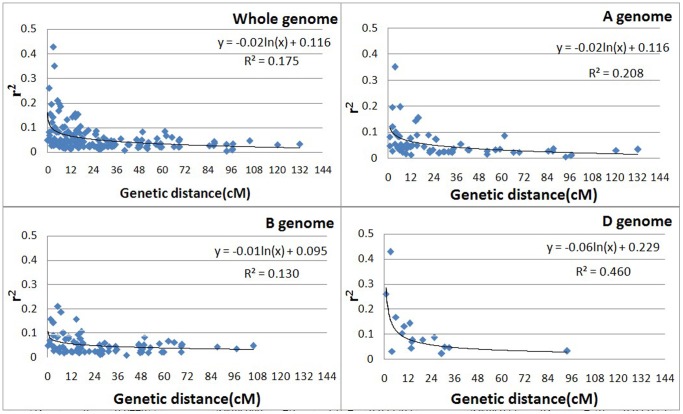
To ascertain genetic diversity, population structure and linkage disequilibrium (LD) among a representative collection of Chinese winter wheat cultivars and lines, 90 winter wheat accessions were analyzed with 269 SSR markers distributed throughout the wheat genome. A total of 1,358 alleles were detected, with 2 to 10 alleles per locus and a mean genetic richness of 5.05. The average genetic diversity index was 0.60, with values ranging from 0.05 to 0.86. Of the three genomes of wheat, ANOVA revealed that the B genome had the highest genetic diversity (0.63) and the D genome the lowest (0.56); significant differences were observed between these two genomes (P<0.01). The 90 Chinese winter wheat accessions could be divided into three subgroups based on STRUCTURE, UPGMA cluster and principal coordinate analyses. The population structure derived from STRUCTURE clustering was positively correlated to some extent with geographic eco-type. LD analysis revealed that there was a shorter LD decay distance in Chinese winter wheat compared with other wheat germplasm collections. The maximum LD decay distance, estimated by curvilinear regression, was 17.4 cM (r(2)>0.1), with a whole genome LD decay distance of approximately 2.2 cM (r(2)>0.1, P<0.001). Evidence from genetic diversity analyses suggest that wheat germplasm from other countries should be introduced into Chinese winter wheat and distant hybridization should be adopted to create new wheat germplasm with increased genetic diversity. The results of this study should provide valuable information for future association mapping using this Chinese winter wheat collection.
Conflict of interest statement
Figures

References
-
- Erlich A, Gelfand D, Sminsky JJ (1991) Recent advances in Polymerase Chain Reaction. Science. 252: 1643–1651. - PubMed
-
- Mullis KB (1990) The Unusual origin of Polymerase Chain Reaction. Sci. Am. 262: 56–65. - PubMed
-
- Huang Q, Borner A, Roder S, Ganal W (2002) Assessing genetic diversity of wheat (Triticum aestivum L.) germplasm using microsatellite markers. Theor. Appl. Genet. 105: 699–707. - PubMed
Publication types
MeSH terms
Substances
LinkOut - more resources
Full Text Sources
Molecular Biology Databases
Research Materials
