. 2012 Oct 23;6(10):8599-610.
doi: 10.1021/nn303371y. Epub 2012 Sep 13.

Direct in situ determination of the mechanisms controlling nanoparticle nucleation and growth

Affiliations

Direct in situ determination of the mechanisms controlling nanoparticle nucleation and growth

Taylor J Woehl et al. ACS Nano. .

Abstract

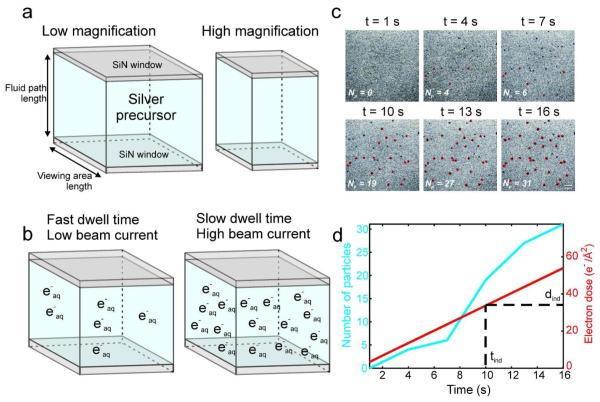
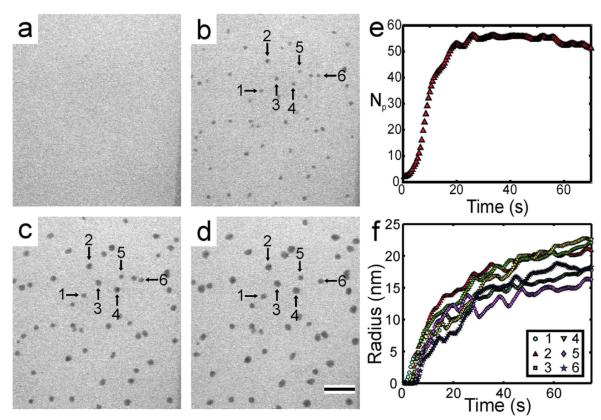
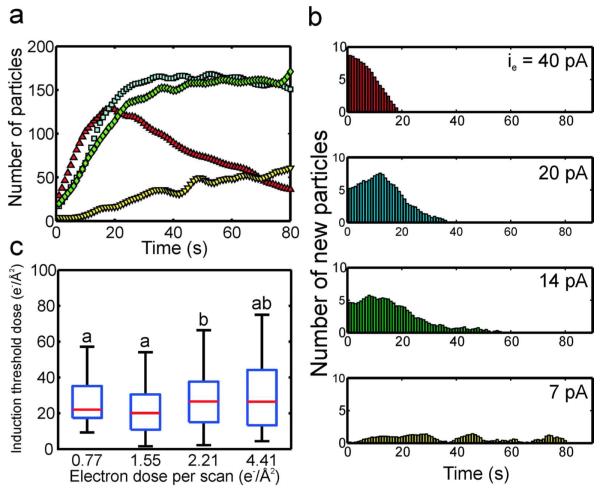
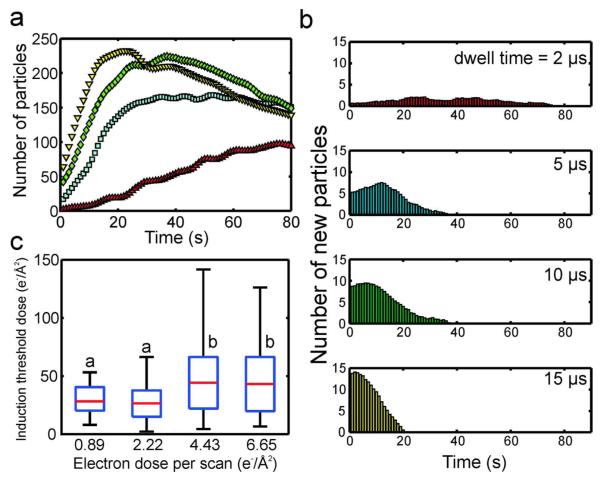
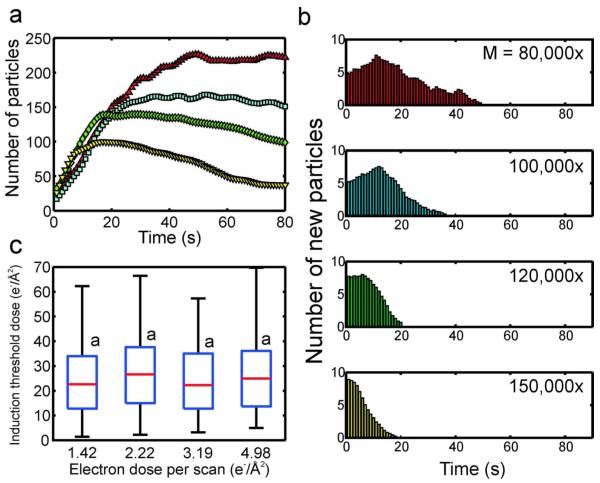
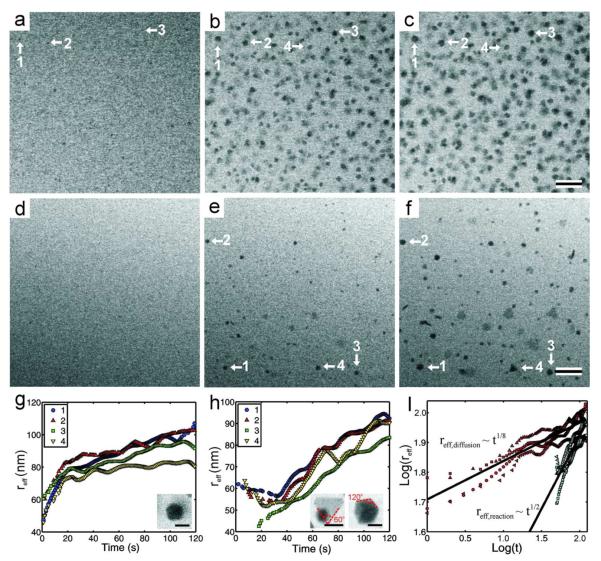
Although nanocrystal morphology is controllable using conventional colloidal synthesis, multiple characterization techniques are typically needed to determine key properties like the nucleation rate, induction time, growth rate, and the resulting morphology. Recently, researchers have demonstrated growth of nanocrystals by in situ electron beam reduction, offering direct observations of single nanocrystals and eliminating the need for multiple characterization techniques; however, they found nanocrystal morphologies consistent with two different growth mechanisms for the same electron beam parameters. Here we show that the electron beam current plays a role analogous to the concentration of reducing agent in conventional synthesis, by controlling the growth mechanism and final morphology of silver nanocrystals grown via in situ electron beam reduction. We demonstrate that low beam currents encourage reaction limited growth that yield nanocrystals with faceted structures, while higher beam currents encourage diffusion limited growth that yield spherical nanocrystals. By isolating these two growth regimes, we demonstrate a new level of control over nanocrystal morphology, regulated by the fundamental growth mechanism. We find that the induction threshold dose for nucleation is independent of the beam current, pixel dwell time, and magnification being used. Our results indicate that in situ electron microscopy data can be interpreted by classical models and that systematic dose experiments should be performed for all future in situ liquid studies to confirm the exact mechanisms underlying observations of nucleation and growth.


Figures

Figure 1
Figure 1
(a) Schematic representation of the interaction volume for in situ nanoparticle growth. The interaction volume is dictated by both the viewing area size and the fluid path length. At low nominal magnification the scan area is large, yielding a large interaction volume, while at higher magnification and identical fluid path length the scan area is relatively small, yielding a smaller interaction volume. (b) Schematic representation of the concentration of aqueous electrons in the interaction volume after a single STEM scan, showing the effect of pixel dwell time and beam current on radical production, while holding the interaction volume constant. (c) Time lapsed series of (cropped) BF-STEM images showing nucleation of silver nanocrystals from 1.0 mM AgNO3. The red outlines indicate particles that are detected by image analysis, while undetected particles are still below the detection threshold. The magnification is M = 100,000x, the frame rate is .33 fps, the dwell time is 5 μs, and the current density if ie = 40 pA, yielding an electron dose rate of 3.37 electrons/Å2 s. The scale bar is 100 nm. (d) The total number of particles (left axis) and the cumulative electron dose (right axis) as a function of time for the images in (c). The vertical dashed line marks the median nucleation induction time, while the horizontal dashed line marks the corresponding median induction dose.
Figure 2
Figure 2
Time lapsed series of (cropped) BF-STEM images showing growth of silver nanocrystals from 1.0 mM AgNO3 at t = 0 (a), 15 (b), 45 (c) and 75 s (d). The times are relative to the initial exposure of the area to the electron beam. M = 100,000x and ie = 40 pA, which corresponded to an electron dose rate of 3.37 electrons/Å2s. The scale bar in (d) is 200 nm. (e) The total number of particles (Np) as a function of time. The data was filtered with a running average of 5 seconds. (f) Radius as a function of time for the nanocrystals specified with arrows in (b-d). The data was filtered with a running average of 10 seconds.
Figure 3
Figure 3
(a) The number of nanocrystals as a function of time for four different beam currents, imaged at M = 100,000x and 5 μs pixel dwell time (red triangle: ie = 40 pA, blue square: ie = 20 pA, green diamond: ie = 14 pA, yellow inverted triangle: ie = 7 pA). (b) Histograms of the number of new particles as a function of time for each beam current. (c) Box plots of the induction threshold doses as a function of electron dose per scan (c.f. Methods for calculation of electron dose per scan from beam current). On each box, the central mark is the median, the edges of the box are the 25th (bottom edge) and 75th percentiles (top edge), and the whiskers extend to the most extreme data points not considered outliers. Values with a similar letter do not differ significantly (Wilcoxon rank sum test, P < 0.01).
Figure 4
Figure 4
(a) The number of nanocrystals as a function of time for four different pixel dwell times, imaged at M = 100,000x and ie = 20 pA. The dwell times were 2 (red triangle), 5 (blue square), 10 (green diamond) and 15 μs (yellow inverted triangle). (b) Histograms of the number of new particles as a function of time for each pixel dwell time. (c) Box plots of the induction threshold doses as a function of electron dose per scan (c.f. Methods for calculation of electron dose per scan from pixel dwell time). On each box, the central mark is the median, the edges of the box are the 25th (bottom edge) and 75th percentiles (top edge), and the whiskers extend to the most extreme data points not considered outliers. Values with a similar letter do not differ significantly (Wilcoxon rank sum test, P < 0.01).
Figure 5
Figure 5
(a) The number of nanocrystals as a function of time for four different magnifications, imaged with pixel dwell time of 5 μs and ie = 20 pA (red triangle: M = 80,000x, blue square: M = 100,000x, green diamond: M = 120,000x, yellow inverted triangle: M = 150,000x). (b) Histograms of the number of new particles as a function of time for each magnification. (c) Box plots of the induction threshold doses as a function of electron dose per scan (c.f. Methods for calculation of electron dose per scan from magnification). On each box, the central mark is the median, the edges of the box are the 25th (bottom edge) and 75th percentiles (top edge), and the whiskers extend to the most extreme data points not considered outliers. Values with a similar letter do not differ significantly (Wilcoxon rank sum test, P < 0.01).
Figure 6
Figure 6
(a)-(c) Time series of BF-STEM images taken at t = 0 (a), 60 (b), and 120 s (c), with ie = 40 pA, M = 100,000x, 5 μs dwell time, resulting in an electron dose rate of 3.37 electrons/(Å2s). (d)-(f) Time series of BF-STEM images taken at t = 0 (d), 60 (e), and 120 s (f), with ie = 7 pA, M = 100,000x, 5 μs dwell time, resulting in an electron dose rate of 0.59 electrons/(Å2s). The scale bar for both time series is 200 nm. (g) Plot of the effective radius (reff) as a function of time for 4 individual nanocrystals indicated in (a)-(c) with arrows. Inset is a higher magnification image showing the near spherical morphology of the resulting nanocrystal, the scale bar is 100 nm. (h) Plot of the effective radius (reff) as a function of time for 4 individual nanocrystals indicated in (d)-(f) with arrows. Inset are higher magnification images showing the faceted morphology of the resulting nanocrystals, the scale bars are 100 nm. (i) Logarithmic relationship between the effective radius and time. The red data points correspond to (g) while the blue correspond to (h), the different markers correspond to the individual nanocrystals indicated in the legends of (g) and (h). The black lines are the average power law fits for the 4 different nanocrystals, obtained by linear regression. A 10 point averaging filter was used on (g), (h), and (i) to reduce noise in the data.

References

    1. Schmid G. Synthesis of Metal Nanoparticles. In: Schmid G, editor. Nanoparticles: From Theory to Application. 2nd ed. Wiley-VCH; Weinheim: 2010. pp. 228–231.
    1. Milliron DJ, Hughes SM, Cui Y, Manna L, Li JB, Wang LW, Alivisatos AP. Colloidal Nanocrystal Heterostructures with Linear and Branched Topology. Nature. 2004;430:190–195. - PubMed
    1. Peng XG, Manna L, Yang WD, Wickham J, Scher E, Kadavanich A, Alivisatos AP. Shape Control of CdSe Nanocrystals. Nature. 2000;404:59–61. - PubMed
    1. Puntes VF, Krishnan KM, Alivisatos AP. Colloidal Nanocrystal Shape and Size Control: The Case of Cobalt. Science. 2001;291:2115–2117. - PubMed
    1. Yin Y, Alivisatos AP. Colloidal Nanocrystal Synthesis and the Organic-Inorganic Interface. Nature. 2005;437:664–670. - PubMed

Publication types